Project - Data Handling and Interpolation
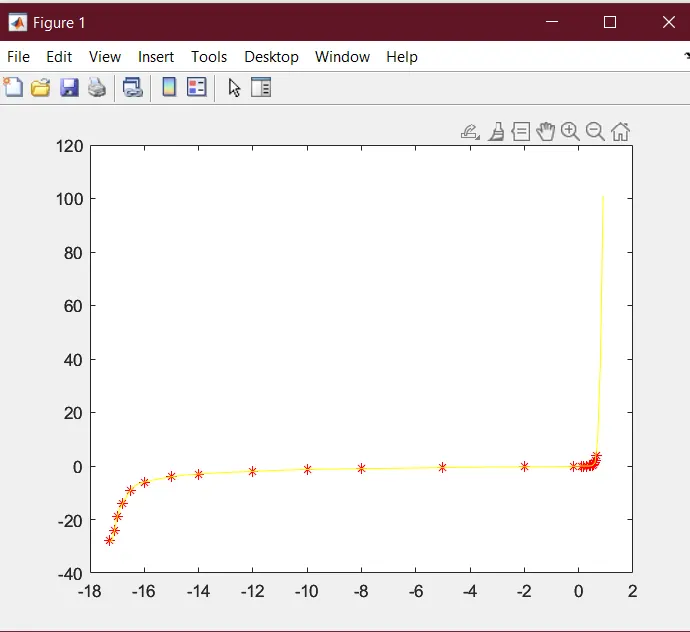
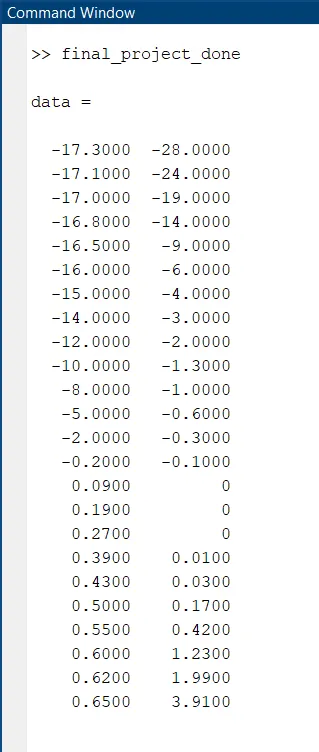
Project : In a laboratory experiment, data of voltage and current has been recorded and the same is attached in an excel file ( Click on this link VI.xlsx ). Read the excel file in the Matlab program and perform the interpolation in the range of -17.3:0.1:0.9. Generate the interactive plot for the interpolated data and store them in a text file.
ans :-
code :-
data= readmatrix('VI.xlsx') %taken data from the xlsx sheet
v=data(:,1); %where v is the voltage
i=data(:,2); %where i is the current
x=-17.3:0.1:0.9;
y=interp1(v,i,x,'spline');
plot(v,i,'*r',x,y,'-y');
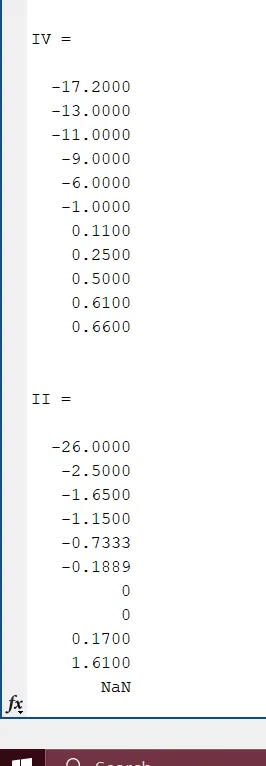
IV = [-17.2
-13
-11
-9
-6
-1
0.11
0.25
0.5
0.61
0.66]
II = interp1(v,i,IV)
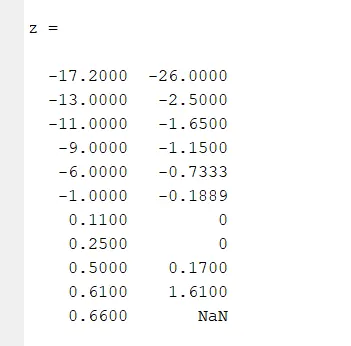
z = [IV II]
fileID=fopen('IVII.txt','w');
%saving file in text file
fprintf(fileID,'%8s %13s\n','IV','II');
fclose(fileID);
output :-
NOTE :- TEXT FILE IS EMPTY , BUT IT IS verified BY TECHNICAL SUPPORT