Project - Data Handling and Interpolation
file=xlsread('VI.xlsx');%to read excel file VI using xlsread command
format compact;
V=file(:,1);%input to first column
I=file(:,2);%input to second column
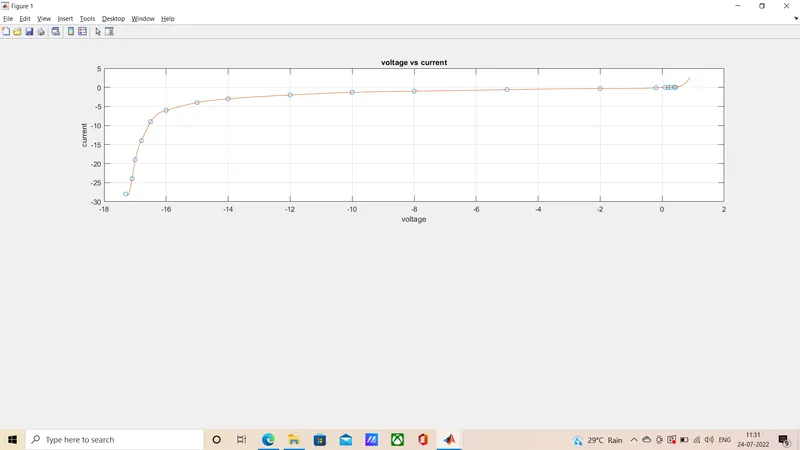
x=-17.3:0.1:0.9;
y=interp1(V,I,x,'spline');%interpolation with V,I corresponds to x
subplot(211);
plot(V,I,'o',x,y) %graphical representation
grid on
title('voltage vs current')
xlabel('voltage')
ylabel('current')
VV=[-17.2;-17.1;-13.8;-13.5;-13.0;-12.5;-11;-9;-5.76;-6;-1;0.11;0.25;0.5;0.61];
II=interp1(V,I,VV);%interpolation with V,I corresponds to VV
z=[VV II];
fileid=fopen("VVII.txt",'w'); %write to text file VVII
fprintf(fileid,'%6s%12s\n','VV','II');%define header as VV II
fprintf(fileid,'%6.2f%12.8f\n',z);%accept input from varaible z
fclose(fileid);
command window:
>> V
V =
-17.3000
-17.1000
-17.0000
-16.8000
-16.5000
-16.0000
-15.0000
-14.0000
-12.0000
-10.0000
-8.0000
-5.0000
-2.0000
-0.2000
0.0900
0.1900
0.2700
0.3900
0.4300
>> I
I =
-28.0000
-24.0000
-19.0000
-14.0000
-9.0000
-6.0000
-4.0000
-3.0000
-2.0000
-1.3000
-1.0000
-0.6000
-0.3000
-0.1000
0
0
0
0.0100
0.0300
>> VV
VV =
-17.2000
-17.1000
-13.8000
-13.5000
-13.0000
-12.5000
-11.0000
-9.0000
-5.7600
-6.0000
-1.0000
0.1100
0.2500
0.5000
0.6100
>> II
II =
-26.0000
-24.0000
-2.9000
-2.7500
-2.5000
-2.2500
-1.6500
-1.1500
-0.7013
-0.7333
-0.1889
0
0
NaN
NaN
>> z
z =
-17.2000 -26.0000
-17.1000 -24.0000
-13.8000 -2.9000
-13.5000 -2.7500
-13.0000 -2.5000
-12.5000 -2.2500
-11.0000 -1.6500
-9.0000 -1.1500
-5.7600 -0.7013
-6.0000 -0.7333
-1.0000 -0.1889
0.1100 0
0.2500 0
0.5000 NaN
0.6100 NaN
>> projectVIInterpolation
>>
V =
-17.3000
-17.1000
-17.0000
-16.8000
-16.5000
-16.0000
-15.0000
-14.0000
-12.0000
-10.0000
-8.0000
-5.0000
-2.0000
-0.2000
0.0900
0.1900
0.2700
0.3900
0.4300
>> I
I =
-28.0000
-24.0000
-19.0000
-14.0000
-9.0000
-6.0000
-4.0000
-3.0000
-2.0000
-1.3000
-1.0000
-0.6000
-0.3000
-0.1000
0
0
0
0.0100
0.0300
>> VV
VV =
-17.2000
-17.1000
-13.8000
-13.5000
-13.0000
-12.5000
-11.0000
-9.0000
-5.7600
-6.0000
-1.0000
0.1100
0.2500
0.5000
0.6100
>> II
II =
-26.0000
-24.0000
-2.9000
-2.7500
-2.5000
-2.2500
-1.6500
-1.1500
-0.7013
-0.7333
-0.1889
0
0
NaN
NaN
>> z
z =
-17.2000 -26.0000
-17.1000 -24.0000
-13.8000 -2.9000
-13.5000 -2.7500
-13.0000 -2.5000
-12.5000 -2.2500
-11.0000 -1.6500
-9.0000 -1.1500
-5.7600 -0.7013
-6.0000 -0.7333
-1.0000 -0.1889
0.1100 0
0.2500 0
0.5000 NaN
0.6100 NaN
>> projectVIInterpolation
>>