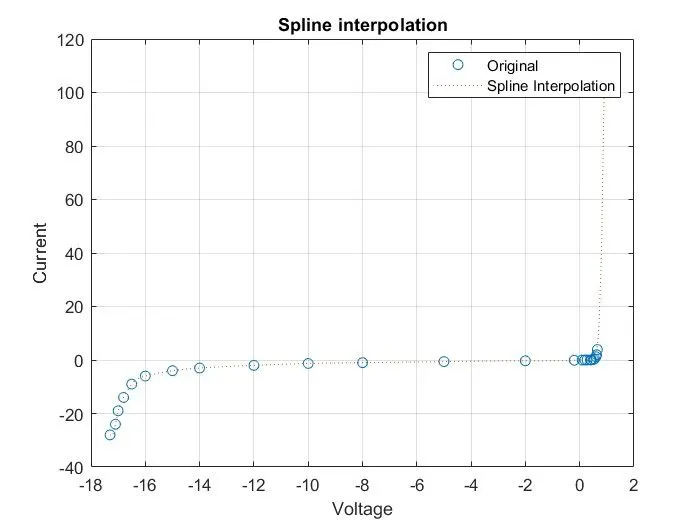
Project - Data Handling and Interpolation
THIS IS THE CODE FOR READING XLSX FILE AND GENERATING DATA INTERPOLATION
M = xlsread("VI.xlsx")
V=M(:,1);
I=M(:,2)
xq = [-17.3:0.1:0.9];
xq1=interp1(V,I,xq,"linear");
xq2=interp1(V,I,xq,"spline")
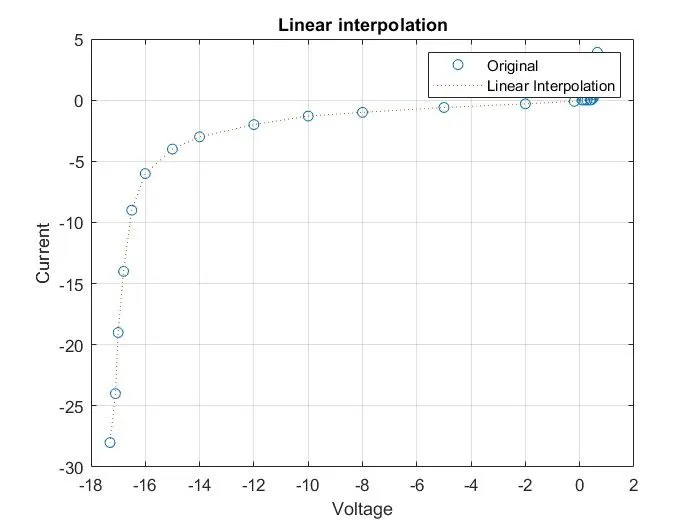
figure(1);
plot(V,I,'o',xq,xq1,':');
xlabel('Voltage');
ylabel('Current');
legend('Original','Linear Interpolation')
grid on;
title('Linear interpolation')
figure(2);
plot(V,I,'o',xq,xq2,':');
grid on;
title('Spline interpolation')
xlabel('Voltage');
ylabel('Current');
legend('Original','Spline Interpolation')
grid on;
.THIS GRAPH REPRESENTS LINEAR INTERPOLATION
.. THIS GRAPH REPRESENTS SPLINE INTERPOLATION