Project - Data Handling and Interpolation
comment
matlab command
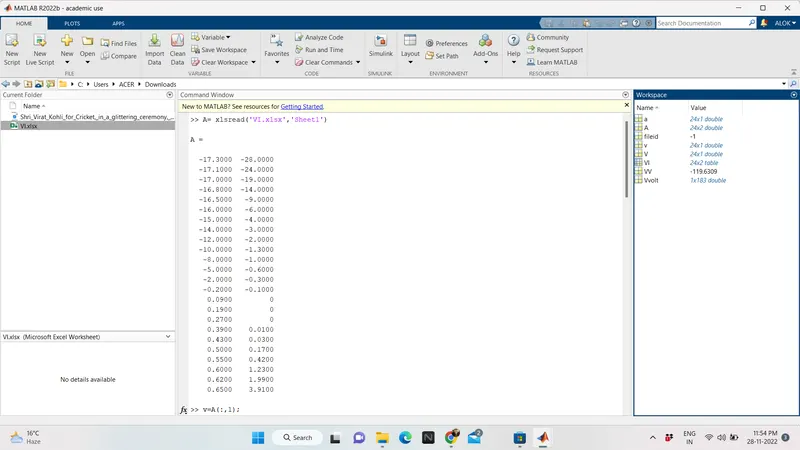
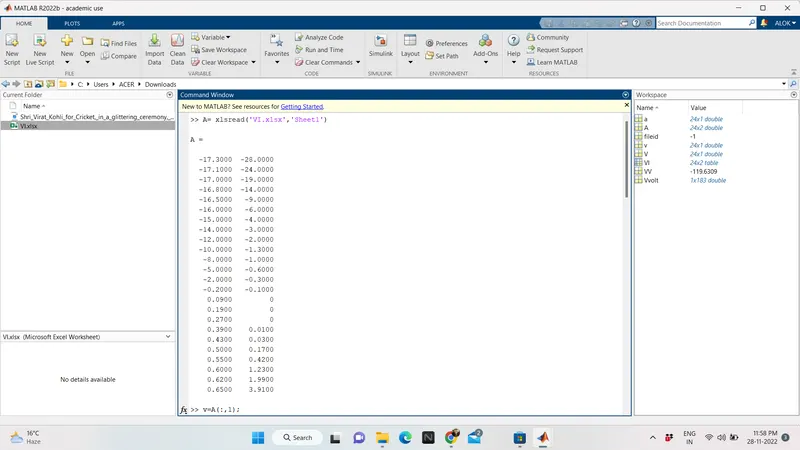
A= xlsread('VI.xlsx','Sheet1')
A =
-17.3000 -28.0000
-17.1000 -24.0000
-17.0000 -19.0000
-16.8000 -14.0000
-16.5000 -9.0000
-16.0000 -6.0000
-15.0000 -4.0000
-14.0000 -3.0000
-12.0000 -2.0000
-10.0000 -1.3000
-8.0000 -1.0000
-5.0000 -0.6000
-2.0000 -0.3000
-0.2000 -0.1000
0.0900 0
0.1900 0
0.2700 0
0.3900 0.0100
0.4300 0.0300
0.5000 0.1700
0.5500 0.4200
0.6000 1.2300
0.6200 1.9900
0.6500 3.9100
>> v=A(:,1);
>> a=A(:,2);
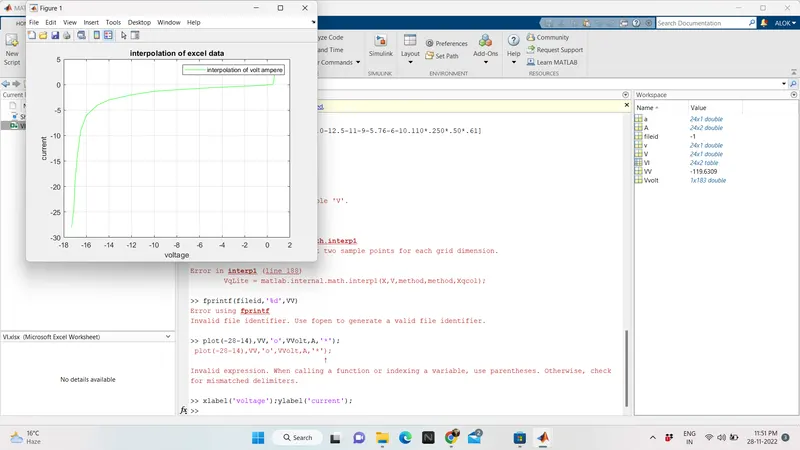
>> plot(v,a,'-g');grid;hold;
Current plot held
>> xlabel('Volt');ylabel('Ampere');
>> legend('interpolation of volt ampere');
>> title('interpolation of excel data');
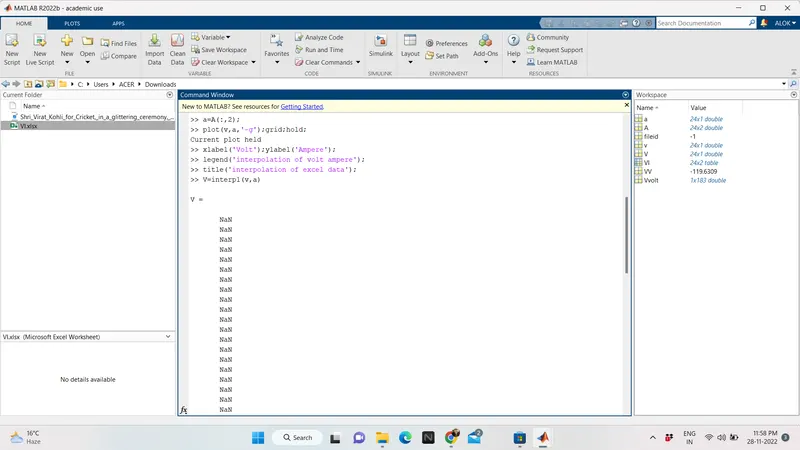
>> V=interp1(v,a)
V =
NaN
NaN
NaN
NaN
NaN
NaN
NaN
NaN
NaN
NaN
NaN
NaN
NaN
NaN
NaN
NaN
NaN
NaN
NaN
NaN
NaN
-17.2540
-17.1020
-16.8180
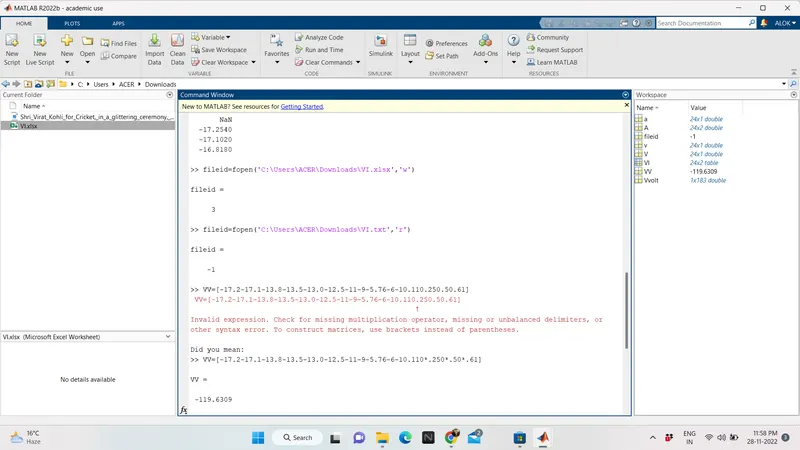
>> fileid=fopen('C:\Users\ACER\Downloads\VI.xlsx','w')
fileid =
3
>> fileid=fopen('C:\Users\ACER\Downloads\VI.txt','r')
fileid =
-1
>> VV=[-17.2-17.1-13.8-13.5-13.0-12.5-11-9-5.76-6-10.110.250.50.61]
VV =
-119.6309
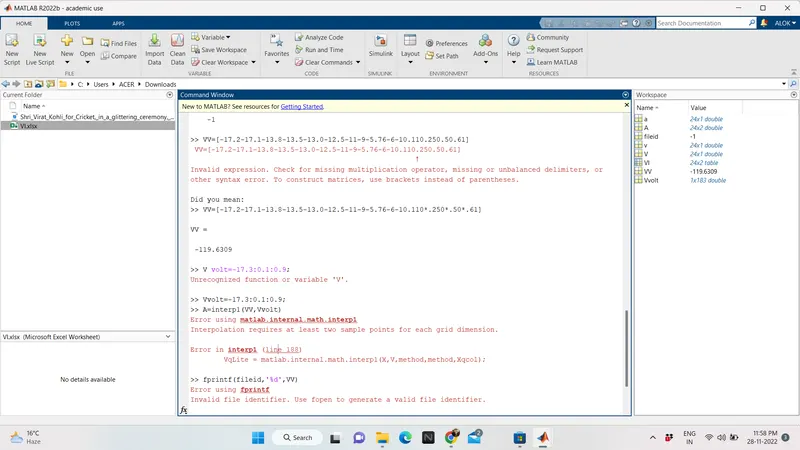
>> V volt=-17.3:0.1:0.9;
>> A=interp1(VV,Vvolt)
>> fprintf(fileid,'%d',VV)
>> plot(-28-14),VV,'o',VVolt,A,'*');
>> xlabel('voltage');ylabel('current');
interpolation of excel data: