Project - Data Handling and Interpolation
Project :
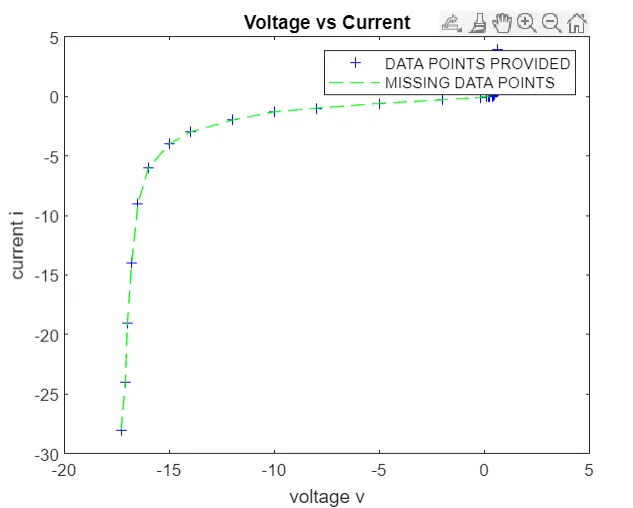
In a laboratory experiment, data of voltage and current has been recorded and the same is attached in an excel file ( Click on this link VI.xlsx ). Read the excel file in the Matlab program and perform the interpolation in the range of -17.3:0.1:0.9. Generate the interactive plot for the interpolated data and store them in a text file.
ANSWER :
Interpolation : Interpolation is a process of determining the unknown values that lie in between the known data points
Matlab code :
clc;
clear all;
% Read excel file
my=readmatrix('VI.xlsx');
X= my(:,1);
Y= my(:,2);
% Interpolation of data
xq= -17.3:0.1:0.9;
k = interp1(X,Y,xq);
plot(X,Y,'b +',xq,k,'g --');
xlabel('voltage v');
ylabel('current i');
legend('DATA POINTS PROVIDED','MISSING DATA POINTS');
title('voltage vs current');

% saving Test File
fileID = fopen('project_1.txt','W');
fprintf(fileID,'%8S %10S\n','V(volt)','I(mAmp)');
fprintf(fileID,'%f %f\n',k);
fclose(fileID);
OUTPUT: