Project - Data Handling and Interpolation
clc; %to clear the screen
clear all; %to clear the variables from workspace
data = xlsread('VI_project.xlsx'); %opening excel file
V = data(:,1); %reading first column
I = data(:,2); %reading 2nd column
x = -17.3:0.1:0.9; %define range for interpolation
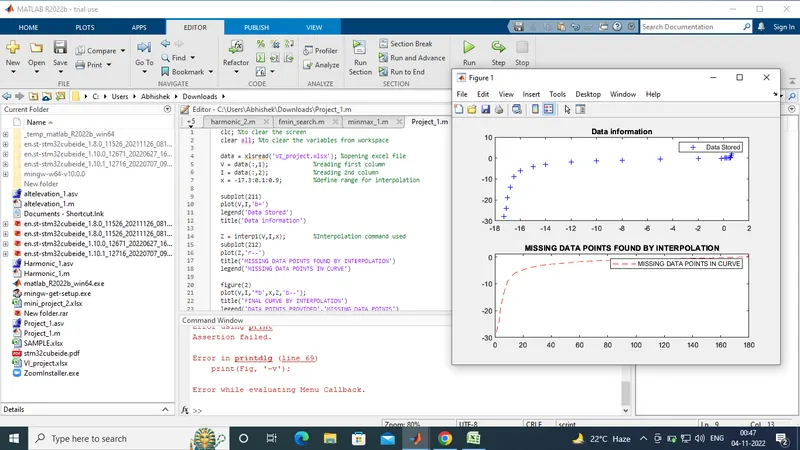
subplot(211)
plot(V,I,'b+')
legend('Data Stored')
title('Data information')
Z = interp1(V,I,x); %Interpolation command used
subplot(212)
plot(Z,'r--')
title('MISSING DATA POINTS FOUND BY INTERPOLATION')
legend('MISSING DATA POINTS IN CURVE')
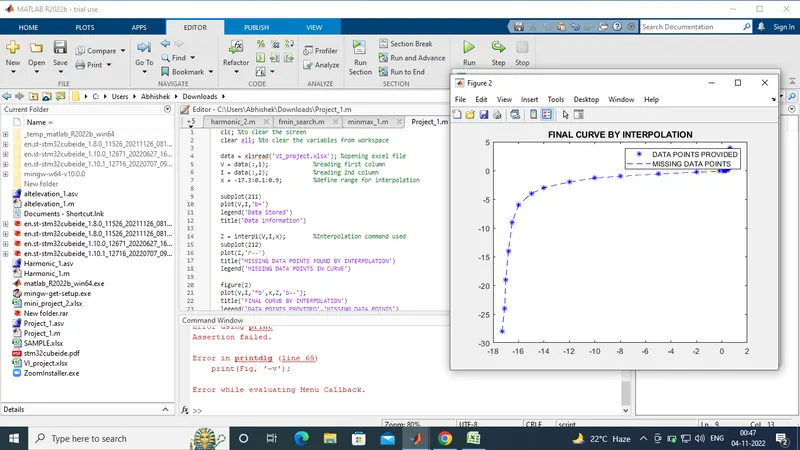
figure(2)
plot(V,I,'*b',x,Z,'b--');
title('FINAL CURVE BY INTERPOLATION')
legend('DATA POINTS PROVIDED','MISSING DATA POINTS')
- Hariharan Vis this your 1st challenge ?