Project - Data Handling and Interpolation
Projcet :
Steps:
1) Read the excel file data
2) Interpolation of given data to find the missing data
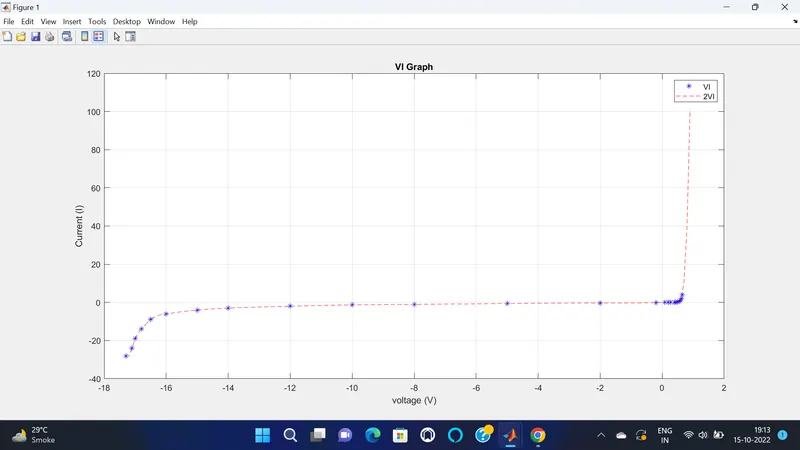
3) Ploted given data and interpolation data
4) Arrnage in the matrix format
5) Write the data in the txt file.
Progaram:
clc
clear
x=xlsread('VI.xlsx');
%Read the data in given exelfile
volt=x(:,1);
%assign the volatge coloum vector
current=x(:,2);
%assign the current coloum vector
y=-17.3:0.1:0.9;
%interpolation of missing data stored in z
z=interp1(volt,current,y,"spline");
%ploted given data & interpolation data
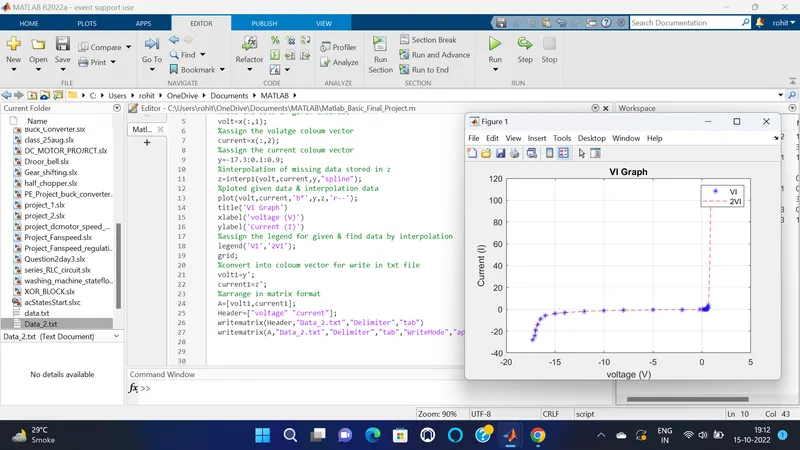
plot(volt,current,'b*',y,z,'r--');
title('VI Graph')
xlabel('voltage (V)')
ylabel('Current (I)')
%assign the legend for given & find data by interpolation
legend('VI','2VI');
grid;
%convert into coloum vector for write in txt file
volt1=y';
current1=z';
%arrange in matrix format
A=[volt1,current1];
Header=["voltage" "current"];
writematrix(Header,"Data_2.txt","Delimiter","tab")
writematrix(A,"Data_2.txt","Delimiter","tab","WriteMode","append")
Screenshot of Plots and Program: