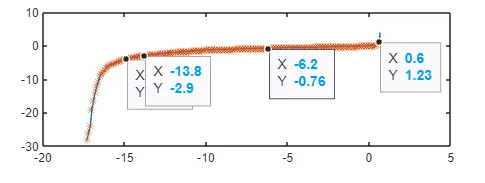
Project - Data Handling and Interpolation
x=xlsread('VI.xlsx');
v=x(:,1);
i=x(:,2);
y=[-17.3:0.1:0.9];
yq=interp1(v,i,y,"linear");
plot(v,i);
subplot (2,1,1);
plot(v,i,y,yq,'*');
hold on
vv=[-17.2
-16.2
-15.2
-14.2
-13.2
-12.2
-11.2
-10.2
-9.2
-8.2
-7.2];
ii=interp1(v,i,vv,'linear');
z=[vv ii];
subplot(2,1,1);
plot(vv,ii);
save('VI.xlsx');