Project - Data Handling and Interpolation
ANSWER
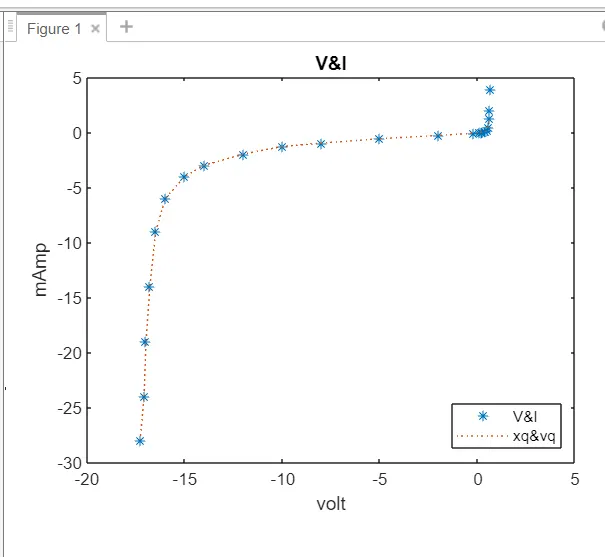
AIM :In a laboratory experiment, data of voltage and current has been recorded and the same is attached in an excel file ( Click on this link VI.xlsx ). Read the excel file in the Matlab program and perform the interpolation in the range of -17.3:0.1:0.9. Generate the interactive plot for the interpolated data and store them in a text file.
TO FIND :
- Find missing data and save it in text
- Interpolate the data set
- Save your program and attach the same.
- Save txt file and upload in attachment
SOLUTION :
PROGRAME :
clc
close all
d=xlsread('VI.xlsx');
v=d(:,1);
i=d(:,2);
xq = -17.3:0.1:0.9;
vq= interp1(v,i,xq);
plot(v,i,'*',xq,vq,':')
xlabel('volt')
ylabel('mAmp')
title('V&I')
legend('V&I','xq&vq','location','southeast')
writematrix(vq,'V&Ioutput.txt');
RESULT :