Project - Data Handling and Interpolation
>> clear all
>> fidl=fopen('VI.xlsx','r');
>> fid=fopen('VI.txt','w');
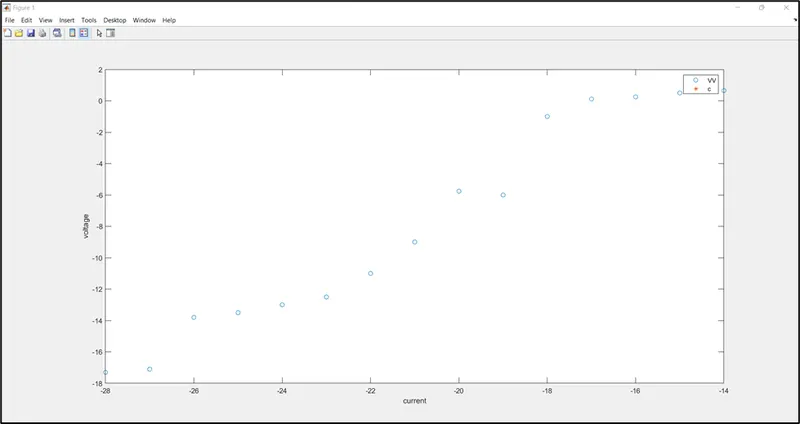
>> VV =[-17.3 -17.1 -13.8 -13.5 -13.0 -12.5 -11 -9 -5.76 -6 -1 0.11 0.25 0.5 0.65];
>> VVolt=-17.3:0.1:0.9;
>> c=interp1(VV,VVolt);
>> fprintf(fid,'%d',VV);
>> figure;
>> plot((-28:-14),VV,'o',VVolt,c,'*');
>> ylabel('voltage');
>> xlabel('current');
>> legend('VV','c');
OUTPUT: