Project - Data Handling and Interpolation
data=xlsread('reading.xlsx',1); %loading the data from the excel sheet.
v=data(:,1); %loading readings of volgtage v.
i=data(:,2); %loading readings of current i.
missed=xlsread('reading.xlsx',2); % loading missed reading from the excel sheet.
m=missed(:,1); %loading the missed readings
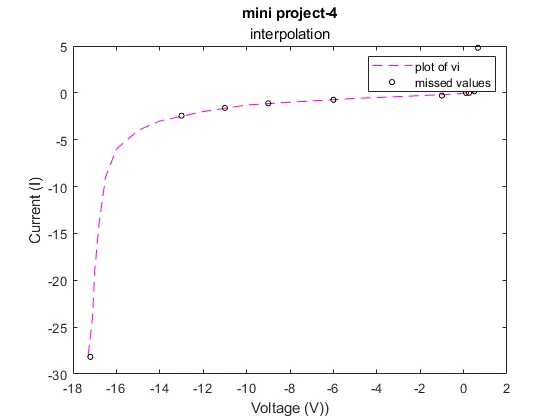
plot (v,i,'--m') % plotting the values of voltage and current.
hold on
t=interp1(v,i,m,'spline'); %applying the interpolation method to get missed data.
plot(m,t,'ok','Markersize',4) % plotting missed reading in the graph.
title('mini project-4','interpolation');
xlabel('Voltage (V))');
ylabel('Current (I)');
legend('plot of vi','missed values');
disp(data);
disp(v);
disp(i);
disp(missed);
disp(m);
disp(t);
save("miniproject4.txt"); % saving output to text file.
out put
>> miniproject4
-17.3000 -28.0000
-17.1000 -24.0000
-17.0000 -19.0000
-16.8000 -14.0000
-16.5000 -9.0000
-16.0000 -6.0000
-15.0000 -4.0000
-14.0000 -3.0000
-12.0000 -2.0000
-10.0000 -1.3000
-8.0000 -1.0000
-5.0000 -0.6000
-2.0000 -0.3000
-0.2000 -0.1000
0.0900 0
0.1900 0
0.2700 0
0.3900 0.0100
0.4300 0.0300
0.5000 0.1700
0.5500 0.4200
0.6000 1.2300
0.6200 1.9900
0.6500 3.9100
-17.3000
-17.1000
-17.0000
-16.8000
-16.5000
-16.0000
-15.0000
-14.0000
-12.0000
-10.0000
-8.0000
-5.0000
-2.0000
-0.2000
0.0900
0.1900
0.2700
0.3900
0.4300
0.5000
0.5500
0.6000
0.6200
0.6500
-28.0000
-24.0000
-19.0000
-14.0000
-9.0000
-6.0000
-4.0000
-3.0000
-2.0000
-1.3000
-1.0000
-0.6000
-0.3000
-0.1000
0
0
0
0.0100
0.0300
0.1700
0.4200
1.2300
1.9900
3.9100
-17.2000
-13.0000
-11.0000
-9.0000
-6.0000
-1.0000
0.1100
0.2500
0.5000
0.6100
0.6600
-17.2000
-13.0000
-11.0000
-9.0000
-6.0000
-1.0000
0.1100
0.2500
0.5000
0.6100
0.6600
-28.1734
-2.4298
-1.6103
-1.1164
-0.7445
-0.2906
0.0012
-0.0001
0.1700
1.5665
4.8092
>>