Project - Data Handling and Interpolation
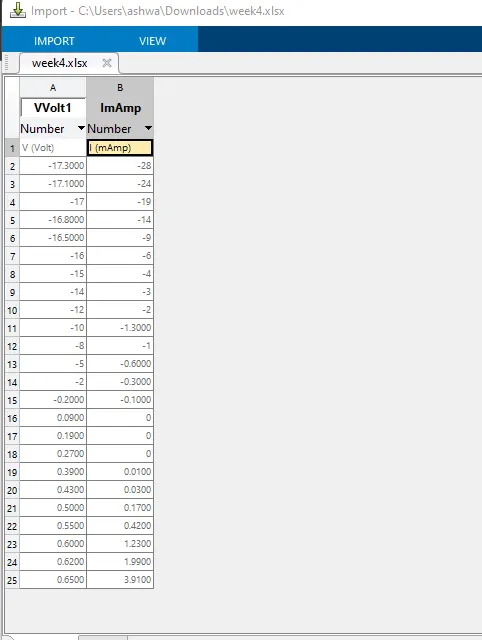
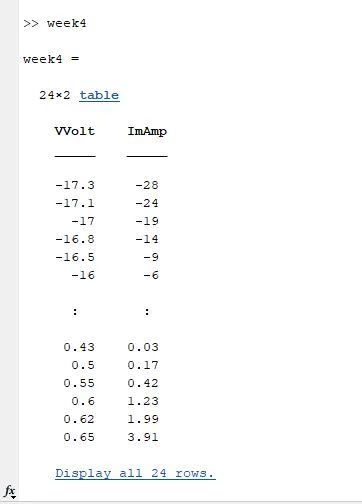
Given file read in matlab program
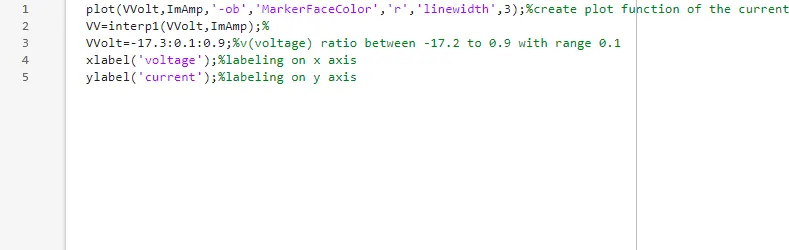
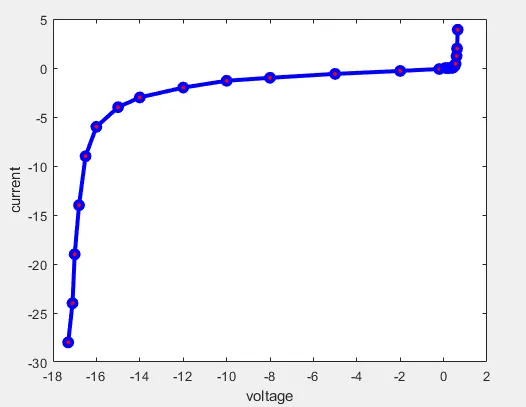
plot(VVolt,ImAmp,'-ob','MarkerFaceColor','r','linewidth',3);%create plot function of the current and ampere
VV=interp1(VVolt,ImAmp);%
VVolt=-17.3:0.1:0.9;%v(voltage) ratio between -17.2 to 0.9 with range 0.1
xlabel('voltage');%labeling on x axis
ylabel('current');%labeling on y axis
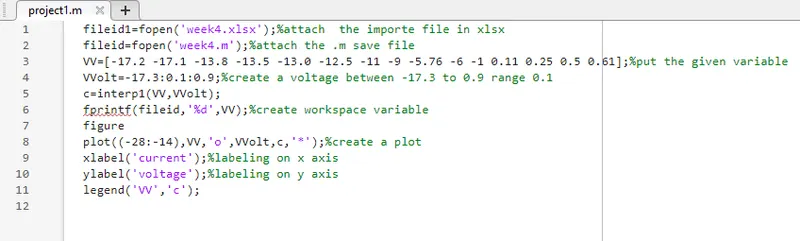
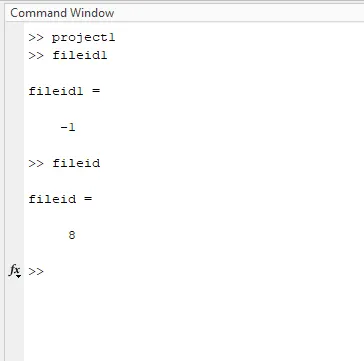
fileid1=fopen('week4.xlsx');%attach the importe file in xlsx
fileid=fopen('week4.m');%attach the .m save file
VV=[-17.2 -17.1 -13.8 -13.5 -13.0 -12.5 -11 -9 -5.76 -6 -1 0.11 0.25 0.5 0.61];%put the given variable
VVolt=-17.3:0.1:0.9;%create a voltage between -17.3 to 0.9 range 0.1
c=interp1(VV,VVolt);
fprintf(fileid,'%d',VV);%create workspace variable
figure
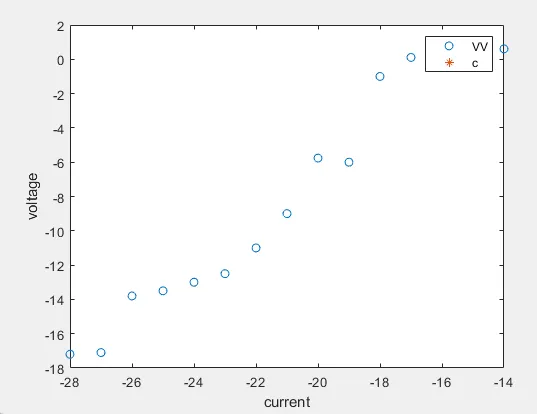
plot((-28:-14),VV,'o',VVolt,c,'*');%create a plot
xlabel('current');%labeling on x axis
ylabel('voltage');%labeling on y axis
legend('VV','c');