Project - Data Handling and Interpolation
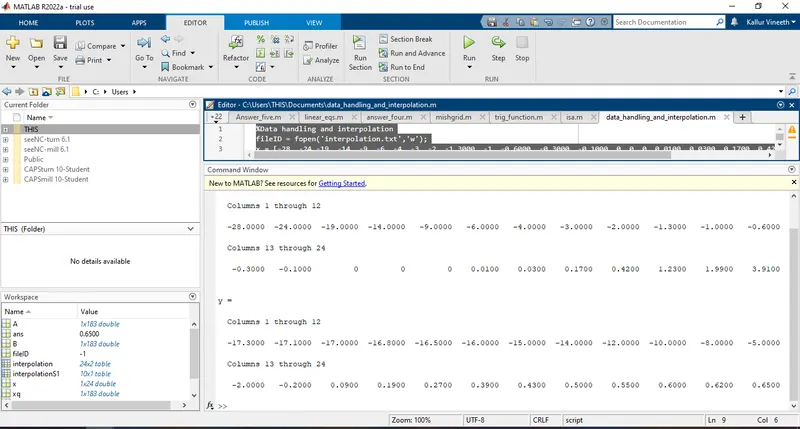
%Data handling and interpolation
fileID = fopen('interpolation.txt','w');
x = [-28 ,-24,-19, -14, -9, -6, -4, -3, -2, -1.3000, -1, -0.6000, -0.3000, -0.1000, 0, 0, 0, 0.0100, 0.0300, 0.1700, 0.4200, 1.2300, 1.9900, 3.9100]
y = [-17.3, -17.1, -17, -16.8, -16.5, -16, -15, -14, -12, -10, -8, -5, -2, -0.2, 0.09, 0.19, 0.27, 0.39, 0.43, 0.5, 0.55, 0.6, 0.62, 0.65]
A = [-17.3:0.1:0.9];
B = interp1(y,x,xq);
figure(1);
plot(x,y,'o',xq,xq1,':');
grid;