Project - Data Handling and Interpolation
Project - Data Handling and Interpolation
AIM
To plot a graph of Voltage VS Current and interpolate it to predict for a new set of values.
Code
clear all
clc
% Reading excel file
Data=xlsread('VI.xlsx');
V=Data(:,1); % First Column contains the Voltage values
I=Data(:,2); % Second Column contains the Current values
% Parameters
IR=-17.3:0.1:0.9; % Interpolation Range
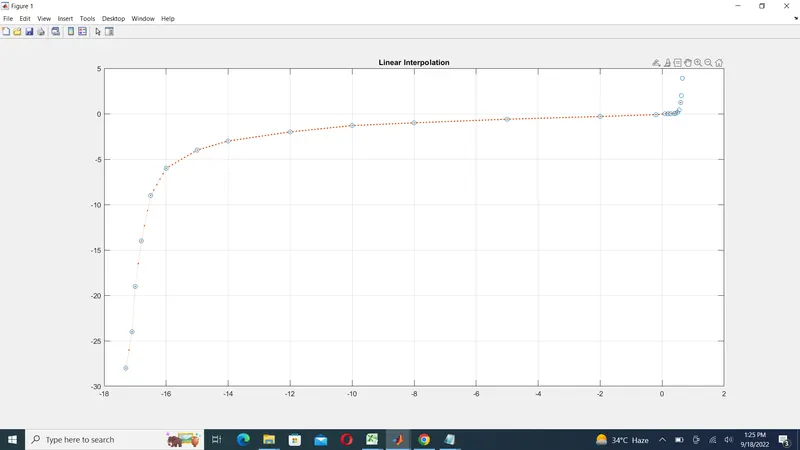
LI=interp1(V,I,IR); % Linear Interpolation
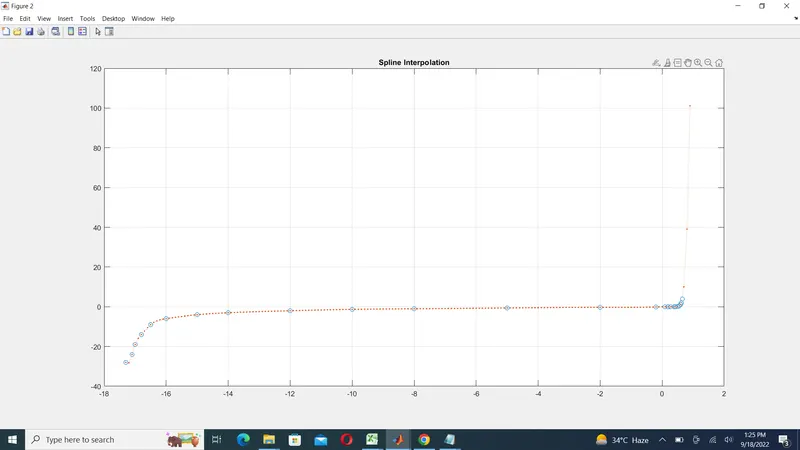
SI=interp1(V,I,IR,'spline'); % Spline Interpolation
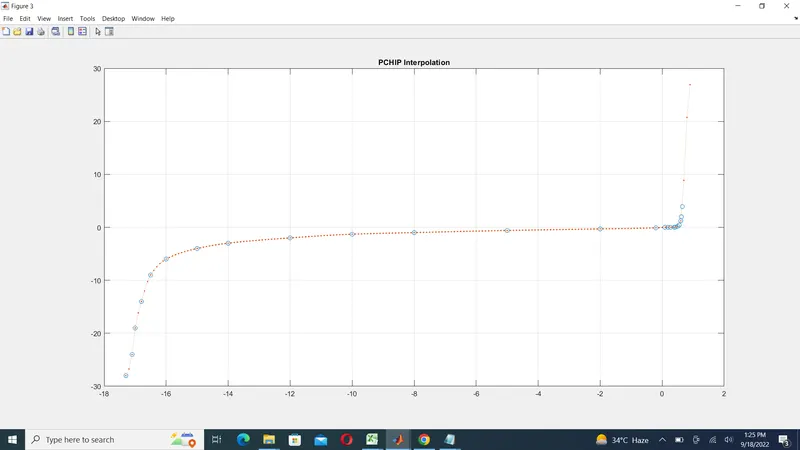
PI=interp1(V,I,IR,'pchip'); % PCHIP Interpolation
% Plots
% Plot 1
figure(1)
plot(V,I,'o',IR,LI,':.') % Plotting Linear Interpolation
grid
title('Linear Interpolation')
% Plot 2
figure(2)
plot(V,I,'o',IR,SI,':.') % Plotting Spline Interpolation
grid
title('Spline Interpolation')
% Plot 3
figure(3)
plot(V,I,'o',IR,PI,':.') % Plotting PCHIP Interpolation
grid
title('PCHIP Interpolation')
% Final Interpolation
V_new =[-17.2 -13 -11 -9 -6 -1 0.11 0.25 0.5 0.61 0.66]; % New Coltage values
I_new=interp1(V,I,V_new); % Linear Interpolation for Current calculation
figure(4)
plot(V_new,I_new,'o--') % Plotting Linear Interpolation
grid
title('New Value Interpolation')
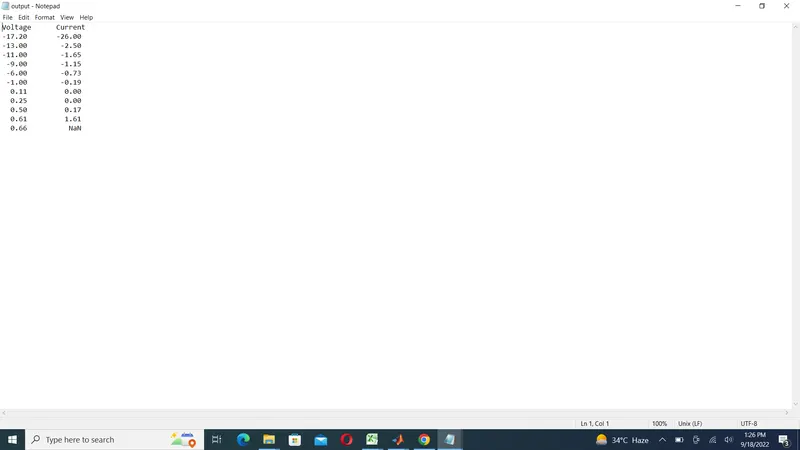
% Saving Output File
Output_Data=[V_new;I_new]; % Saving Output Matrix
fid=fopen('output.txt','w'); % Writing to text file
fprintf(fid,'%6s %12s\n','Voltage','Current'); % Writing title of the columns
fprintf(fid,'%6.2f %12.2f\n',Output_Data); % Writing Output values
fclose(fid);
Graph
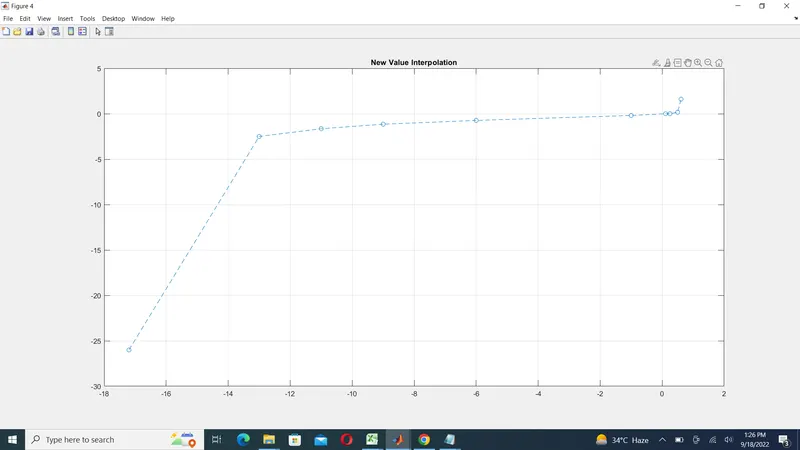
Result