Project - Data Handling and Interpolation
AIM:
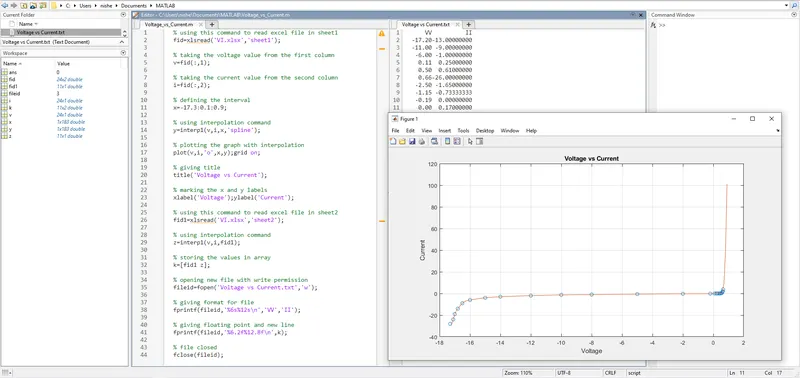
Generating the interactive plot for the interpolated data and store them in a text file.
PROCEDURE:
STEP 1:Getting the voltage and current value from the given excel sheet.
STEP 2:Defining the intervals from the given data and using the interpolation command.
STEP 3:plotting the graph using the interpolated data.
STEP 4:save the output in the 'txt' file.
CODE AND OUTPUT: