Project - Data Handling and Interpolation
Project : Data Handling and Interpolation
>> f = xlsread('Volt_and_Current.txt.xlsx');%Reading the Excel File
>> V = f(:,1);%sorting first column value of 'f' in 'A'
>> I = f(:,2);%storing second column value of 'f' in 'A'
>> Vinp = -17.3:0.1:0.9;%Creating Given range of Data mentioned in problem
>> Iinp = interp1(V,I,Vinp,"spline");%using 'interp1' function for calculating Current value for given % Voltage Range 'Vinp'
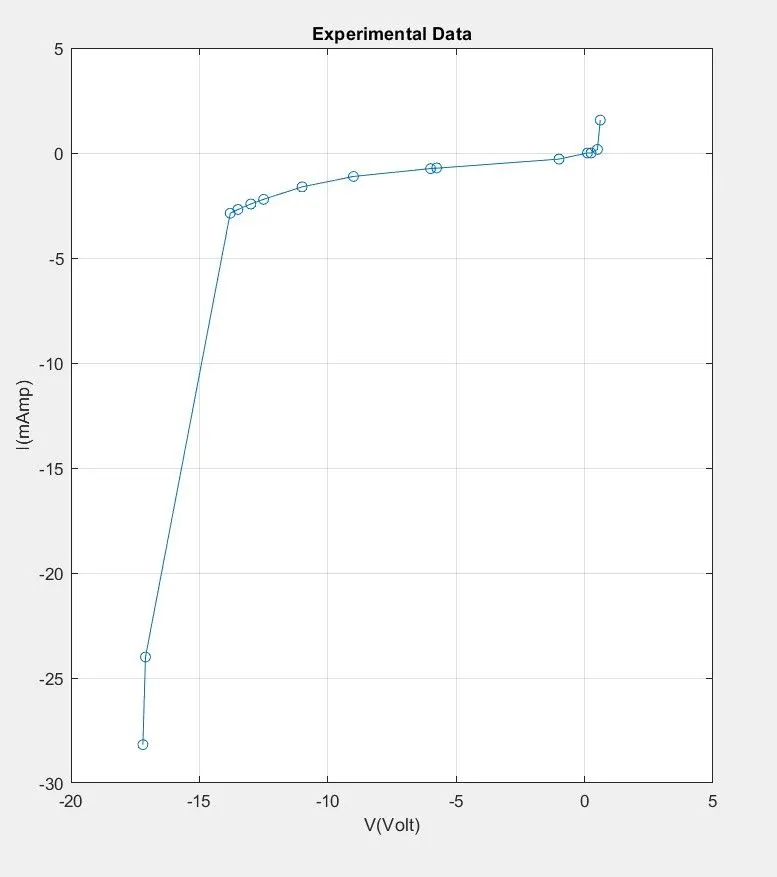
>> figure(1);
>> subplot(121)
>> plot(V,I,'-o');grid;%ploting trig_function with Time
>> title('Experimental Data');%giving title for the Figure
>> ylabel('I(mAmp)');xlabel('V(Volt)');%giving labels to the xy Axis for recognition
>> axis([-20 5 -30 5]);%Definig axis limits
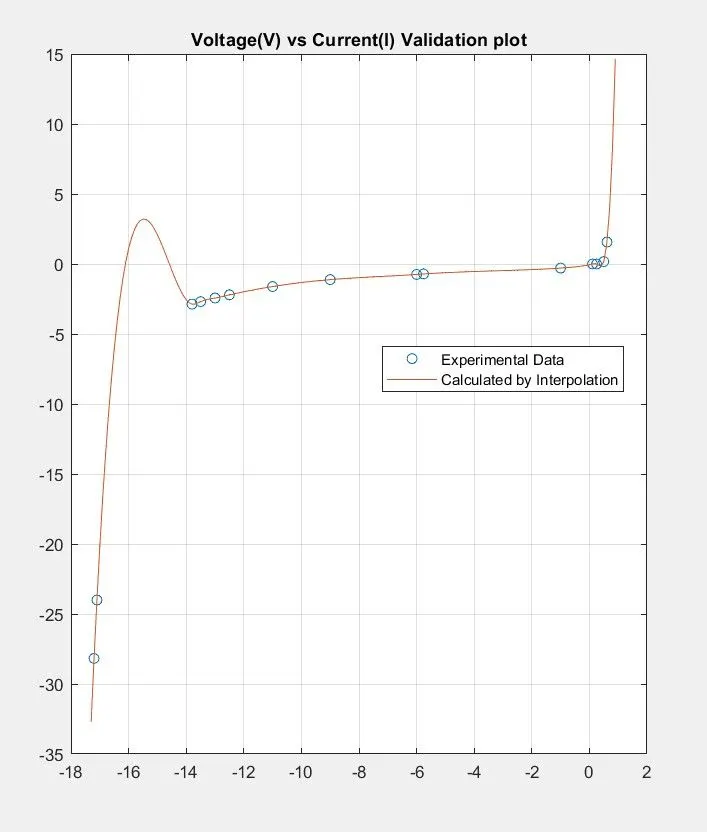
>> figure(2);
>> plot(V,I,'o',Vinp,Iinp);grid;%ploting the values
>> title('Voltage(V) vs Current(I) Validation plot');%giving the title for the figure 2
>> xlabel('V(Volt)');ylabel('I(mAmp)');%labeling x and y axis
>> legend('Experimental Data','Calculated by Interpolation','Location','best');%showing legends
>> VV =[-17.2 -17.1 -13.8 -13.5 -13.0 -12.5 -11 -9 -5.76 -6 -1 0.11 0.25 0.5 0.61];%Given data in the problem
>> VI=interp1(V,I,VV,"spline");
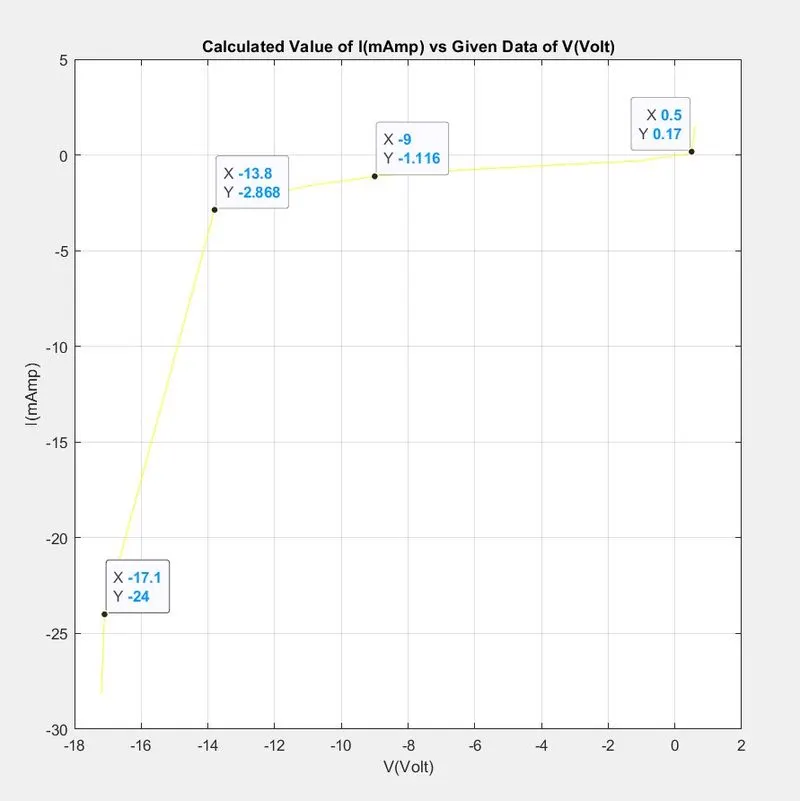
>> figure(3);
>> plot(VV,VI,'-y');grid;%ploting the values
>> title('Calculated Value of I(mAmp) vs Given Data of V(Volt)');%given the Title for the Figure 3
>> xlabel('V(Volt)');ylabel('I(mAmp)');%Labeling the x and y axis
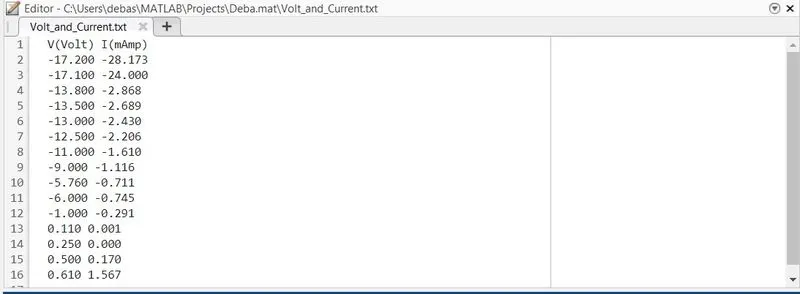
>> fid=fopen('Volt_and_Current.txt','w');%Opening the Output file
>> fprintf(fid,'V(Volt) I(mAmp)\n');% storing values of variable x in file
for i = 1:length(VV)
fprintf(fid,'%.3f %.3f\n',VV(i),VI(i));%storing value of variable x in file
end
>> fclose(fid);%closing output file
Results: Figure 1, Figure 2, Figure - 3 & The Saved txt File >>>>