Project - Data Handling and Interpolation
MATLAB SCRIPTS:
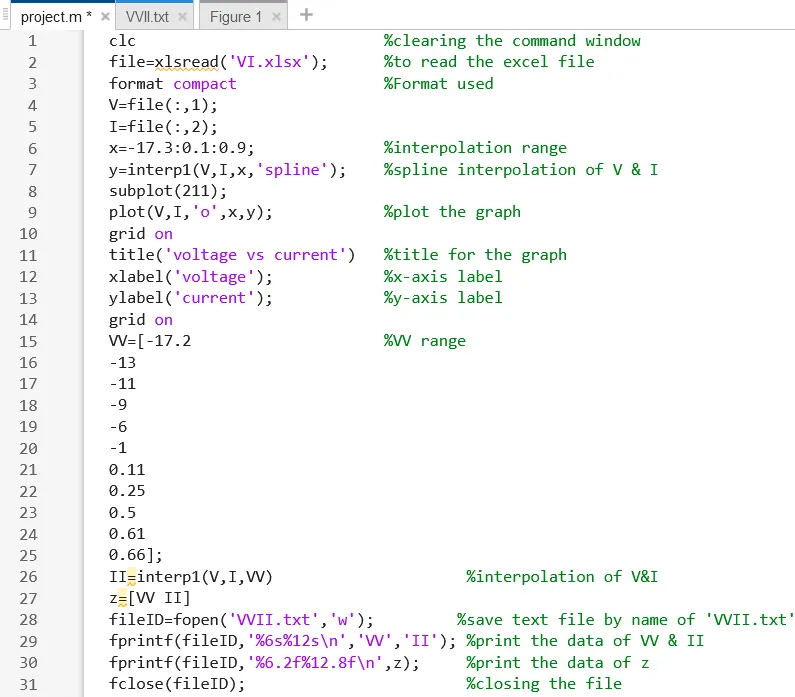
clc %clearing the command window
clear all %clearing the workspace window
file=xlsread('VI.xlsx'); %to read the excel file
format compact %Format used
V=file(:,1);
I=file(:,2);
x=-17.3:0.1:0.9; %interpolation range
y=interp1(V,I,x,'spline'); %spline interpolation of V & I
subplot(211);
plot(V,I,'o',x,y); %plot the graph
grid on
title('voltage vs current') %title for the graph
xlabel('voltage'); %x-axis label
ylabel('current'); %y-axis label
grid on
VV=[-17.2 %VV range
-13
-11
-9
-6
-1
0.11
0.25
0.5
0.61
0.66];
II=interp1(V,I,VV) %interpolation of V&I
z=[VV II]
fileID=fopen('VVII.txt','w'); %save text file by name of 'VVII.txt'
fprintf(fileID,'%6s%12s\n','VV','II'); %print the data of VV & II
fprintf(fileID,'%6.2f%12.8f\n',z); %print the data of z
fclose(fileID); %closing the file
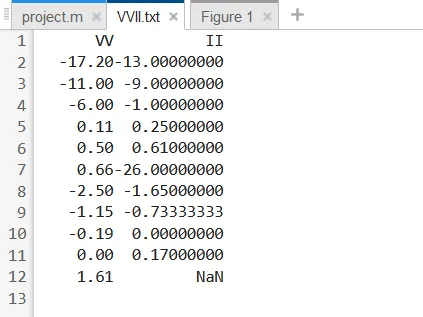
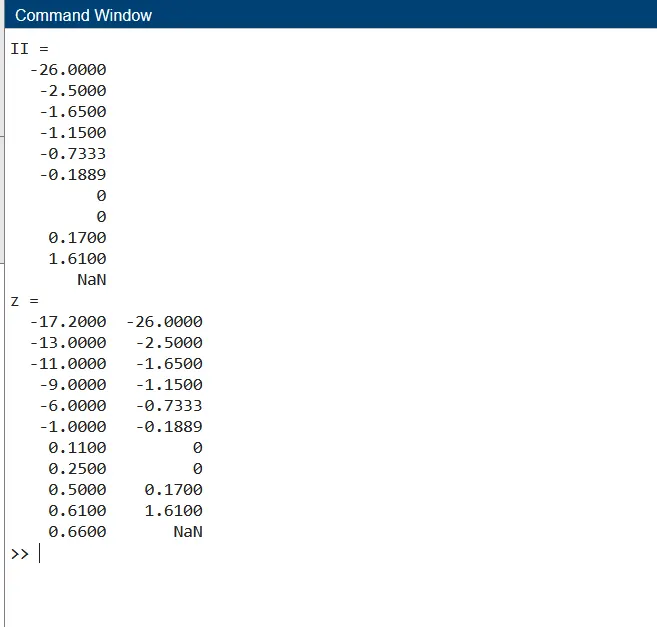
The current values for given voltages below and store them in a text file.
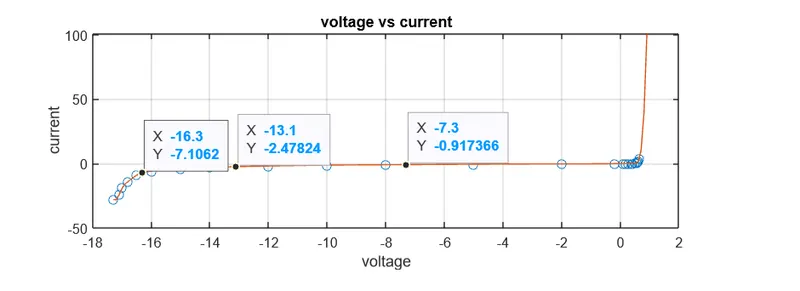
Plot which shows the interpolated data of the given range: