Project
.....
AIM: To study the system-level simulation of a Baja All-Terrain Vehicle (ATV).
KEYWORDS: CVT, Lookup Table, Dashboard, Baja ATV, Matlab, Simulink
OBJECTIVES:
- Simulate a Baja ATV model without a dashboard.
- Simulate a Baja ATV model with a dashboard.
- Simulate a Baja ATV model using a lookup table without a dashboard.
- Simulate a Baja ATV model using a lookup table with a dashboard.
KEYWORDS: CVT, lookup table, Dashboard, baja ATV
SOFTWARE: Matlab, Simulink
1. INTRODUCTION
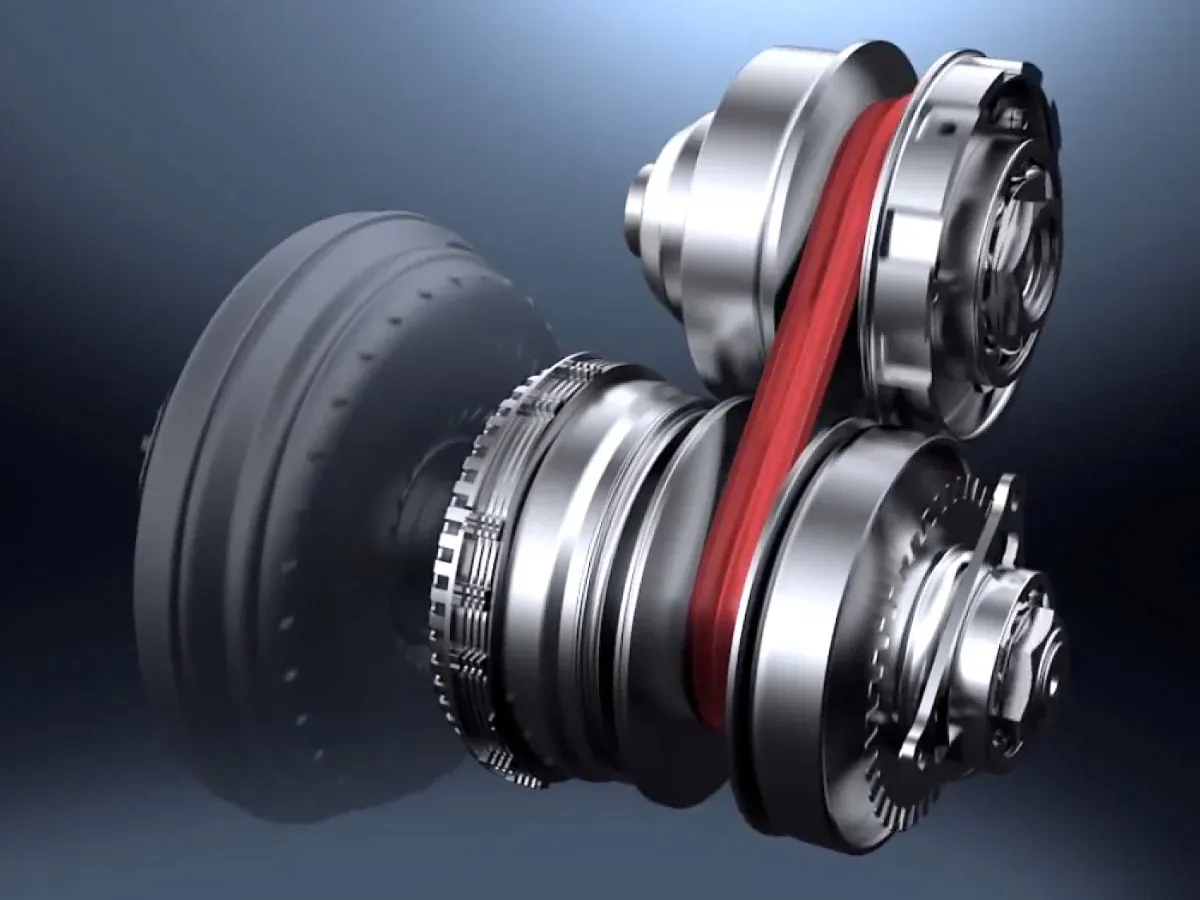
The transmission system in a vehicle is responsible for transferring power from the engine to the wheels. Common transmission types include manual, continuously variable (CVT), semi-automatic, and automatic. This project focuses on the CVT, which offers advantages in usable power, fuel economy, and smoothness compared to traditional automatic transmissions. CVTs achieve this by providing an infinite number of gear ratios within a specific range, allowing for optimized engine operation. This results in smooth shifts, improved fuel efficiency, and better acceleration by keeping the engine operating near its peak power band. CVTs are also generally lighter than traditional automatic transmissions.
2. SIMULATION MODELS
Four different simulation models were developed and analyzed using Matlab/Simulink:
2.1 Model 1: Basic Baja ATV Model (No Dashboard)
This model (Figure 1) represents the baseline configuration. It includes key components such as a signal builder (for input signals), a generic engine, motion sensors, a CVT subsystem, a vehicle body, tires, and a solver configuration block.
- CVT Subsystem (Figure 2): Contains the transmission block, input and output shaft inertias, and motion sensors.
- Vehicle Body Subsystem (Figure 3): Includes the vehicle body block, double drum brake, and tires.
The signal builder provides inputs for brake, throttle, and gear ratio. The brake input was set to 0 for the entire simulation. The throttle input was initially set to 0.3 for 20 seconds and then increased to 1 for the remainder of the simulation. The gear ratio was initially set to 2.3 for 5 seconds and then linearly decreased to 1.8, remaining constant thereafter (Figures 4-5). The vehicle mass was set to 250 kg, with two axles connecting four wheels. The initial engine speed was 2100 rpm, and the driven and driver pulley mechanical rotations were set to 0.8 and 0.7, respectively.
2.2 Model 2: Baja ATV Model with Dashboard
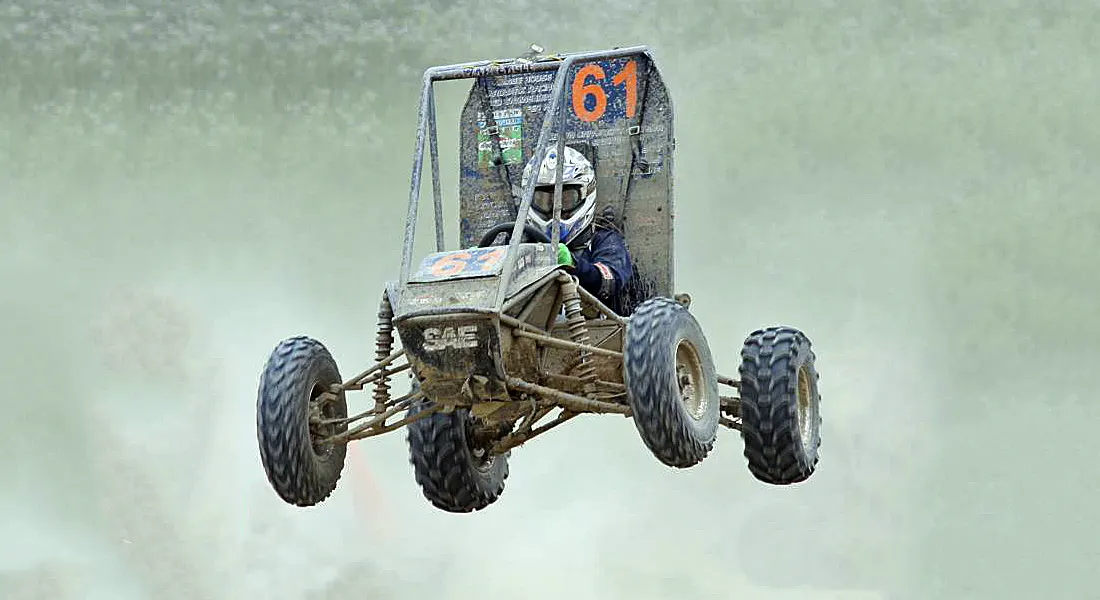
This model (Figure 6) incorporates a dashboard interface for controlling the throttle and brake inputs. This allows for interactive simulation and observation of the vehicle's response. The remaining components and subsystems are identical to Model 1 (Figures 2 and 3). The dashboard allows for real-time adjustments to brake (0-0.5) and throttle (0-1) inputs, enabling the study of their effects on velocity and engine speed. The gear ratio profile remains the same as in Model 1 (Figure 5).
2.3 Model 3: Baja ATV Model with Lookup Table (No Dashboard)
This model (Figure 7) utilizes a lookup table to define the gear ratio. This allows for a more flexible and potentially more realistic representation of the CVT's behavior. The model includes a step time block for brake and throttle inputs (which will vary based on runtime), a generic engine, motion sensors, a CVT subsystem with a lookup table, a vehicle body, tires, and a solver configuration block.
- CVT Subsystem with Lookup Table (Figure 8): Includes the lookup table for gear ratio, the transmission block, input and output shaft inertias, and motion sensors.
- Vehicle Body Subsystem (Figure 9): Includes the vehicle body block, double drum brake, and tires.
The lookup table maps input values (e.g., vehicle speed or engine speed) to corresponding gear ratios. Simulink uses interpolation, extrapolation, or rounding to determine output values for input values not explicitly defined in the table. The gear ratio varies from 2.3 to 1.8, and the resulting velocity is analyzed.
2.4 Model 4: Baja ATV Model with Lookup Table and Dashboard
This model (Figure 11) combines the features of Models 2 and 3, incorporating both a dashboard for interactive control and a lookup table for gear ratio definition. The dashboard provides constant blocks for brake and throttle inputs, while the lookup table governs the gear ratio. This setup enables the study of the combined effects of driver input and CVT characteristics on vehicle performance.
3. RESULTS AND DISCUSSION
The following figures illustrate the key results obtained from the simulations:
3.1 Model 1: Basic Baja ATV Model (No Dashboard)
- Velocity and Shaft Speed (Figure 12): Shows the increase in velocity with increasing throttle input. The torque reaches approximately 7 N-m at a gear ratio of 1.8.
- Shaft Speeds (Figure 13): Demonstrates the relationship between primary and secondary shaft speeds.
3.2 Model 2: Baja ATV Model with Dashboard
- Velocity (Figure 14): Illustrates the effect of varying throttle and brake inputs on vehicle velocity.
- Shaft Speeds (Figure 15): Shows the impact of throttle and brake inputs on primary and secondary shaft speeds.
3.3 Model 3: Baja ATV Model with Lookup Table (No Dashboard)
- Velocity and Shaft Speed (Figure 16): Shows the velocity profile resulting from the gear ratio defined in the lookup table.
- Shaft Speeds (Figure 17): Illustrates the primary and secondary shaft speeds.
3.4 Model 4: Baja ATV Model with Lookup Table and Dashboard
- Velocity (Figure 18): Shows the velocity response to changes in throttle and brake inputs, considering the lookup table-based gear ratio.
- Shaft Speeds (Figure 19): Illustrates the shaft speeds under combined dashboard control and lookup table influence.
Method:1
By using simulink model of CVT consists of Signal builder, generic engine, motion sensors, vehicle transmission, vehicle body,tyres and solver configuration blocks etc., as shown in figure-1. The CVT subsystem includes Transmission block, input and output shaft inertia and motion sensors as shown in figure-2. The vehicle body subsystem includes vehicle body block, double drum brake and tyres as shown in figure-3. The initial engine speed is given as 2100 rpm, mechanical rotation for driven pulley and driver pulley as 0.8 & 0.7 respectively. The mass of the vehicle as 250kg and 2 axles which connects 4 wheel accordingly.
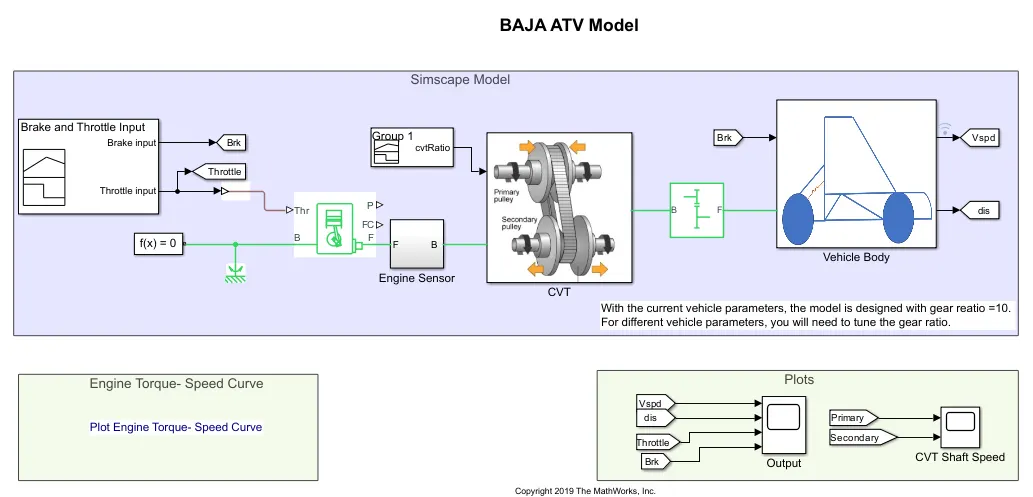
Figure-1
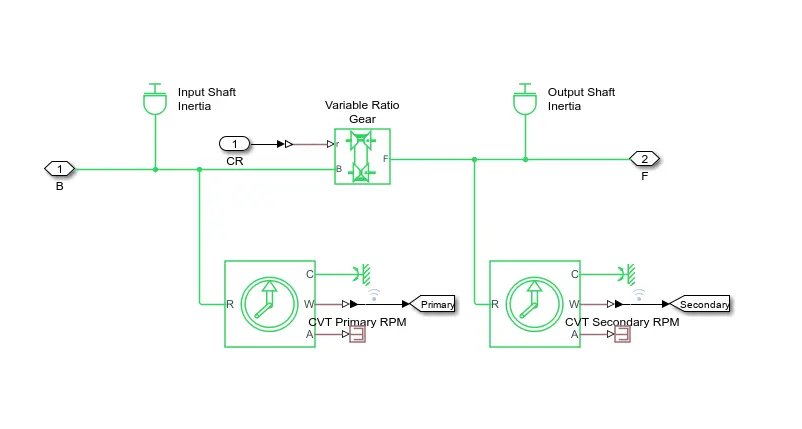
Figure-2
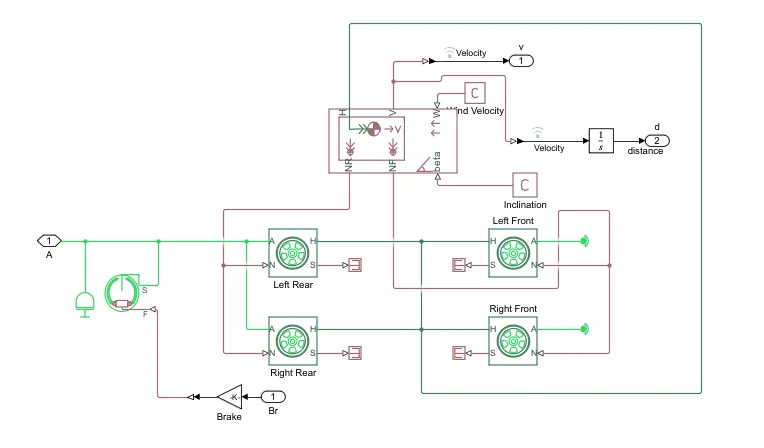
Figure-3
The signal builder is used as input for brake, throttle and gear ratio. Brake input is maintained as 0 for overall simulation. The throttle input is given as 0.3 for20 secs and increases to 1 for overall simulatuion. The throttle valve is mainly to control the flow or amount of fuel into the engine, if the throttle value increases the flow of fuel increases to the IC engine which inturn increases the power of the engine. The gear ratio is maintained as 2.3 for 5 secs and linearly decreases to 1.8 and maintained constant for overall simulation as shown in figure (4 - 5).
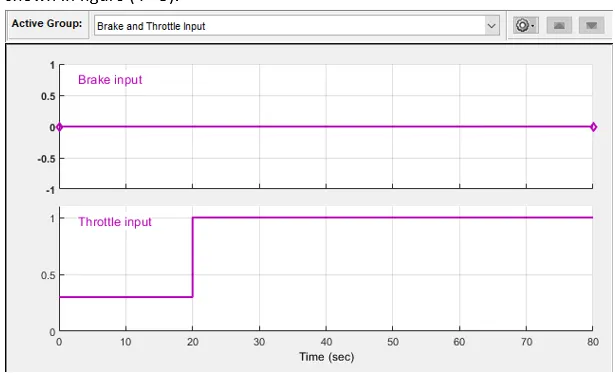
Figure-4
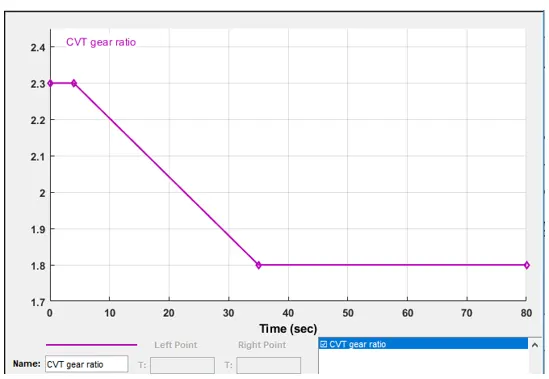
Figure-5
Method:2
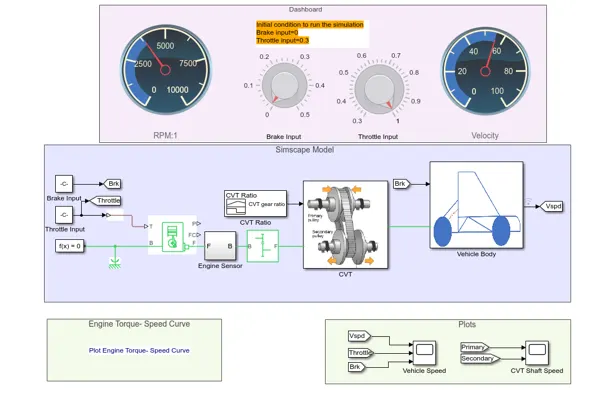
Figure-6
The above figure shows 'Baja ATV with dashboard' model which consists throttle meter and brake input in the dash board instead of giving input through signal builder. Rest of the blocks and subsystems are common in the above baja ATV model without dash board as shown in figure 2 & figure 3. The main concept of using dash board is study the result by varying the input of brake and throttle, which shows that the velocity and speed of the engine. The gear ratio is maintained as 2.3 for 5 secs and linearly decreases to 1.8 and maintained constant for overall simulation as shown in figure 5. As the brake input varies from 0 - 0.5, the velocity and speed decreases accordingly. By increasing the throttle, the velocity and speed of the engine & shaft increases.
Methed:3
By using simulink model of CVT consists of step time, generic engine, motion sensors, vehicle transmission, vehicle body,tyres and solver configuration blocks etc., as shown in figure-7. The CVT subsystem includes look up table, Transmission block, input and output shaft inertia and motion sensors as shown in figure-8. The vehicle body subsystem includes vehicle body block, double drum brake and tyres as shown in figure-9. The initial engine speed is given as 2100 rpm, mechanical rotation for driven pulley and driver pulley as 0.8 & 0.7 respectively. The mass of the vehicle as 250kg and 2 axles which connects 4 wheel accordingly.
A lookup table is an array of data that maps input values to output values, thereby approximating a mathematical function. Given a set of input values, a lookup operation retrieves the corresponding output values from the table. If the lookup table does not explicitly define the input values, simulink can estimate an output value using interpolation, extrapolation, or rounding, where:
- An interpolation is a process for estimating values that lie between known data points.
- An extrapolation is a process for estimating values that lie beyond the range of known data points.
- A rounding is a process for approximating a value by altering its digits according to a known rule.
Figure - 7
Figure - 8
Figure - 9
The brake input and throttle input is given by step time, which depends on the run time and varies accordingly. By using Lookup table for gear ratio which takes as input to the CVT and works according to the input gear ratio and obtained the output. This method is very effective which can avoid the unusual torque at the certain speed and very easy to achieve greater velocity & engine speed. It works as closed loop when the input is given by lookup table. The simulink get the input value from lookup table and obtain the result according to the input values of gear ratio. The gear ratio varies from 2.3 to 1.8 as taken as input and output interms of velocity. The maximum velocity reached as 57 kmph approximately.
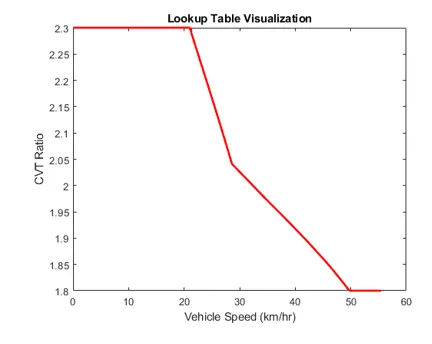
Figure-10
Method:4
Figure - 11
The above figure shows 'Baja ATV with dashboard' model using lookup table which consists throttle meter and brake input in the dash board and indicated as constant block. Rest of the blocks and subsystems are common in the above baja ATV model without dash board as shown in figure 8 & figure 9. The main concept of using dash board is study the result by varying the input of brake and throttle, which shows that the variation of velocity and speed of the engine. The gear ratio is given by lookup table, simulink get the input value from the lookup table and obtain the result according to the lookup table. As the brake input varies from 0 - 0.5, the velocity and speed decreases accordingly which inturn the gear ratio also decreasing. By increasing the throttle, the velocity and speed of the engine & shaft increases. The transmission as primary pulley and secondary pulley, in which the radius of primary pulley increses by compacting and the radius of secondary pulley decreases. As the gear ratio varies, the torque also varies. Gear ratio is directly proportional to the torque, which increases by increasing the gear ratio. At the max torque, the speed and velocity is decreases.
OUTPUT:
Study 1:- Variation of velocity & Shaft speed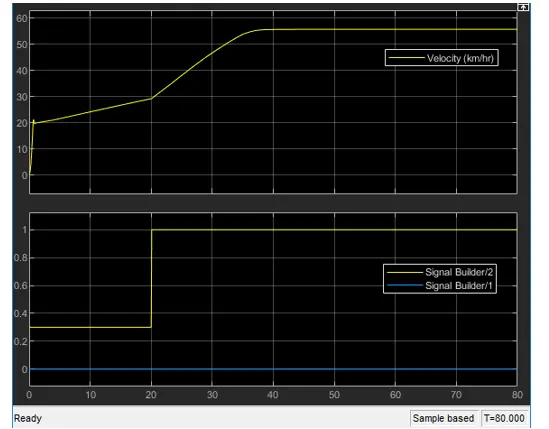
Figure - 12
In the above figure, the brake is maintained as constant and increase in throttle which shows increase in velocity. The flow of fuel is increses when the throttle increases from 0.3 to 1, thus the power in the engine increases. The torque reaches approximately 7N-m at 1.8 gear ratio, which defines that gear ratio is directly proportional to the torque. By this gear ratio, the speed & velocity can achieve maximum.
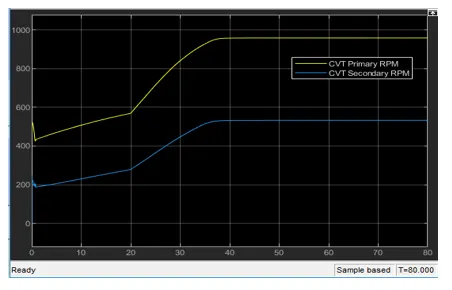
Figure - 13
In the above figure, the primary shaft reaches high speed and secondary shaft as low rotational speed because the radius of the primary shaft as more than the secondary shaft, the speed is directly proportional to the radius of the shaft. As the radius increases the speed of the shaft also increases.
Study 2:- Variation of velocity & Shaft speed
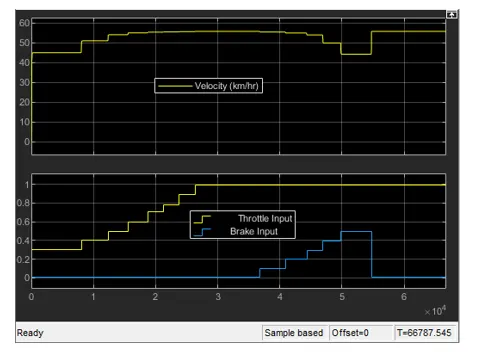
Figure - 14
In the above figure, the velocity of the vehicle is maintained as constant for constant throttle value as 0.3 and varying by increasing the value of throttle which increases the velocity of vehicle. By increasing the brake input, the velocity of the vehicle decreasing accordingly which shown in figure14.
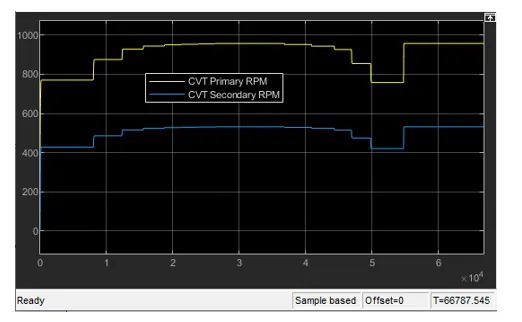
Figure - 15
In the above figure, the primary shaft speed increases by increasing throttle and decreasing by increasing brake input value, which defines that the throttle can flow more amount of fuel which increases the power of the engine and similar to the secondary shaft. The radius of the primary shaft as more than the secondary shaft, the speed is directly proportional to the radius of the shaft. As the radius increases the speed of the shaft also increases.
Study 3:- Variation of velocity & Shaft speed
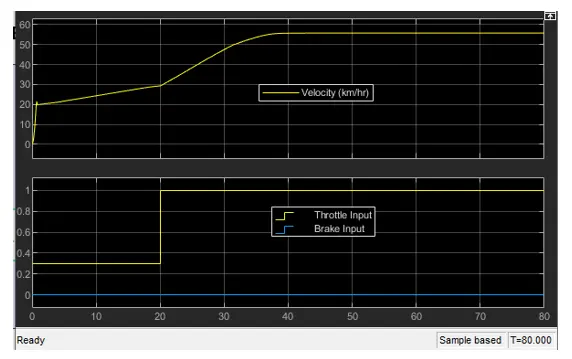
Figure - 16
In the above figure, the brake is maintained as constant and increase in throttle which shows increase in velocity. The flow of fuel is increses when the throttle increases from 0.3 to 1, thus the power in the engine increases. The torque reaches approximately 7N-m at 1.8 gear ratio, which defines that gear ratio is directly proportional to the torque. By this gear ratio, the speed & velocity can achieve maximum. The gear ratio is assigned in lookup table and given as input to the simulink which reads every input value and obtain the result according to the input.
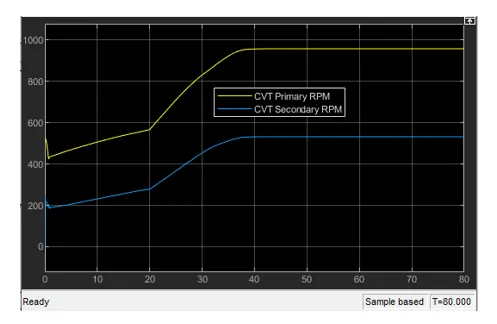
Figure - 17
In the above figure, the primary shaft speed increases by increasing throttle and decreasing by increasing brake input value, which defines that the throttle can flow more amount of fuel which increases the power of the engine and similar to the secondary shaft. The radius of the primary shaft as more than the secondary shaft, the speed is directly proportional to the radius of the shaft. As the radius increases the speed of the shaft also increases.
Study 4:- Variation of velocity & Shaft speed
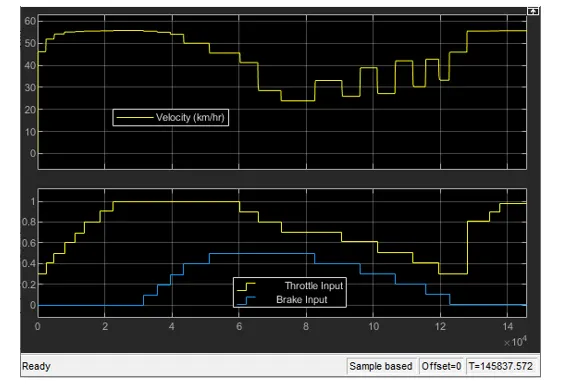
Figure - 18
In the above figure, the velocity of the vehicle is maintained as constant for constant throttle value as 0.3 and varying by increasing the value of throttle which increases the velocity of vehicle. By increasing the brake input, the velocity of the vehicle decreasing accordingly which shown in figure18. By using lookup table, it works as closed loop by recording the velocity value and we can get at any particular value of gear ratio which is beyond the range or any random value within the range by using extrapolation and interpolation by lookup table.
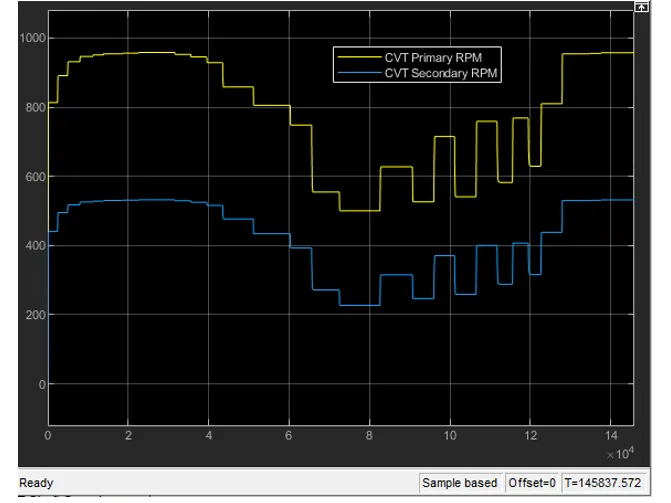
Figure - 19
In the above figure, the primary shaft speed increases by increasing throttle and decreasing by increasing brake input value, which defines that the throttle can flow more amount of fuel which increases the power of the engine and similar to the secondary shaft. The radius of the primary shaft as more than the secondary shaft, the speed is directly proportional to the radius of the shaft. As the radius increases the speed of the shaft also increases. The throttle value and brake input value can be varying in dashboard, so we can get any particular value for input.
CONCLUSION:
1. As the throttle increases, the velocity also increases which inturn the power in the engine also increases.
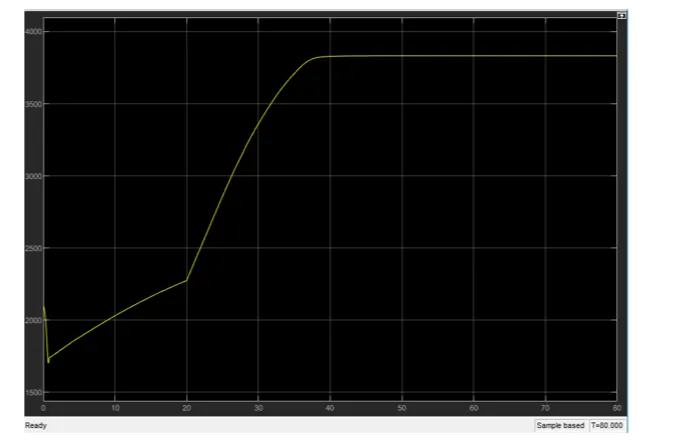
Figure - 20
In the above figure, at the begining the speed reducing because of gear ratio and torque output. When the gear ratio increases, the torque increases.
2. As the brake input increases, the velocity decreases and engine power also decreases. At a certain brake input value the engine may shut down and there is no power output. The engine power is inversly proportional to the brake input.
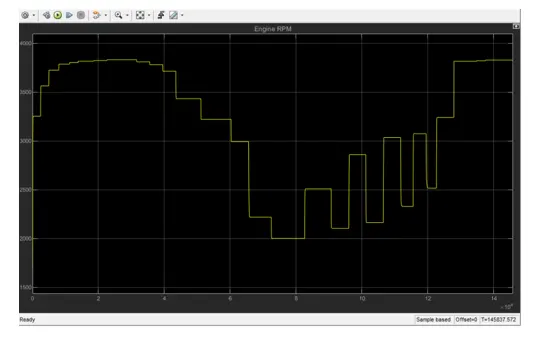
Figure - 21
3. As the gear ratio increases, torque increases which inturn the velocity decreases.
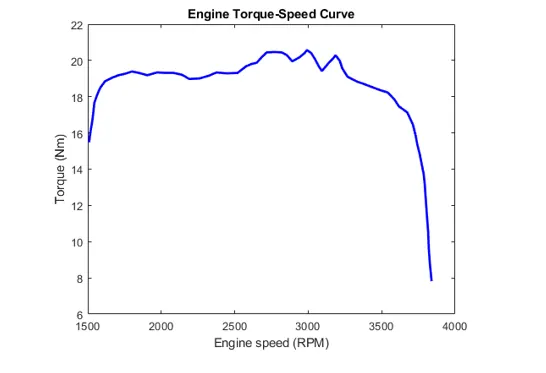
Figure - 22
In the above figure, the torque is increasing by increase in engine speed. At a particular point the the torque is decreasing when the gear ratio increases inorder to achieve maximum velocity.
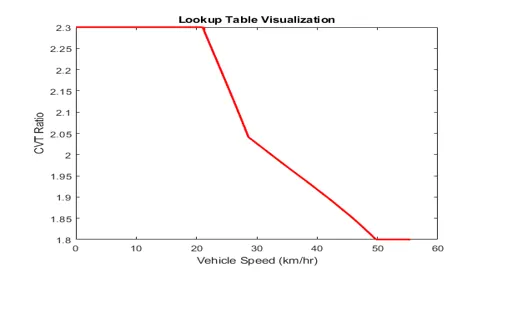
Figure - 23
In the above figure, the velocity is varying wrt the gear ratio. For the high gear ratio, the torque is more which decrease the velocity. By changing to high gear, the gear ratio become less paralelly the torque also less which can get high velocity.
4. With help of lookup table, we can vary any input value and also get the output value by using interpolation and extrapolation method which the simulink can solve.
The simulations conducted in this project led to the following conclusions:
- Throttle and Velocity: Increasing throttle input leads to increased velocity and engine power (Figure 20).
- Brake and Velocity: Increasing brake input results in decreased velocity and engine power (Figure 21).
- Gear Ratio and Torque/Velocity: Increasing the gear ratio increases torque and decreases velocity (Figure 22). Conversely, decreasing the gear ratio increases velocity and decreases torque (Figure 23).
- Lookup Table: The lookup table provides a flexible way to define the gear ratio and allows for interpolation and extrapolation to determine values for any given input.
FUTURE WORK
- Implement a more detailed engine model.
- Incorporate a more sophisticated tire model.
- Include aerodynamic drag and rolling resistance.
- Validate the simulation results with experimental data.
- Optimize the CVT control strategy for improved performance and fuel efficiency.