Project 5
Aim of the Project-
For a 10 cell series, calculate the voltage, current and SOC. Also simulate the aging and thermal effects at different charge and discharge rates. Comment on the battery pack’s capacity
Theory-
The cell is the smallest unit of a battery, it has four main components: anode, cathode, electrolyte and separator.
More than one cell forms the battery, it can be used in powering electrical appliances. When there are multiple cells in a given circuit, they are either wired in parallel or series. We focused on series combination of cells.
Cells Connected In Series
There is only a single path between the terminals of the cell in a series combination of cells. The cells are said to be connected in series if the positive terminal of the first cell is connected to the negative terminal of the second cell and the negative terminal of the second cell is connected to the positive terminal of the third cell. The same current flows through each cell.
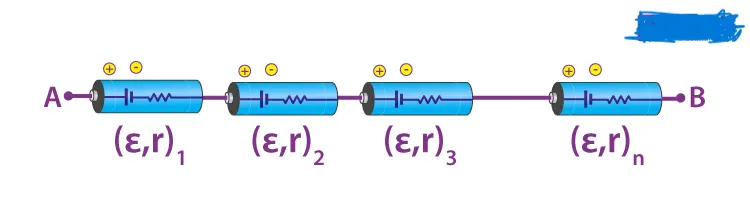
Let us consider that ‘n’ identical cells are connected in series with the same polarity. The EMF of individual cells is E1, E2, E3 —– En. Similarly, the internal resistance of each cell is r1, r2, r3 ——–rn.
The equivalent EMF is the terminal voltage across the cell when the cell is not in use.
The equivalent EMF of the cell is given by
Eeq = E1 + E2 +E3 ——-En = nE
Important terms
Voltage - It is the difference in the electric potential between two points. It is the work done in moving a charge from one pole to another through a wire. measure in volt.
Current - It is rate of flow of electron per unit time. measured in Ampere.
SOC - S o C = State-of-charge The state of charge of a battery describes the difference between a fully charged battery and the same battery in use. It is associated with the remaining quantity of electricity available in the cell. measured in %.
Battery capacity - "Battery capacity" is a measure (typically in Amp-hr) of the charge stored by the battery, and is determined by the mass of active material contained in the battery. The battery capacity represents the maximum amount of energy that can be extracted from the battery under certain specified conditions.
C-rate - It is the charge or discharge current in Amps divided by the cell capacity in Ampere-hours. A 1C rate means that the discharge current will discharge the entire battery in 1 hour. If we plot charge / discharge rates in Amps versus battery capacity in Ampere-hours we get straight lines for a given C-rate.
C-rate = 1/time
Now a days lithium-ion batteries are mostly used in electric vehicles we must know their charge and discharge rates to operate this battery in an efficient manner and without damage when this battery is in operation this temperature of it must be kept at the limit so we simulate the thermal effect of this cell, by knowing the how much temp rise take place we can provide efficient cooling to the battery so that the life cycle of the battery increases we will see a model on this issue below and explanation as follows.
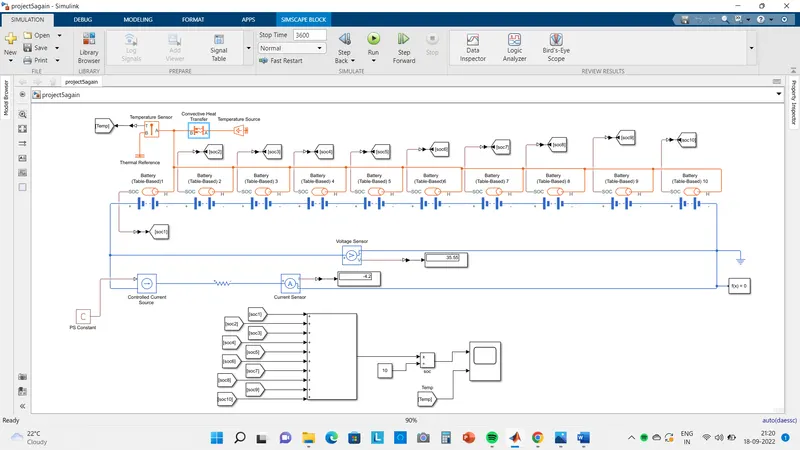
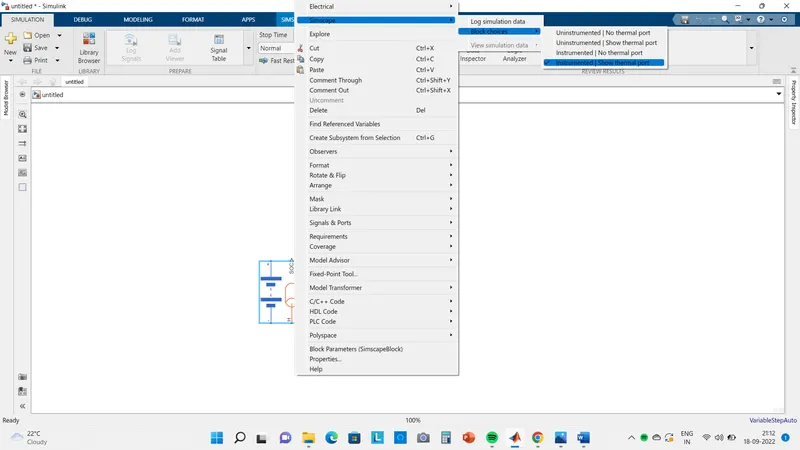
For this simscape model we used the table based battery. we show the thermal port.
The battery of one major commercially available electric vehicle is examined. A series of tests including the Electrochemical Impedance Spectroscopy test, dynamic driving schedule test, and others are conducted under controlled temperatures. The temperature influence on the performance and characteristics of the battery is discussed and analyzed. Based on the experimental results.
Table based battery-
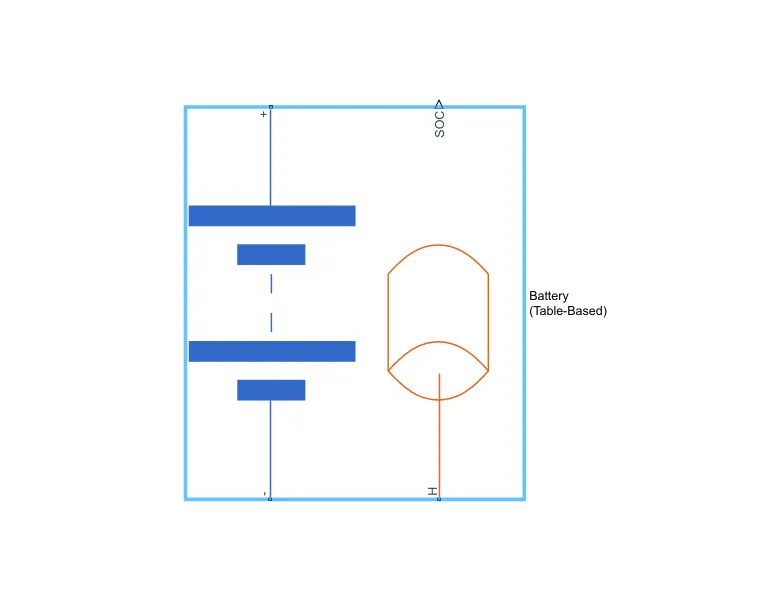
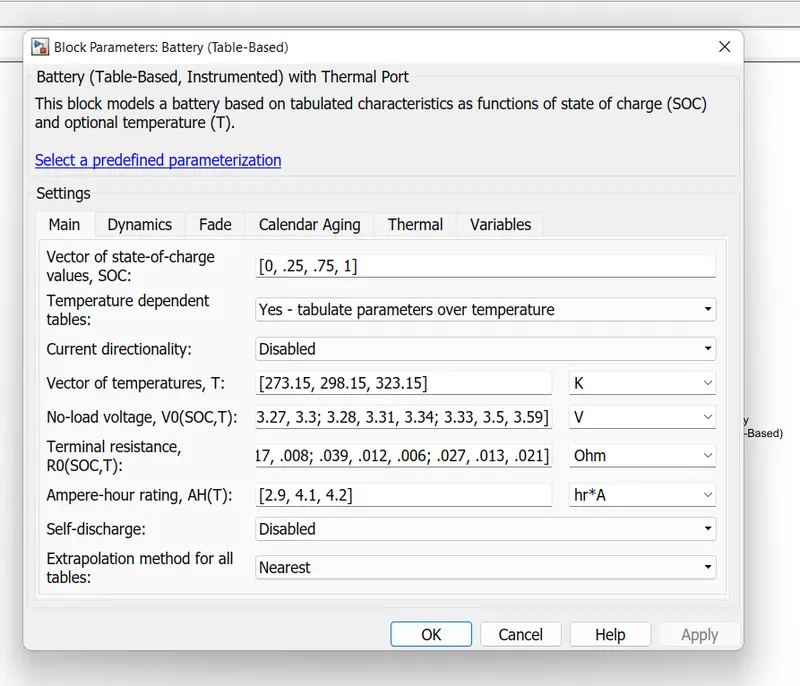
Maximum cells rating is 4.2Ah & No load voltage is 3.5 V. So the cells voltage is additive in series configuration so output voltage may getting is 35V.
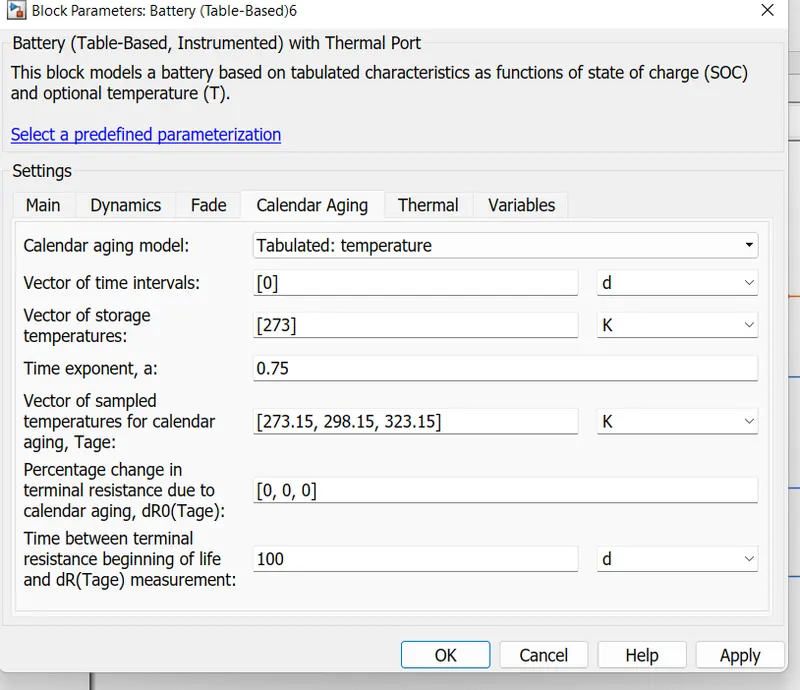
Aging on
Resistor-
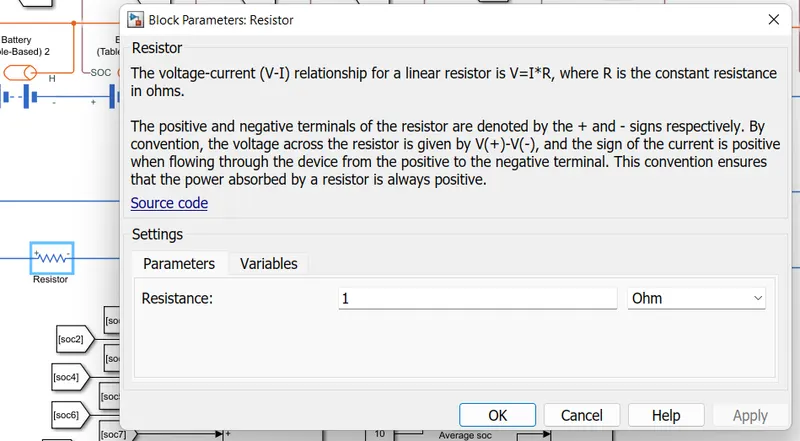
We uses resistor for discharging purpose.
Heat convection-
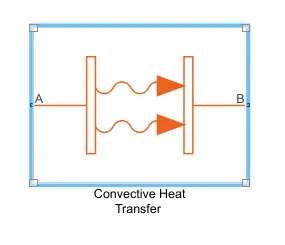
This block models heat transfer in a thermal network by convection due to fluid motion. The rate of heat transfer is proportional to the temperature difference, heat transfer coefficient, and surface area in contact with the fluid.
Temperature sensor-
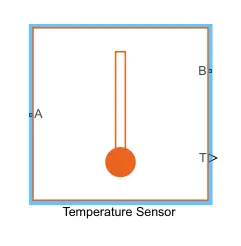
This block measures temperature in a thermal network. There is no heat flow through the sensor. The physical signal port T reports the temperature difference across the sensor. The measurement is positive when the temperature at port A is greater than the temperature at port B.
Temprature source-
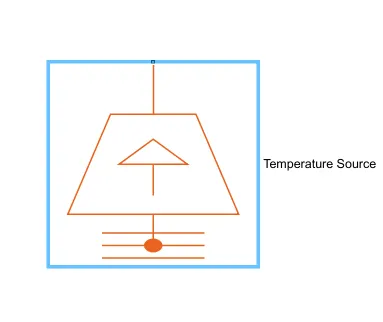
This block represents an ideal energy source in a thermal network that can maintain a constant absolute temperature at the port regardless of the heat flow rate.
Temprature reference-
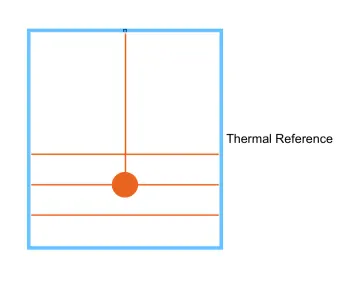
This block represents a reference point in a thermal network where the temperature is equal to absolute zero.
Other blocks used
Solver configuration, divide, Goto, From, display, electrical reference, PS constant, Scope.
Whole Simulink Model-
Exaplaination of Model-
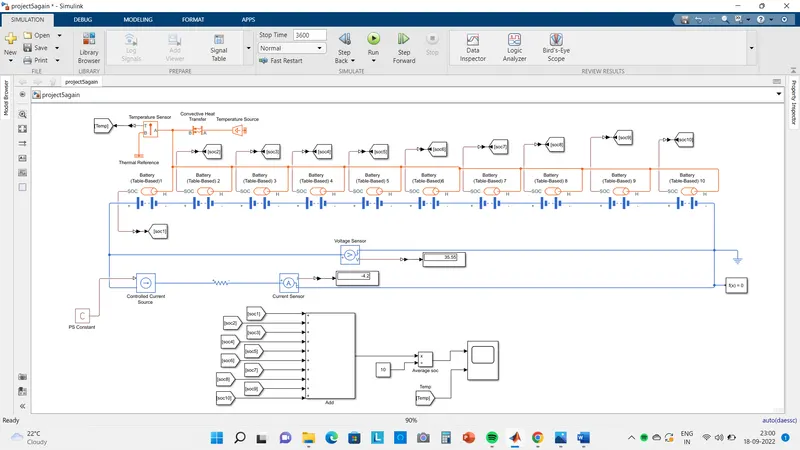
In the model given above we connect the 10 cells in series i.e. end to end connection. These Battery is controlled by controlled current source. The charging & discharging of cells is defined by the controlled current source who takes input from PS constant.
1. If the value of PS constant is positive means there is discharging of battery pack through resistor, the current direction from battery pack to load resistor.
2. If the value of PS constant is negative means there is charging of battery pack, the current direction from load resistor to battery pack.
We connect the all H terminal of thermal port of each cell to combine point & Connect to temprature sensor Where convective heat transfer & thermal source also connect, Thermal reference is for circuit completion.
The SOC terminal of all cells to PS converter where the simunlink data is converted into measurable one & to Goto block.
We can measure the current of all cells by connecting current sensor in series with battery pack & resistor.
The Voltage sensor configure in parallel manner so as to measure the voltage of all cells, see in the model.
Add the all SOC by connecting from block who have the data of all SOC, after that we take the average value by dividing it by 10 because SOC goes upto 1 After that it can not increase further.
We can check the voltage & curent by display block & SOC & Temperature graph in scope waveforms.
Observation & Results-
We can obeserve the graph & current & voltage for different C-rate under charging & discharging.
Charging- Current direction from controlled current to Battery pack.
1C Rate-
The maximum cell capacity is 4.2 Ah so the charging current is -4.2 A & battery pack charge in 1 hr(3600 sec).
Make the SOC to 0. For charging current direction is reverse to discharging therefore we take negative value of current for charging. So constant put in PS constant block is -4.2 A.
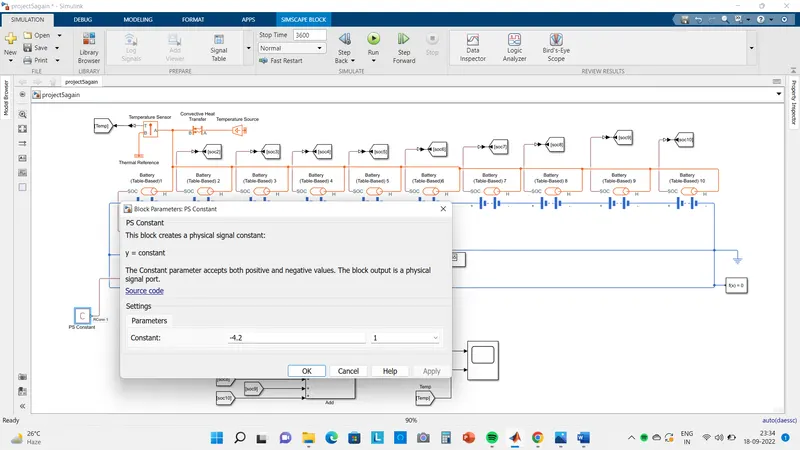
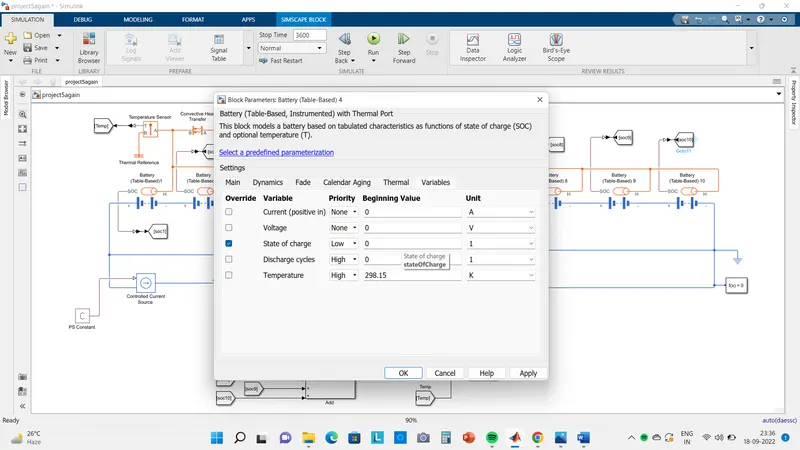
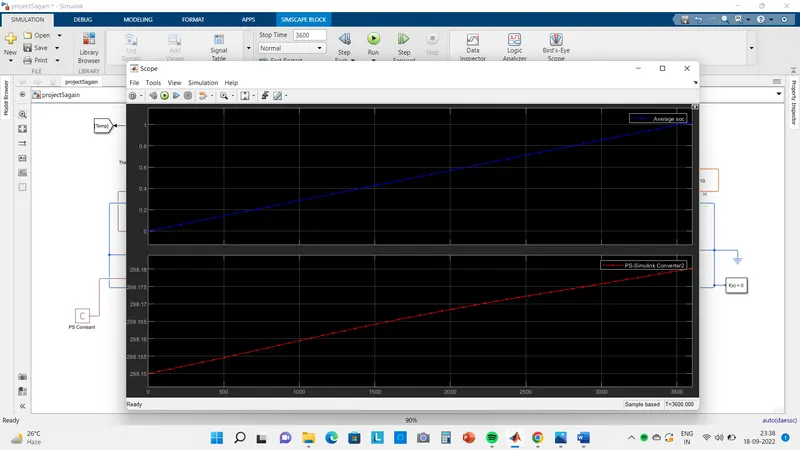
From the graph see that when we charge the battery the SOC will increase from 0 to 1 in 3600 sec with 1C rate the temperature also increases due to i^2*R losses.
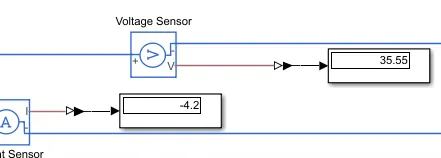
the total voltage of battery pack is 35.55 V & current is 4.2 A.
2C Rate-
The maximum cell capacity is 4.2 Ah so the charging current is -8.4 A & battery pack charge in 1/2 hr(1800 sec).
Make the SOC to 0. For charging current direction is reverse to discharging therefore we take negative value of current for charging. So constant put in PS constant block is -8.4 A.
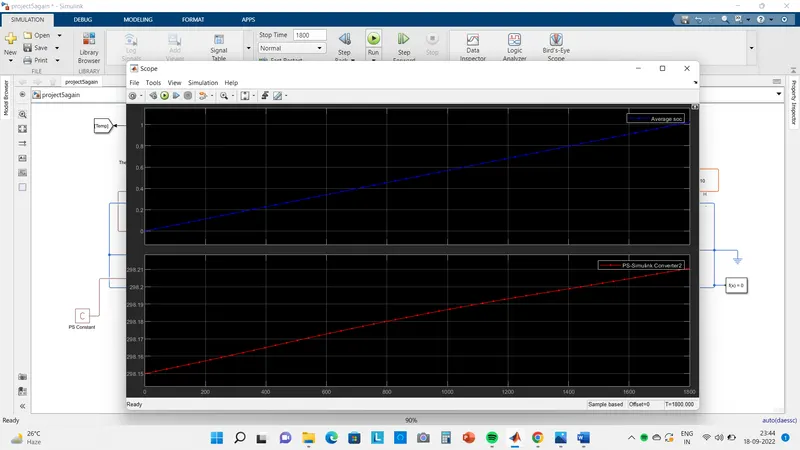
From the graph see that when we charge the battery the SOC will increase from 0 to 1 in 1800 sec with 2C rate the temperature also increases due to i^2*R losses.
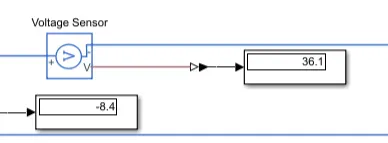
the total voltage of battery pack is 36.1 V & current is 8.4 A. little bit change in voltage.
DisCharging- Current direction from Battery pack to load resistor.
1C Rate-
The maximum cell capacity is 4.2 Ah so the discharging current is 4.2 A & battery pack charge in 1 hr(3600 sec).
Make the SOC to 0. For discharging direction of current we take positive value. So constant put in PS constant block is 4.2 A.
cells SOC is set to be 1.
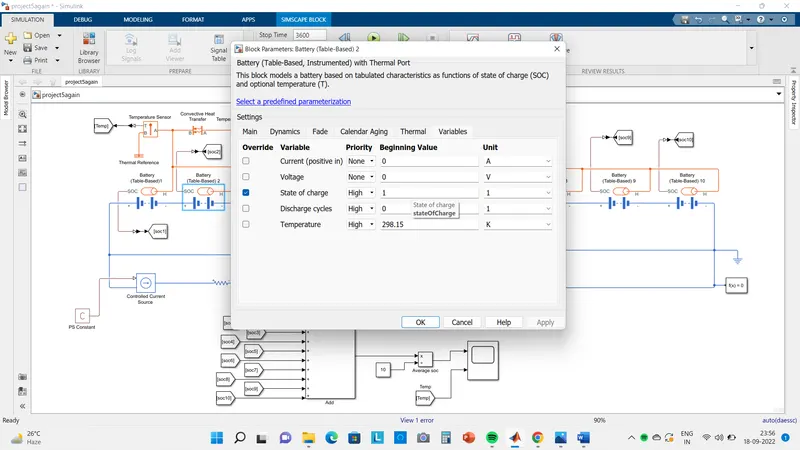
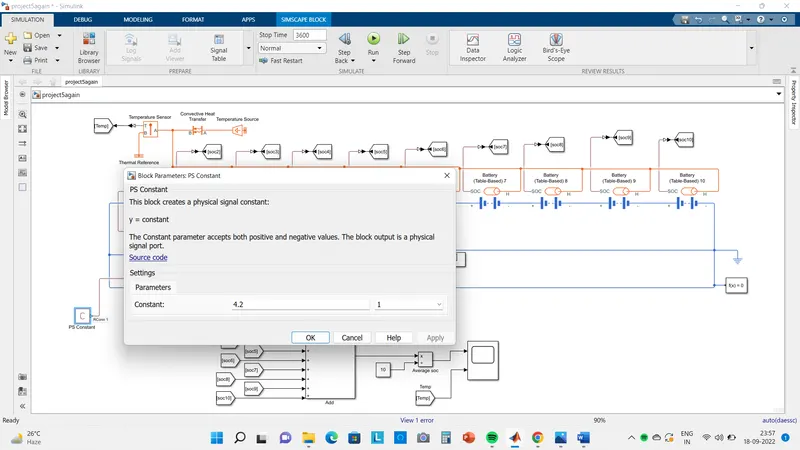
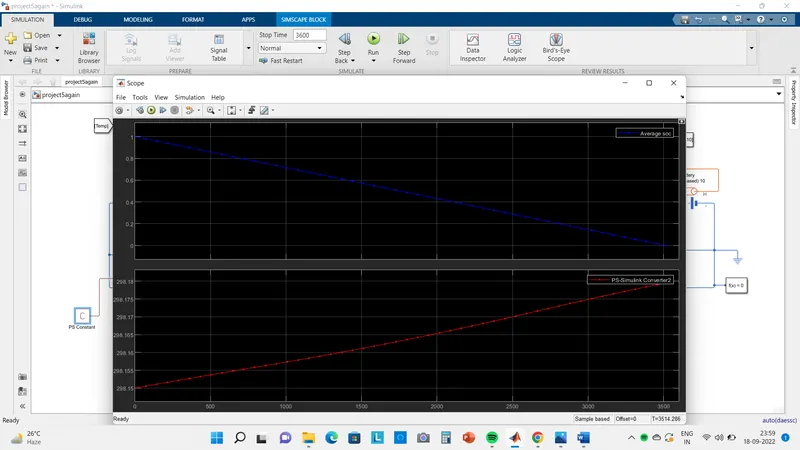
From the graph see that when we discharge the battery the SOC will decrease from 1 to 0 in 3600 sec with 1C rate the temperature also increases due to i^2*R losses.
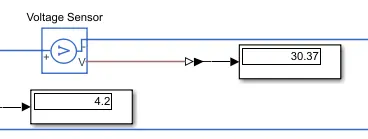
the total voltage of battery pack is 30.37 V & current is 4.2 A.
2C Rate-
The maximum cell capacity is 4.2 Ah so the discharging current is 8.4 A & battery pack charge in 1/2 hr(1800 sec).
Make the SOC to 0. For discharging direction of current we take positive value. So constant put in PS constant block is 8.4 A.
cells SOC is set to be 1.
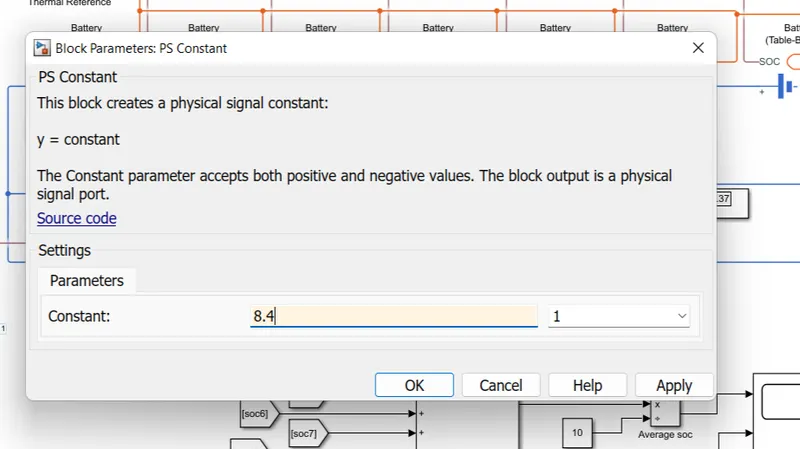
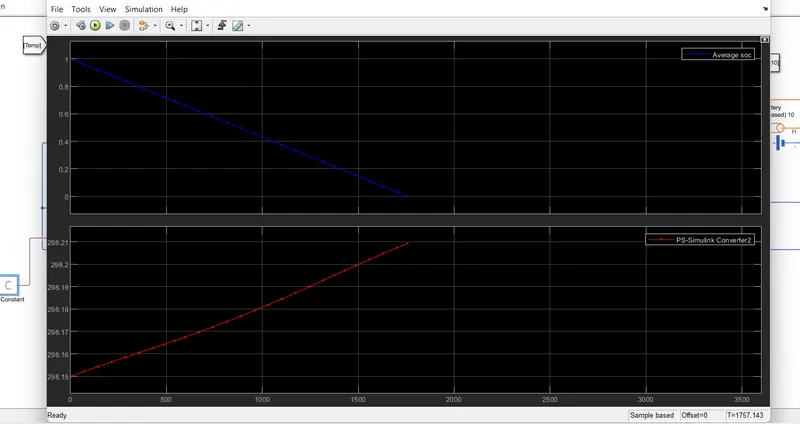
From the graph see that when we discharge the battery the SOC will decrease from 1 to 0 in 1800 sec with 2C rate the temperature also increases due to i^2*R losses.
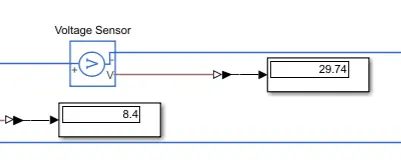
the total voltage of battery pack is 29.74 V & current is 8.4 A. little bit change in voltage.
Conclusion-
From the above results we concluded that the time of charging & discharging may changes by changing the C-rate.
To charge or discharge of battery pack we have to reverse the direction of current. In the charging & discharging the temperature of battery pack increases which reduces the life cycle of battery pack. So we select the proper cooling system to maintain the battery pack temperature within range.
The Voltage of 10 cells series string is additive is verified by the simulation. little bit variation in voltage because of battery chemistry, electrolyte, electrode resistance, load resistance.
The SOC get reduces while Discharging & Increases while charging we verify from the simulation result,
Battery pack capacity may not be changes when cells are connected in series. In the simulation model single cell capacity is 4.2 Ah it can not change when 10 cells connected in series because current through the circuit is same. If the C-rate is increases the life cycle of battery pack reduces. Increasing C-rating results in fast charging & discharging so heat generation is also greater. So C-rate affects the life of cell.