Project 2 Thermal modeling of battery pack
Objective:
For a 10 cell series lithium ion bttery model,simulate the thermal effects and compare life cycle performance at various temperatures, charge & discharge rates using MATLAB.
Therory:
Now a days lithium ion battery are mostly used in electric vehicles we must know its charge and discharge rates to operate this batterys in efficient manner and with out damage when this batterys in operation this tempersture of it must be kept in limit we simulate the thermal effect of this cell, by knowing the how much temp rise take place we can provide efficient cooling to the batterys so the life cycle of the battery increases we will see a model on this issue below and explaination as follows.
Cells connected in series and one of the cell is faulty so what will be thermal effect. This example shows how to simulate a battery pack consisting of multiple series-connected cells in an efficient manner. It also shows how a fault can be introdeuced into one of the cells to see the impact on battery performance and cell temperatures. For efficiency, identical series-connected cells are not just simply modeled by connecting cell models in series. Instea a single cell is used, and the terminal voltage scaled up the number of cells. The fault is represented by charging the parameters for the Cell 10 Fault subsystem, reducing both capacity and open-circuit voltage, and increasing the resistance values.
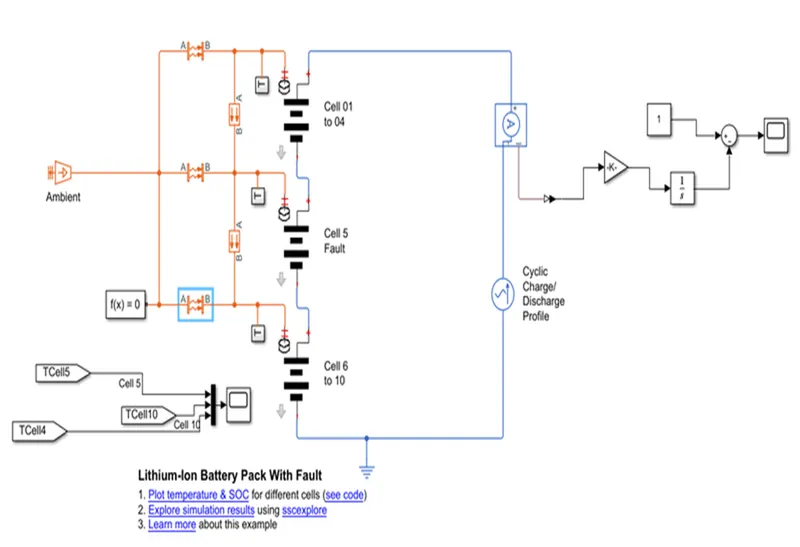
Circuit Construction and working :
In this ckt we use li-ion cell 1 to 10, temperature sensors, ambent temp block, state of charge estimation scope, charge discharge profile given to ckt, from & goto block MATLAB simulink
Cell 01 to 04 Subsystem:
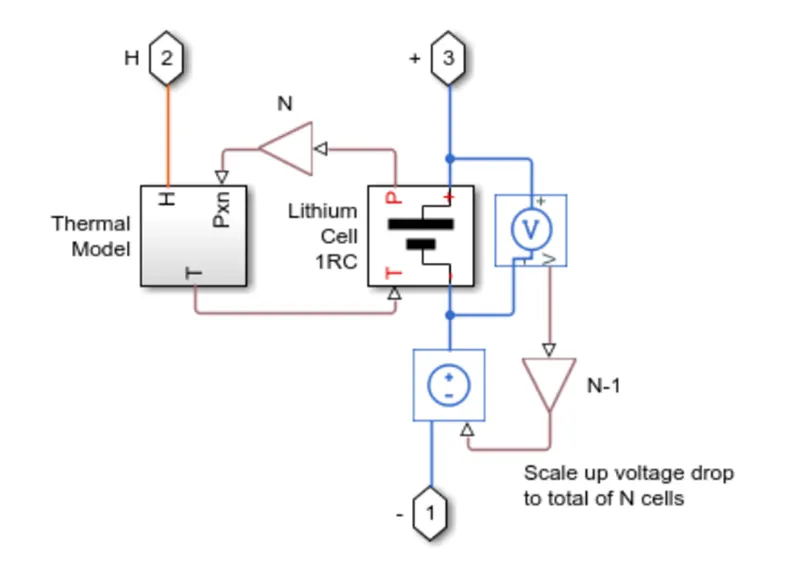
Cell subsystem basically consist of a Thmal Model and Lithium Cell 1RC block which calculate the temperature and thermal effect for cells and overall calculate for the battery pack.
Lithium Cell 1RC Subsystem:
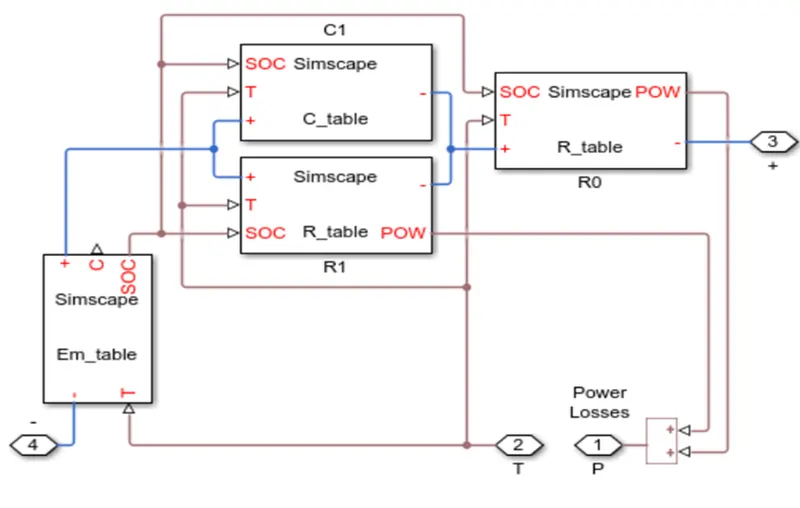
This block basically consists of capacitance value © table which depends on an external physical signal inputs SOC and T. It is assumed that the capacitance value is slowly varying with time, and hence the equation i = C*dv/dt holds.
Resistance value (R) table which depends on an external physical signal inputs SOC and T.
Voltage value (EM) which implements the cell’s main branch voltage source, and determines values for capacity (C) and state of charge (SOC). The defining equations depend on cell temperature, T.
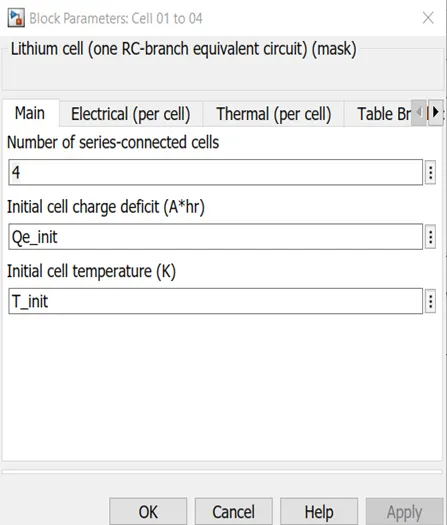
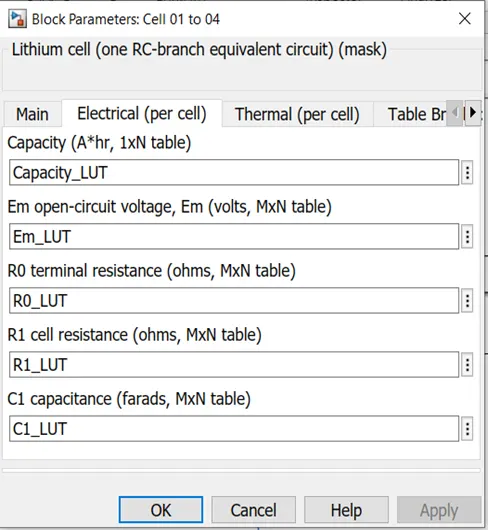
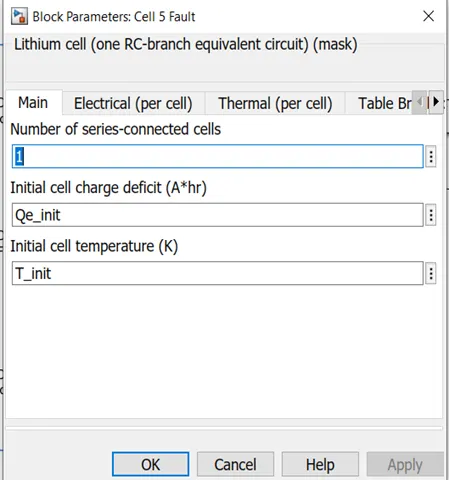
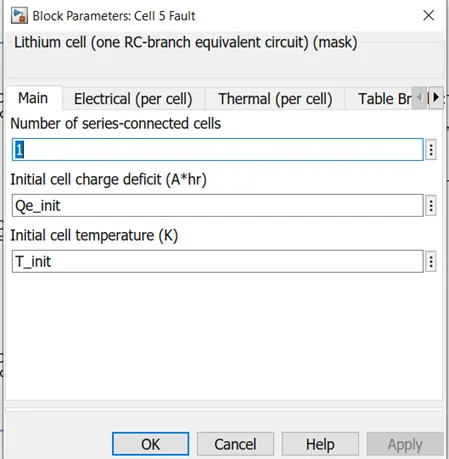
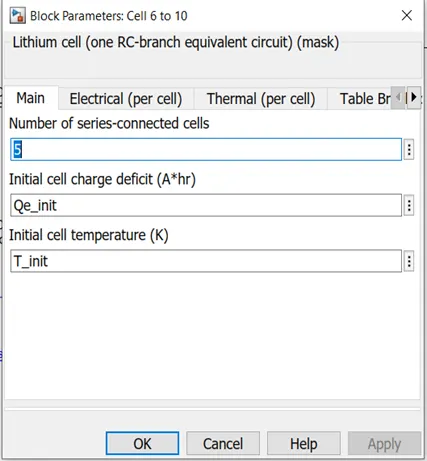
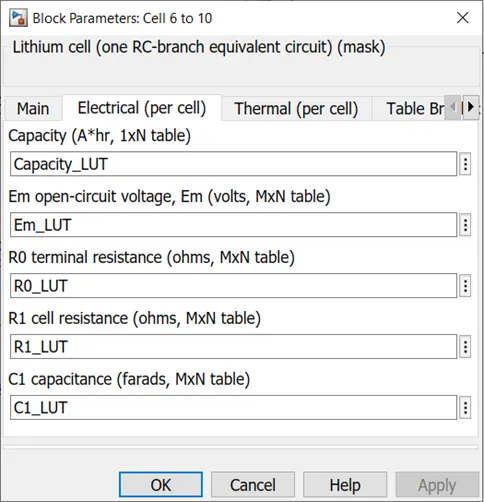
Output of one cell is connected with the SOC estimation whereas other output is connected with AC current source for cyclic charge/discharge profile.
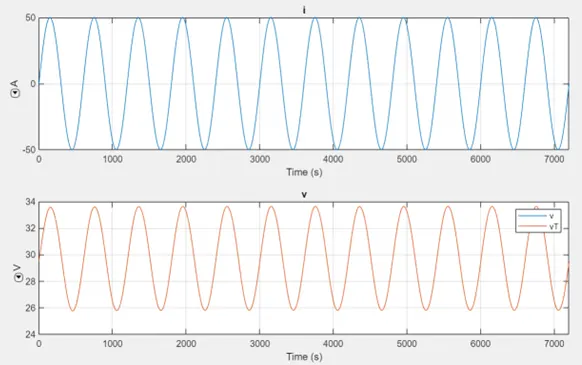
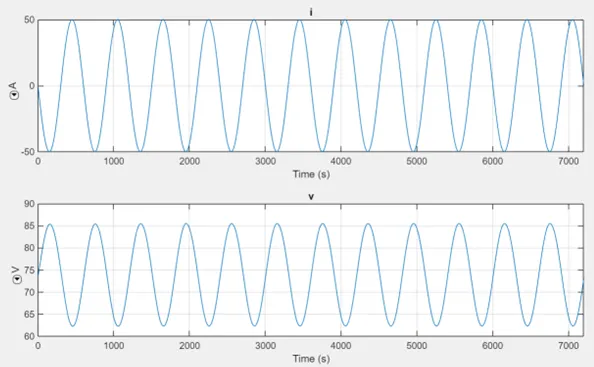
The peak amplitudes set to 50 A for cyclic charge and discharge. A basic parameter of AC current source is as
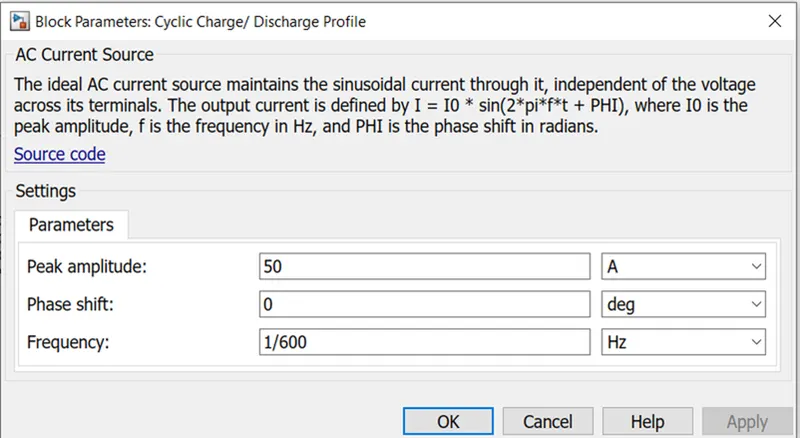
Other block which are used in lithium-ion battery pack are as:
Program code:
% Plotting script for example battery model ssc_lithium_battery_with_fault.
% This example shows how to model a series of lithium-ion cells where one
% of the cells develops a fault. The data used for each cell is the same
% as for the ssc_lithium_cell_1RC example model, and is based on T. Huria,
% M. Ceraolo, J. Gazzarri, R. Jackey. "High Fidelity Electrical Model with
% Thermal Dependence for Characterization and Simulation of High Power
% Lithium Battery Cells," IEEE International Electric Vehicle Conference,
% March 2012.
% Copyright 2014 The MathWorks, Inc.
try
figure(h1_ssc_lithium_battery_with_fault)
catch
h1_ssc_lithium_battery_with_fault=figure('Name', 'ssc_lithium_battery_with_fault');
end
if ~exist('simlog_ssc_lithium_battery_with_fault','var')
sim('ssc_lithium_battery_with_fault')
end
temp_data = simlog_ssc_lithium_battery_with_fault;
temp_time = temp_data.Cell_01_to_09.Thermal_Model.Battery_Thermal_Mass.T.series.time;
% Extract cell temperature data
temp_T1 = temp_data.Cell_01_to_09.Thermal_Model.Battery_Thermal_Mass.T.series.values;
temp_T2 = temp_data.Cell_10_Fault.Thermal_Model.Battery_Thermal_Mass.T.series.values;
temp_T3 = temp_data.Cell_11_to_20.Thermal_Model.Battery_Thermal_Mass.T.series.values;
% Extract SOC data
temp_SOC1 = temp_data.Cell_01_to_09.Lithium_Cell_1RC.Em_table.SOC.series.values;
temp_SOC2 = temp_data.Cell_10_Fault.Lithium_Cell_1RC.Em_table.SOC.series.values;
temp_SOC3 = temp_data.Cell_11_to_20.Lithium_Cell_1RC.Em_table.SOC.series.values;
ah(1) = subplot(2,1,1);
temp_lh = plot(temp_time/60,[temp_T1 temp_T2 temp_T3],'LineWidth',1);
set(temp_lh(3),'LineStyle','--');
title('Battery Cell Temperature')
ylabel('Temperature (K)')
legend({'Cell 1-9','Cell 10 (Fault)','Cell 11-20'},'Location','SouthEast')
ah(2) = subplot(2,1,2);
temp_lh = plot(temp_time/60,[temp_SOC1 temp_SOC2 temp_SOC3],'LineWidth',1);
set(temp_lh(3),'LineStyle','--');
title('Battery Cell State of Charge')
xlabel('Time (minutes)')
ylabel('State of Charge (0-1)')
legend({'Cell 1-9','Cell 10 (Fault)','Cell 11-20'},'Location','SouthEast')
linkaxes(ah,'x');
% Remove temporary variables
clear temp_data temp_T1 temp_T2 temp_T3 temp_SOC1 temp_SOC2 temp_SOC3 temp_lh ah
Temperature Source:
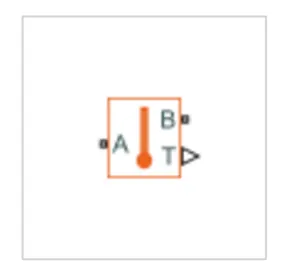
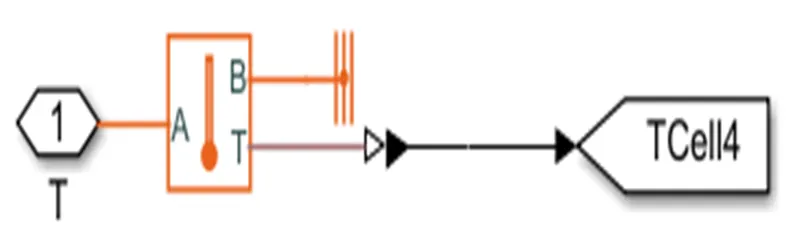
The Temperature Sensor block represents an ideal temperature sensor, that is, a device that determines the temperature differential measured between two points without drawing any heat.
Connections A and B are thermal conserving ports that connect to the two points where temperature is being monitored. Port T is a physical signal port that outputs the temperature differential value.
The block positive direction is from port A to port B. The measured temperature is determined as T = TA - TB.
This block represents an ideal energy source in a thermal network that can maintain a constant absolute temperature at the port regardless of the heat flow rate.
This block represents an ideal energy source in a thermal network that can maintain a constant absolute temperature at the port regardless of the heat flow rate.
This block is used for ambient temperature which we can set and check results.
Convective Heat Transfer:
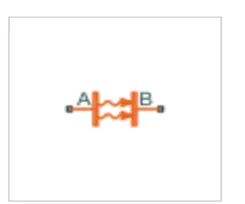
This block models heat transfer in a thermal network by convection due to fluid motion. The rate of heat transfer is proportional to the temperature difference, heat transfer coefficient, and surface area in contact with the fluid.
This used for 1-4 cells and 6-10 cell
From and goto blocks:
The Goto block passes its inputs to its corresponding from blocks. This input can be a real-or complex-valued signal or vector of any data type. From and Goto blocks allow you to pass a signal from one block to another without actually connecting them.
The from block accepts a signal from a corresponding Goto block, then passes it as output. The data type is the same as that of the input from the Goto block. From and Goto blocks allow you to pass a signal from one block to another without actually connecting them.
State of charge estimation:
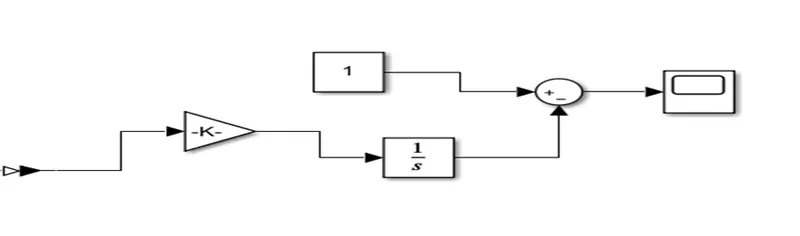
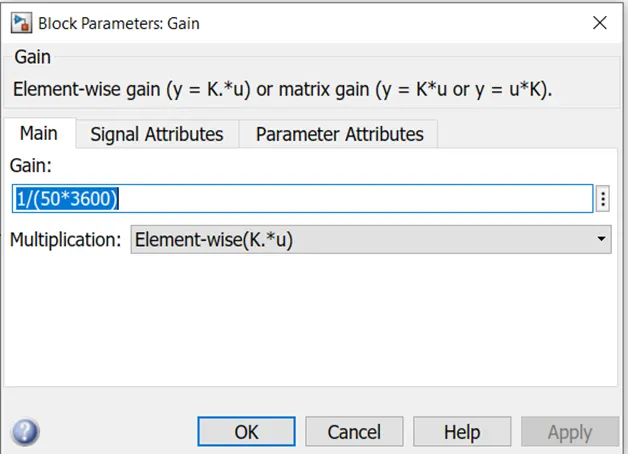
The coulomb counting method measures the discharging current of a battery and integrates the discharging current over time in order to estimate SOC.
This subsystem takes current as inout and gives the battery SOC % as output. A current sensor block is used and connedted for soc estimation
This ckt estimates the battery SOC % using coulomb counting method. It takes current as the input and gives SOC % as output. Initial SOC of the battery is assumed to be 100% (1)
Example shows how to simulate a battery pack consisting of multiple series- connected cells in an efficient manner. It also shows how a fault can be introduced into one of the cells to see the impact on battery performance and cell temperatures.
Explore simulation results:
Model Tree Structure-
- ssc_lithium_battery_with_fault
- Ambient
- Cell 01 to 09
. Controlled voltage source
. Lithium Cell 1RC
. N
. N-1
. Thermal Model
. Voltage Sensor
Fig
(Power Sum)
- Cell 10 Fault
. Controlled voltage source
. Lithium Cell 1RC
. N
. N-1
. Thermal Model
. Voltage Sensor
Fig
- Cell 11 to 20
. Controlled voltage source
. Lithium Cell 1RC
. N
. N-1
. Thermal Model
. Voltage Sensor
Fig
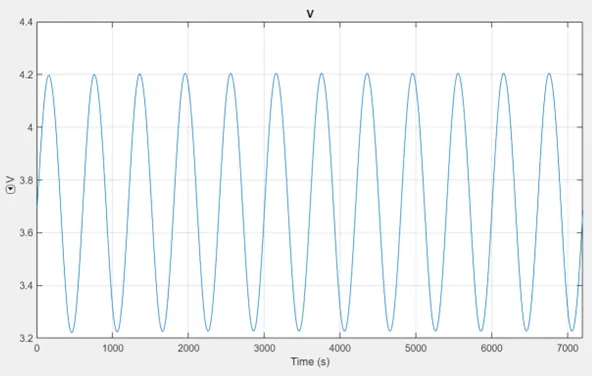
- Conduction Cell 09 – 10
. A
. B
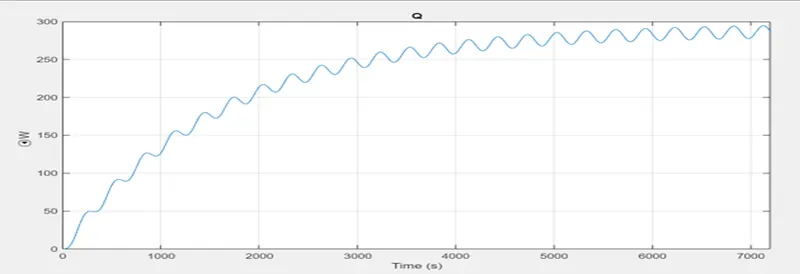
. Q
. T
Fig
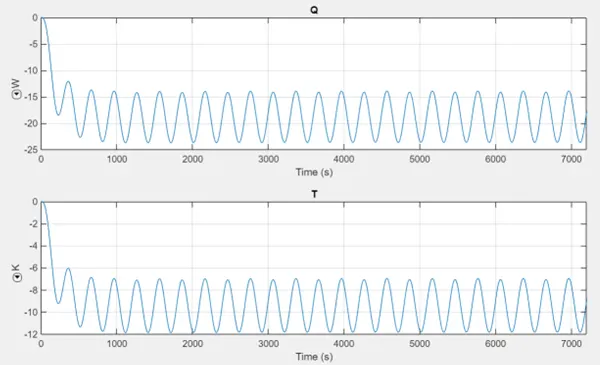
- Conduction Cell 10 – 11
. A
. B
. Q
. T
Fig
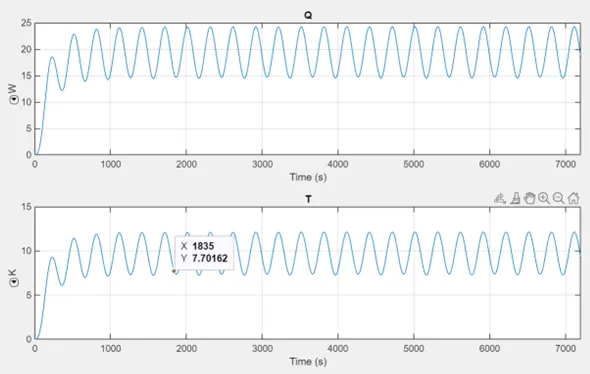
- Convection Ambient – cell 01 – 09
. A
. B
. Q
. T
Fig
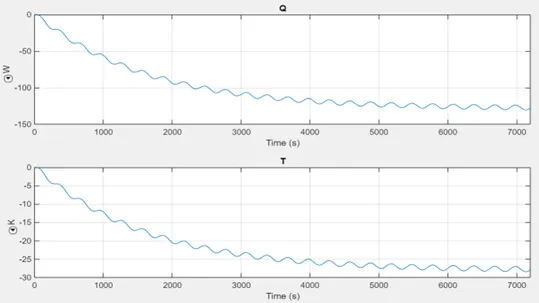
- Convection Ambient – Cell 10
. A
. B
. Q
. T
Fig
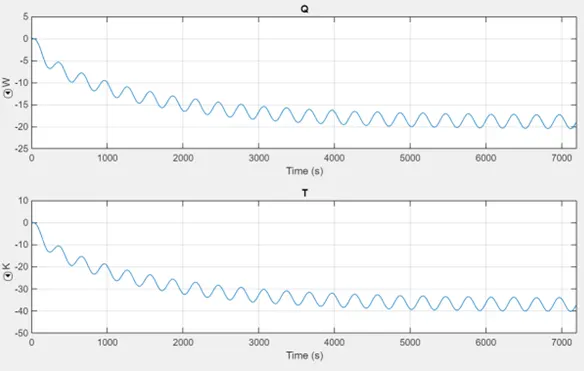
- Convection Ambient – Cell 11-20
. A
. B
. Q
. T
Fig
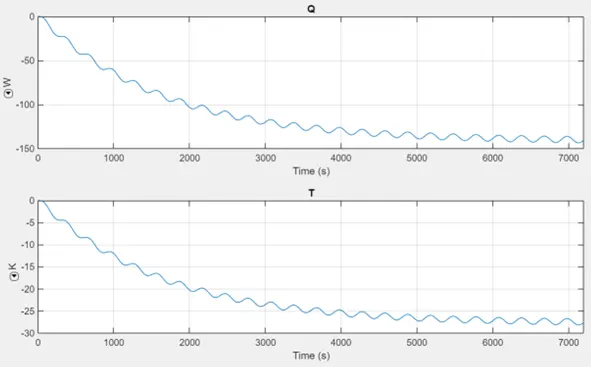
- Cyclic charge// Discharge Profile
. I
. n
. p
. v
Fig
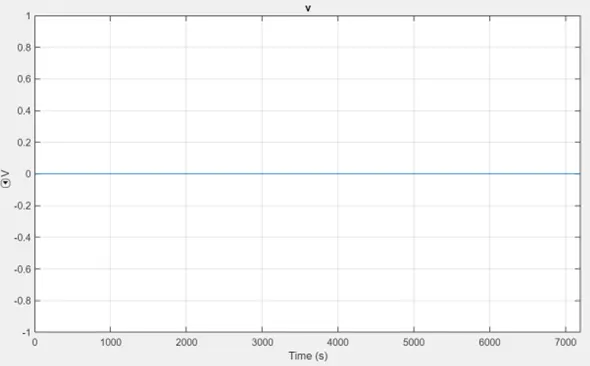
- ERef
. v
Fig
- Subsystem
. Temperature Sensor
. Thermal Reference
Fig
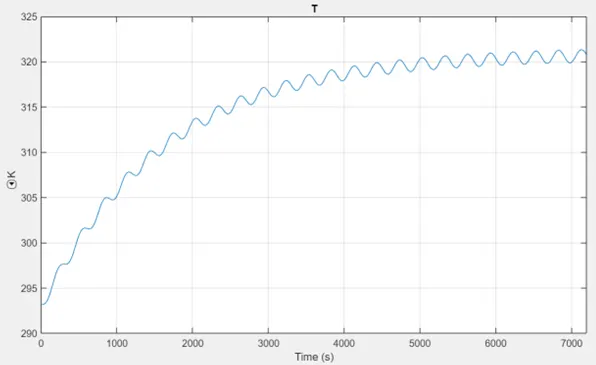
- Subsystem 1
. Temperature Sensor
. Thermal Reference
Fig
Results:
- Results at 300k ie 26.85°C
- Results at 310 k ie 36.85°C
- Results at 324k ie 50.85°C
Result Explanation:
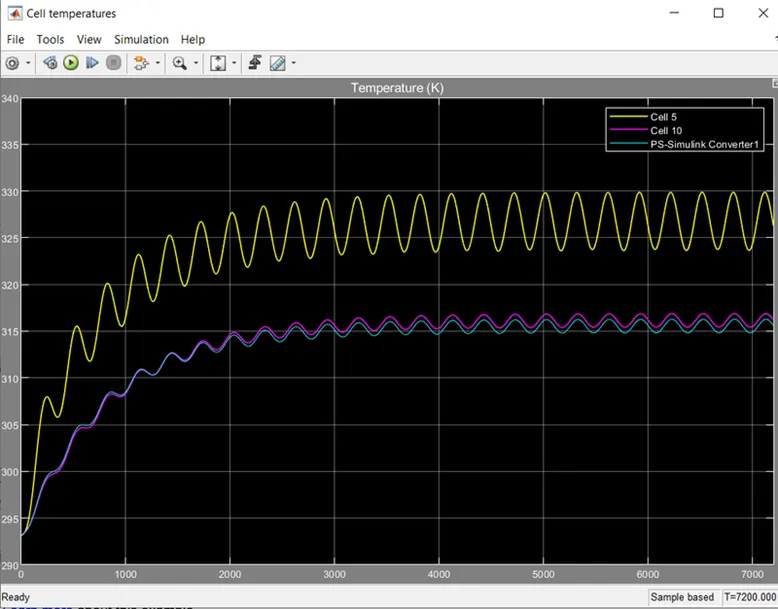
For a 10 Cell series lithium ion battery model we simulate the thermal effects and compare life cycle performance at various temperatures, charge & discharge rates using MATLAB. Results are as follows
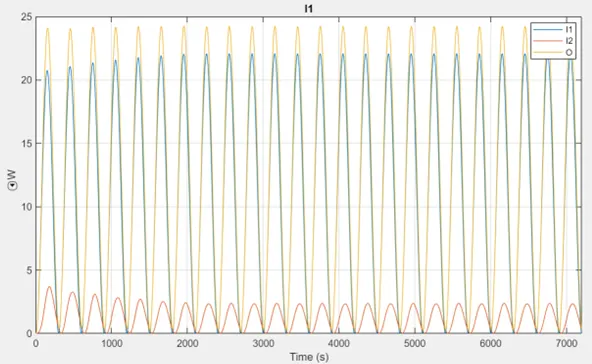
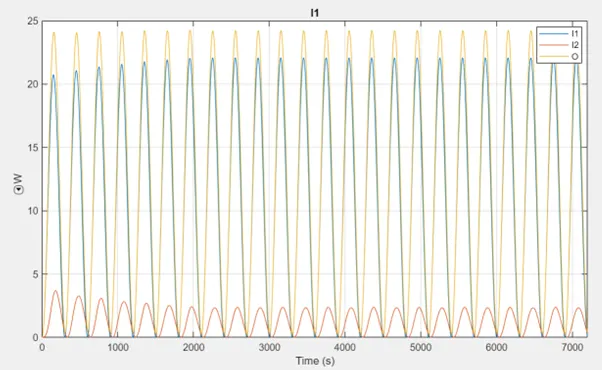
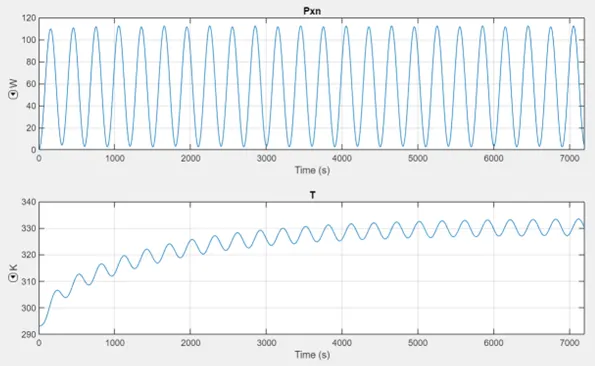
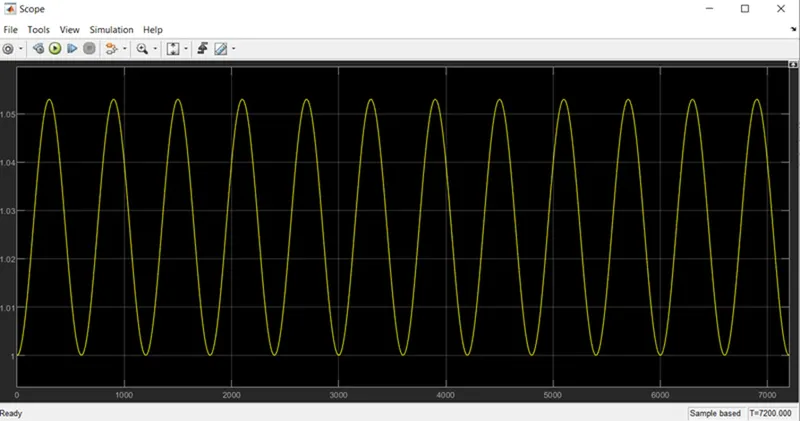
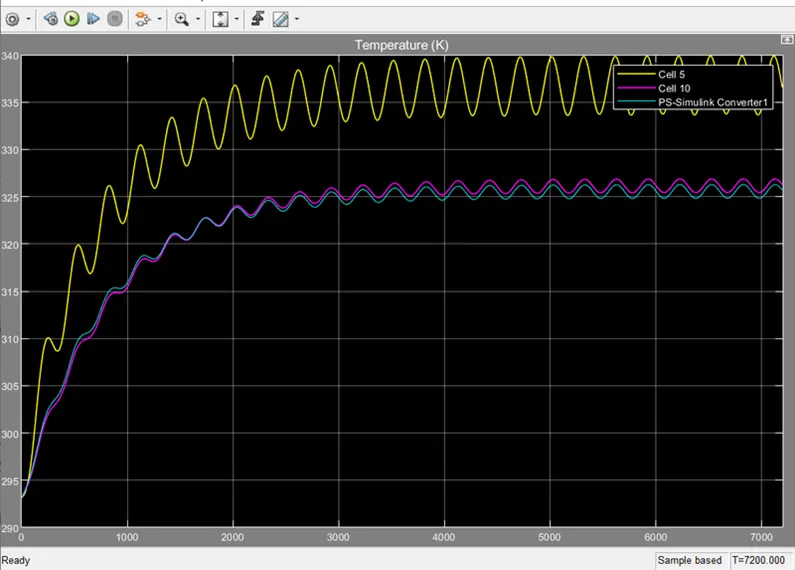
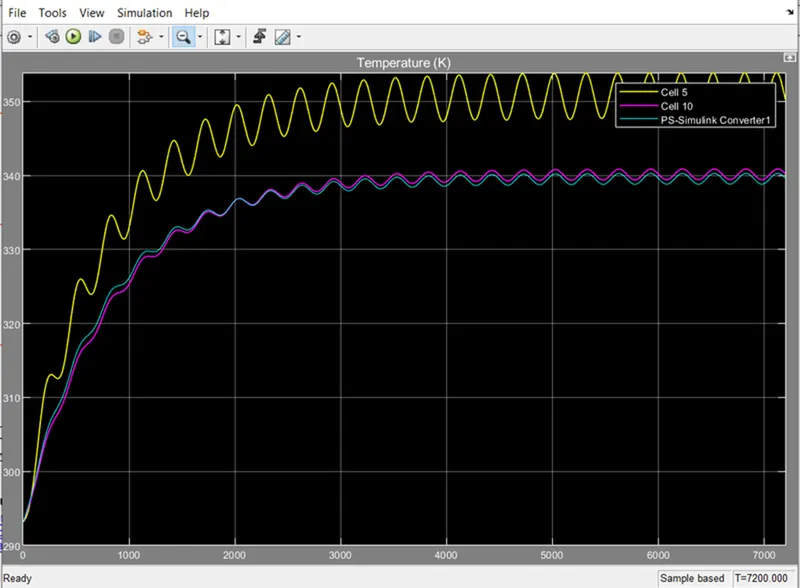
1-4 cells are normal cell 5th cell is faulty 6-10 cell is normal cell as we are simulating thermal effect on we give Cycle charge/Discharge profile to circuit the waveform you can see above results all conditions it same but when ckt is run on this derive cycle profile as 5th cell was faulty it will show temperature rise high than any other cell and the life cycle of cell get reduced and cell even can get damage.
So, as we give temp of results at 300k ie 26.85°C the 1-4 and 6-10 cell temp is near to 316k
But 5th faulty cell temp goes to 330k ie 56.85°C and the drive cycle is shown which is Cyclic charge/discharge drive cycle
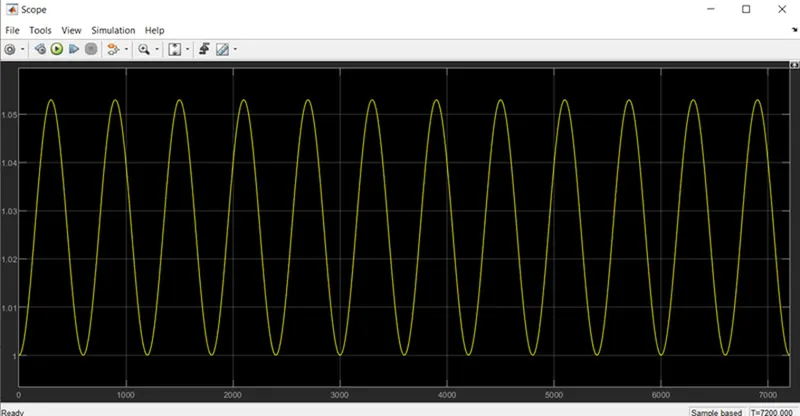
In condition two we give temp 310k ie 36.85°C and 1-4 and 6-10 cell temp is near to 326k but 5th faulty cell temp goes to 340k ie 66.85°C and the drive cycle is shown which is cyclic charge/discharge drive cycle.
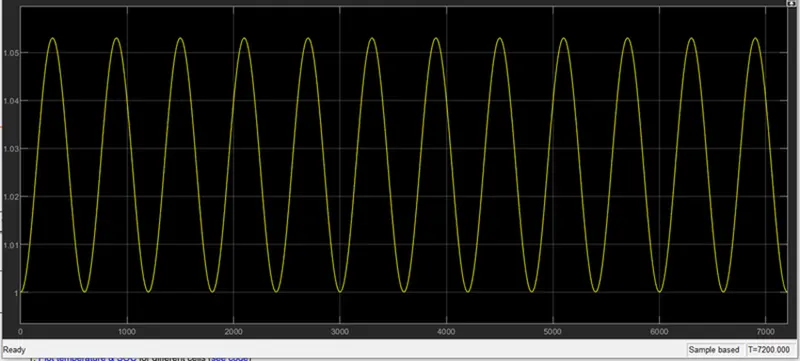
In condition two we give temp 324k ie 50.85°C and 1-4 and 6-10 cell temp is near to 340k but 5th faulty cell temp goes to 354k ie 80.85°C and the drive cycle is shown which is cyclic charge/ discharge drive cycle
Conclusion:
We simulate the thermal effect and compared at various temperature, faulty cell temp rise more than normal cell charge and discharge cycle given and due to temp rise it can damage the cell and reduce the performance of the battery.