Project 2 Thermal modeling of battery pack
In this project, we will analyze the effect of temperature, charge and discharge rate on life cycle performance of a lithium ion cell. For, the purpose of analysis of a 10 series cell battery pack, we can use 3.3V 6000mAh LFP type lithium-ion cell which is a popular choice in India among low power electric vehicles. First, results at different parameters will be plotted on scope viewer of MATLAB and then at the end Simulink Data Inspector will be used to analyze the effect of variations of these parameters on cycle life performance of cell. Instead of building model from scratch, we can tweak a preset model example in MATLAB (it's very easy to even build from scratch), since it only has few components. We will type the command "power_battery_ageing" and enter on command window and it will open a preset model as shown below -
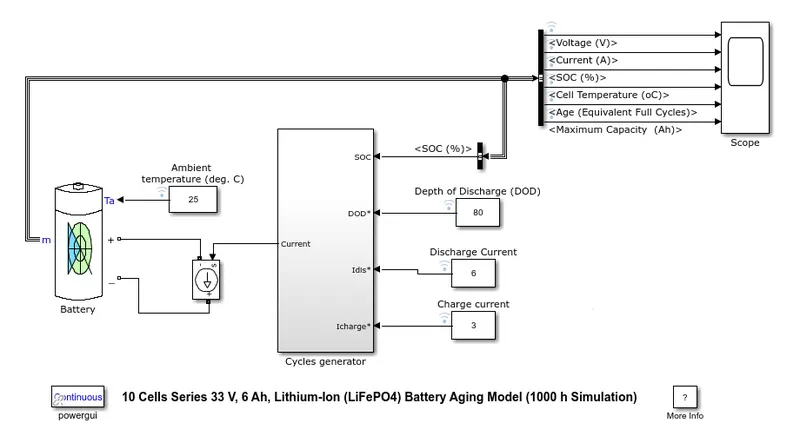
Now, in this we have a generic battery model, connected with a controlled current source to simulate charge/discharge conditions and cycles generator function to give input to controlled current source. Now, this function has 4 inputs, DOD, Discharge current, SOC and charge current. We can change DOD and Discharge current staircase blocks to constant signal blocks since we will be simulating constant signals. SOC is taken from measurement signal of battery. Measurement signals are plotted in scope viewer through bus selector block. If we will open cycles generator block, we will see following -
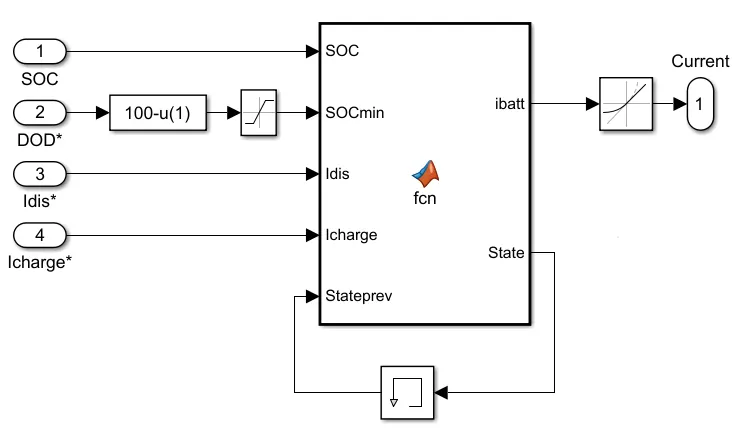
If we double click the function, following code will apear on the command window -
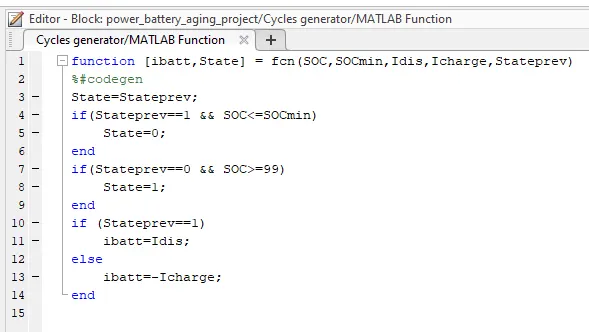
Here, a function is defined whose input is SOC, SOC minimum, discharge current, charge current and previous state. In the code, state i.e. new state is defined as previous state to continue previous operation of charging or discharging in certain conditional statements of the program. Now, we have four if else cases. If SOC reaches below minimum defined SOC (which is taken as 1-Max. SOC defined) then it will switch to state = 0 (Charging state). If SOC reaches more than SOC of 99, then it will switch to state = 1 (Discharging state), otherwise based on previous state it will continue. In the memory block initial state is defined as 1 which is the state of discharging. Thus, cell will start from discharging since it is at full SOC in the beginning.
Before we begin, we will log signals, for that purpose we will right click on signal and then click on Log signal data. We will open Data Inspector from Review Results window at the top. We will keep DOD signal value at 80 as industry standard for low range EV. One cell has specification of 3.3V 6Ah and thus pack of 10 cells will have value of 33V 6Ah. We will now open battery block. In that we will select preset battery as 'NO' and click on apply and set nominal voltage value at 33V and rated capacity at 6Ah. Then, we will go to discharge tab and select option of 'determined from nominal paramaters of the battery'. Now, click on 'Temperature' tab. Here, parameters are selected according to previous selected battery and we need to change them. We can take values from cell datasheet or use unitary method on previously selected cell to determine all the values (if we wish to work on same chemistry). We will repeat this process in aging tab. We will test different cases as shown below -
Charge Rate = 0.5C, Discharge Rate = 0.5C and Temperatture = 25 Degree Celsius :
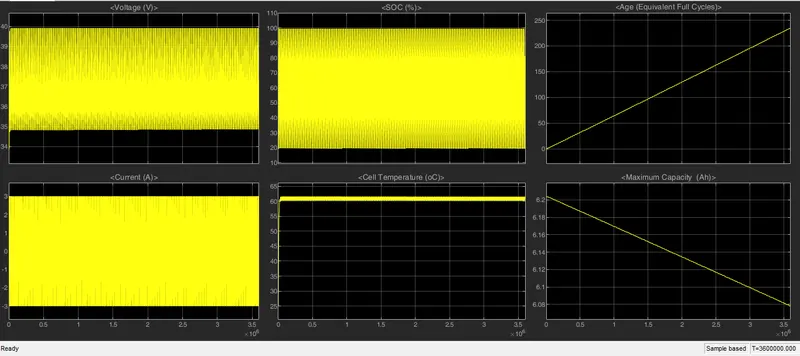
In this since there are cycles of charge and discharge, it raised cell temperature from ambient temperature. Use of battery also lead to reduction in battery maximum capacity. The battery discharges till 80% SOC and again charge upto 100% SOC. These cycles are repeated. Voltage varies according to SOC. Now, next we can perform same simulation at increased discharge rate of 1C and 2C as shown below-
Charge Rate = 0.5C, Discharge Rate = 1C and Temperatture = 25 Degree Celsius :
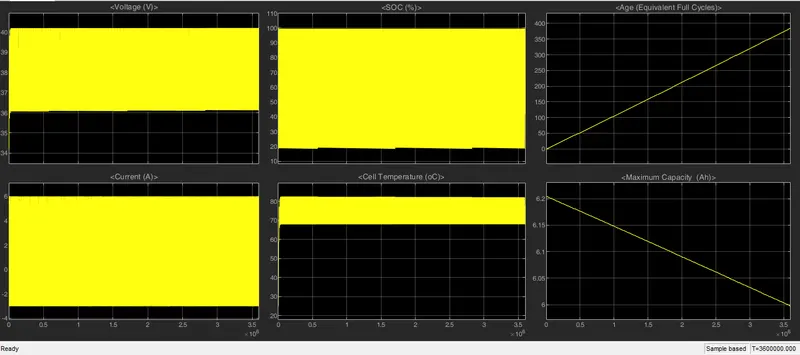
Charge Rate = 0.5C, Discharge Rate = 2C and Temperatture = 25 Degree Celsius :
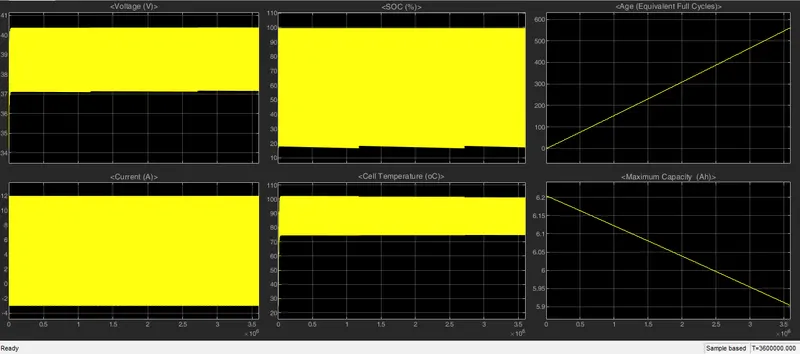
Now, we can compare these three discharges in simulink data inspector as shown below on impact of cycle life and maximum capacity -
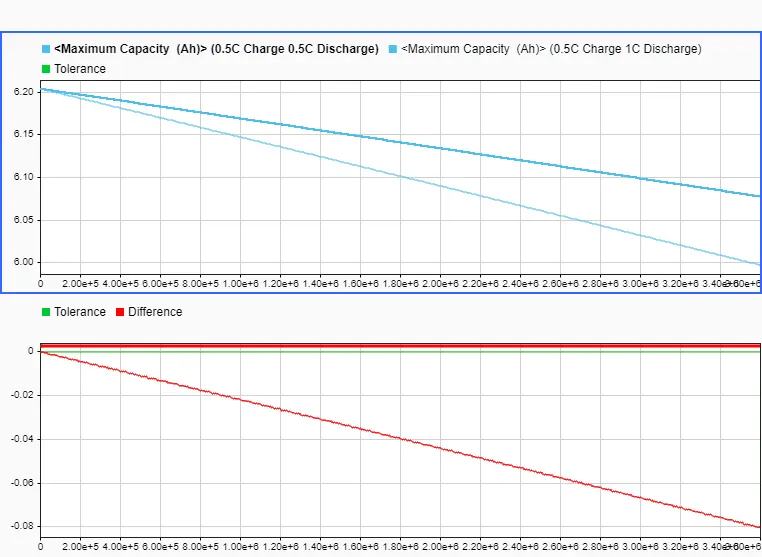
In this comparison of 0.5C and 1C discharge we can see that battery with 1C has faster degradation of maximum capacity. Similarly, we can compare ageing as below-
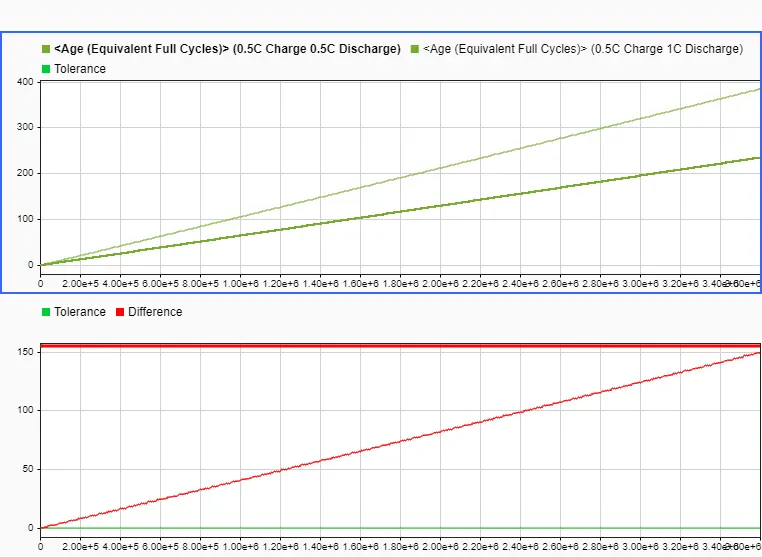
Again, ageing of 0.5C discharge is slower as compared to 1C discharge. The fact that ageing is directly propotional to discharge rate can again be validated by data comparison of 1C and 2C discharge rates as shown below -
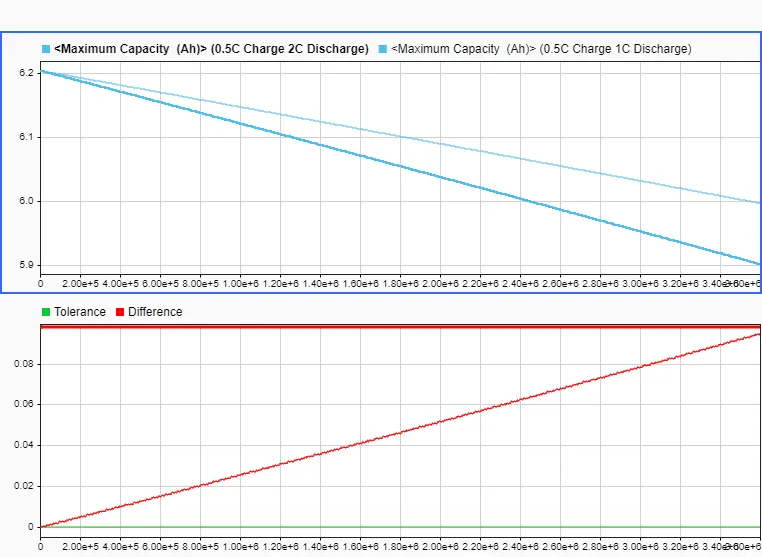
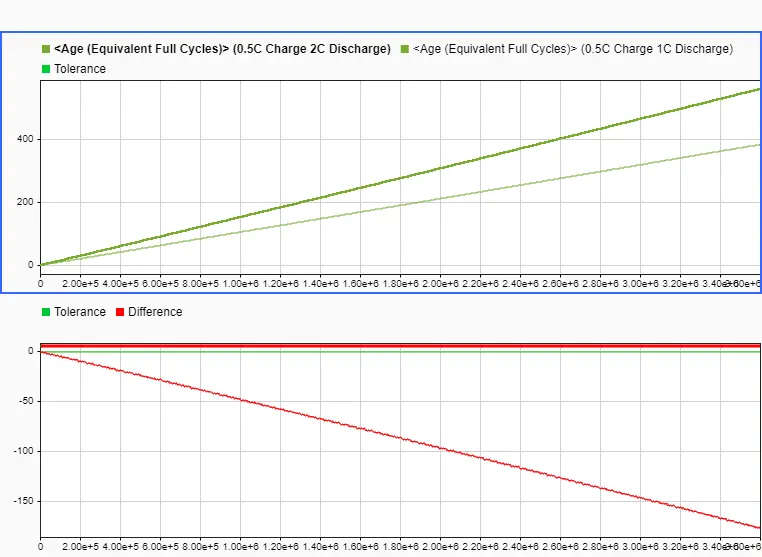
Then, we can make comparison of charging rate impact. For that, we can increase charging rate to 1C from last simulation of discharge rate of 2C current. So, we will get following results in scope viewer.
Charge Rate = 1C, Discharge Rate = 2C and Temperatture = 25 Degree Celsius :
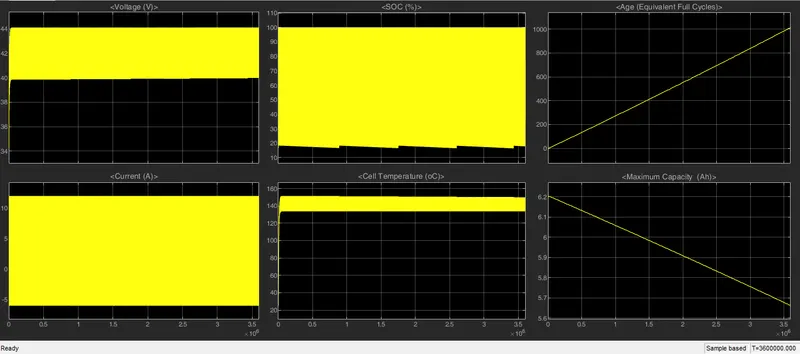
Now, we can compare these results with charge rate of 0.5C of last simulation where all other parameters are same in simulink data inspector. This will give us the relation of ageing and charge rate. The comparison result is plotted below-
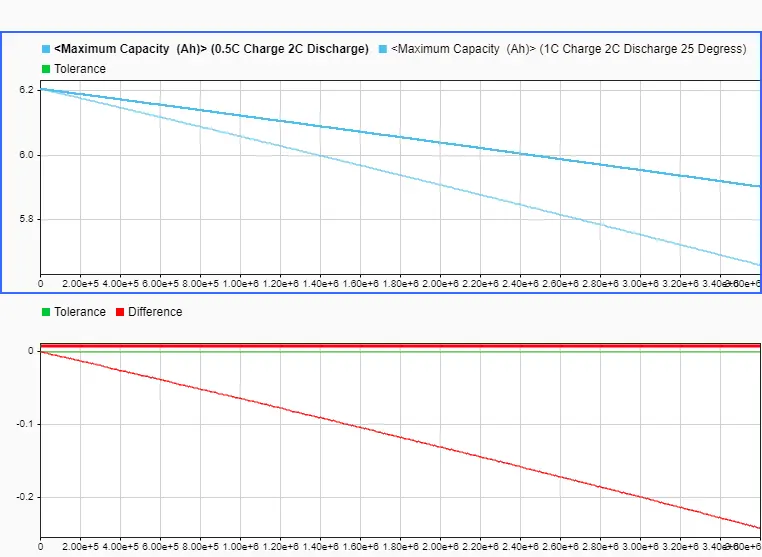
In this comparison of 0.5C and 1C charge rate, we can see that battery with 1C charge rate has faster degradation of maximum capacity. Similarly, we can compare ageing as below-
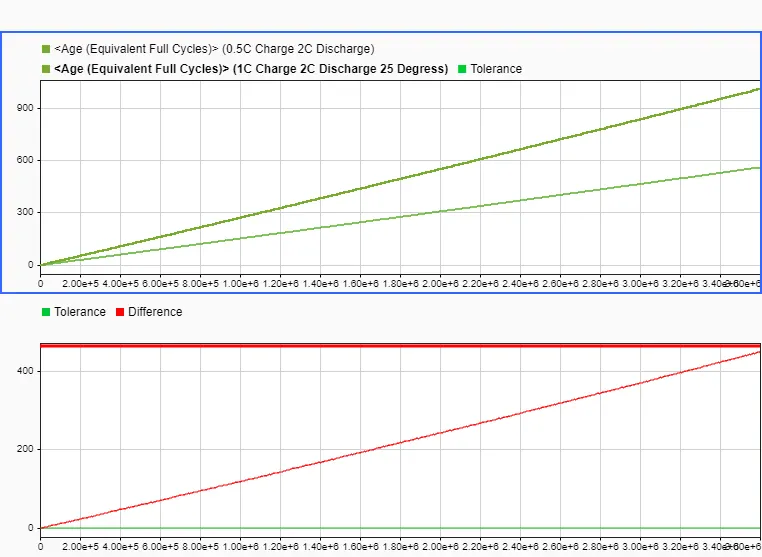
Again, ageing of 0.5C charge rate is slower as compared to 1C charge rate. The fact that ageing is directly propotional to charge rate can be validated by data comparison of above plots of 1C and 0.5C charge rates.
Then, we can make comparison of temperature impact. For that, we can increase temperature to 50°C from the last simulation of temperature of 25°C. So, we will get following results in scope viewer.
5. Charge Rate = 1C, Discharge Rate = 2C and Temperatture = 50 Degree Celsius :
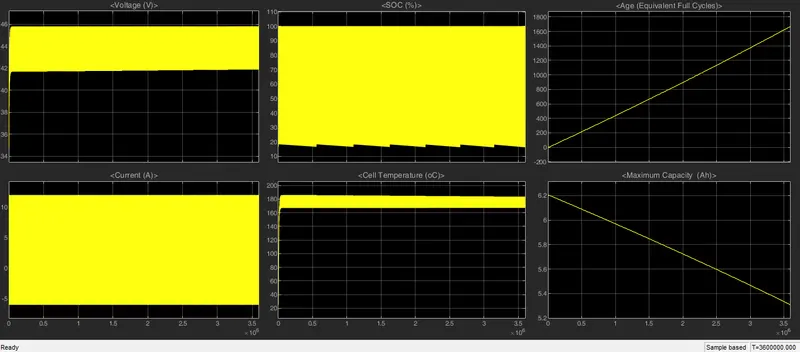
Now, we can compare these results with temperature of 25°C of last simulation where all other parameters are same in simulink data inspector. This will give us the relation of ageing and temperature. The comparison result is plotted below-
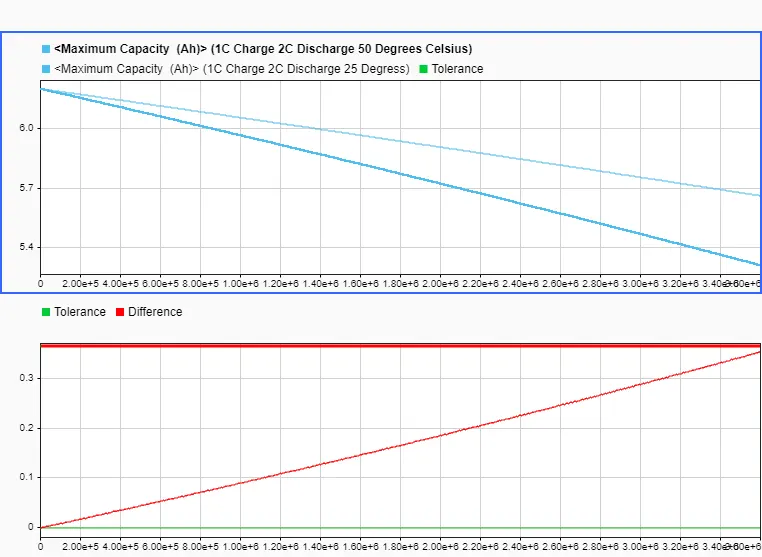
In this comparison of 25°C and 50°C temperature, we can see that battery with 50°C charge rate has faster degradation of maximum capacity. Similarly, we can compare ageing as below-
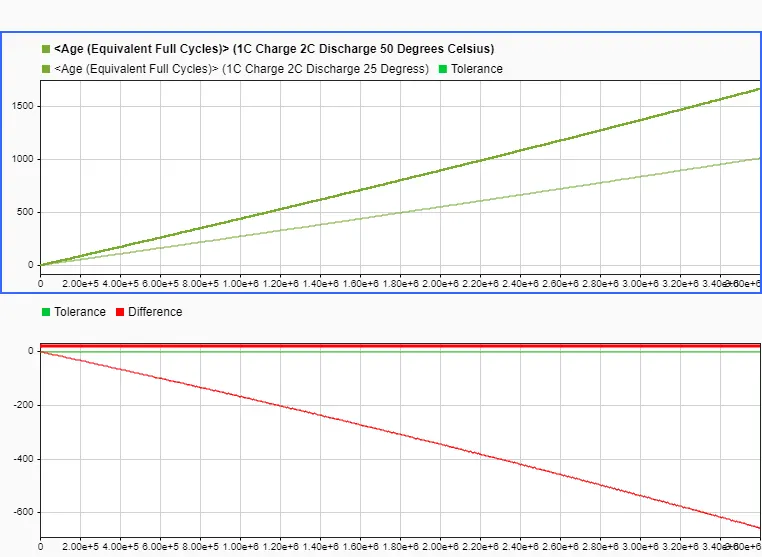
Again, ageing of 25°C temperature is slower as compared to 50°C ambient temperature discharge. The fact that ageing can be significantly affected by temperature can be validated by data comparison of above plots of 25°C and 50°C ambient temperature discharges. This further highlights lithium-ion battery challenges in north india where temperature goes from extreme low in winters to extreme high in summers leading to very minimal battery warranty by manufacturers.