Project 2 Thermal modeling of battery pack
Aim:-Thermal modeling of battery pack
Object:-
For a 10 cell series lithium ion battery model, simulate the thermal effects and compare life cycle performance at various temperatures, charge & discharge rates using MATLAB.
Introduction:-
EVs, HEVs and PHEVs are powerd by lithium ion cells which are fitted together in a battery pack with particular series and parallel arrangements. These arrangements and the number of cells in a battery pack are designed based on the power requirement of the vehicle. During the design stage of a battery pack, the cells in the pack are tested to simulate their thermal effects and life cycle performance under various conditions. These conditions ae real life situations that the battery pack may operate at when in use in a vehicle by a user and these tests are performed to observe how the cells behave. The condition will test the battery pack at normal operating levels as well as at their extremes for instance the battery pack may be tested under different and discharging rates, different temperature etc. As per the specifications of lithium ion cells, it is very important that the application of the cells follows the charging/discharging rates as well as the temperature range. Discharging these operating ranges will result in the accelerated degradation of the capacity and working life of the cell or worse- a thermal runway effect so it is very important that the manufacturers of EVs, HEVs, and PHEVs perform the thermal modelling of a battery pack before implementing it.
- Constant current charging
- Cyclic charging/discharging
- Drive cycle
For each configuration, there will be a slight change in the Simulink model with respect to the load given to the battery packs. With each configuration, i will observe the thermal effects and the variations in SOC as i independently change the ambient temperature between 303k, 308k and 313k.
Simulink model:-
This project will simulate a Simulink model of a battery pack under different temperature levels and charge/discharge rates and analyse the performance of the battery pack. This model is a modification of the lithium ion battery pack with fault which basically uses 3 battery packs connected in series.
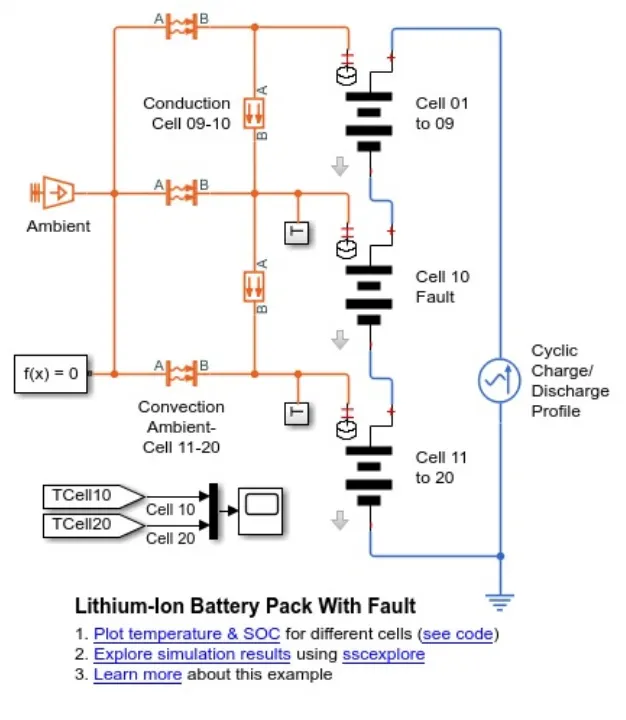
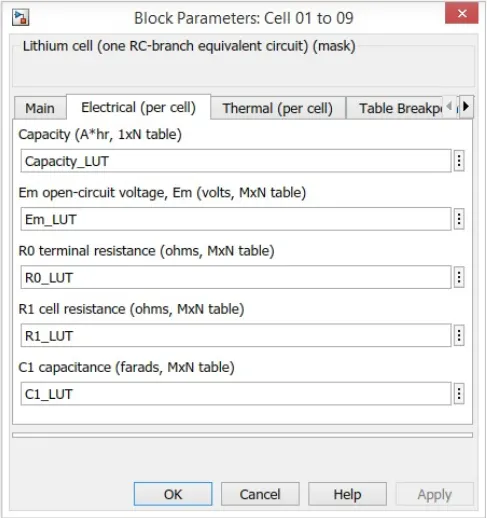
The first and third packs contains 9 and 10 cells respectively whereas the second pack contains 1 cell as the model name suggest, the second pack is designed to be at fault causing undesirable thermal effects from the system by default, the electrical parameters of the first and third [acks have the setting for the capacity, open circuit voltage terminal and cell resistance and capacitance as shown below-
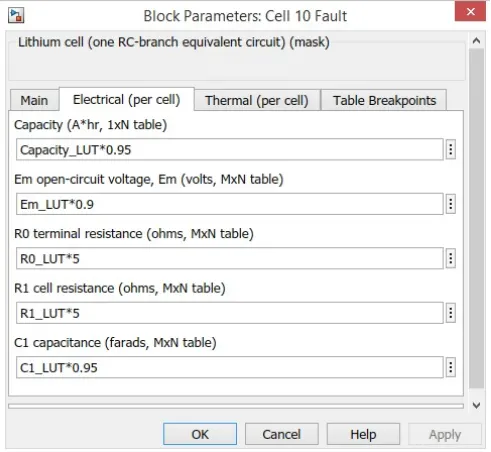
However the second pack's block electrical parameters give it a reduced capacity, open circuit voltage and capacitance but increased terminal and cell resistances which is wu it goes into fault. This is shown below-
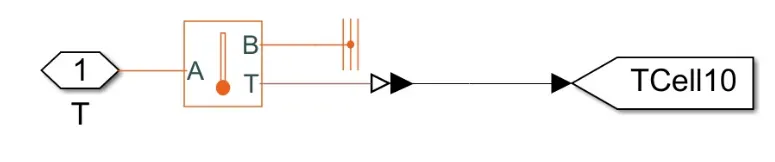
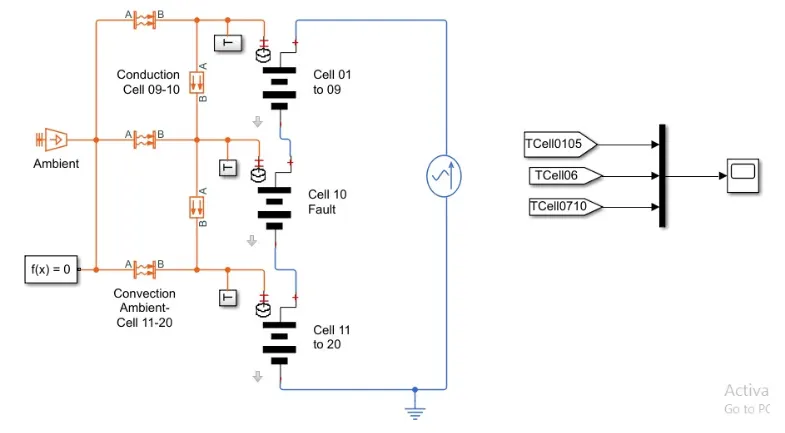
The fault model is used a variety of thermal related blocks to modify and measure the thermal effects of this system. For instance, it uses a temperature source block which allows us to change and set the ambient temperature. It also uses conductive and convective heat transfer blocks to simulate the heat transfer from the ambient temperature to the battery pack as well as the same between the packs. The second and third packs are connected to their own subsystem to measure the temperature across them. This subsystem uses a temperature sensor block and thermal reference block. These temperature readings are sent to from blocks from GOTO Blocks. These readings from the block are fed in to a Mux block which will take these input signals and output them to a scope so we can see the temperatures of the packs. The load on this fault model comes from an AC current source block which applies a cycle charging and discharging current to the battery packs at a peak amplitude of 50 and a frequency of 1/100. These various blocks are listed and labelled below-
Temperature Source

Conduction Heat Transfer Block
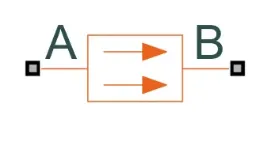
Convection Heat Transfer Block

Temperature Sensor Block

Thermal Reference Block

Temperature Sensing Subsystem
Mux Block
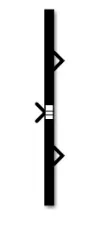
Scope

Modification
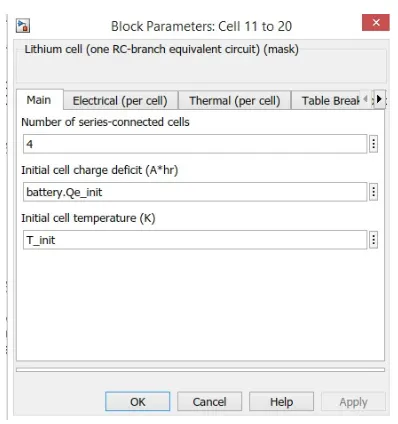
The first modification i made to the original Lithium-ion Battery with fault is the changing of the number of cells in the packs. Initially, there were 9 cells in the first pack, 1 cell in the second pack and 10 cells in the third pack. This was changed to the reqirement of 10 cells connected in series, so that the first pack has 5 cells and the third pack has 4. The first pack will have cells 1 to 5, the second pack will have cells 6 and the third pack will have cells 6 to 10. In spite of these changes, the naing of the packs is left unchanged because doing so would affect the opening of the temperature and SOC graphs via the hyperlink provided in the workspace.
The image below shows how the number of series connected cells is changed for the third pack.
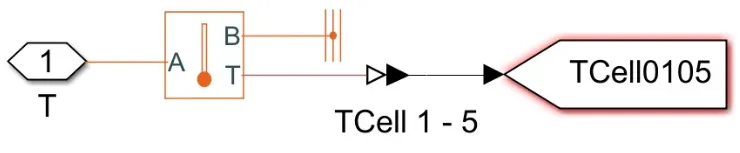
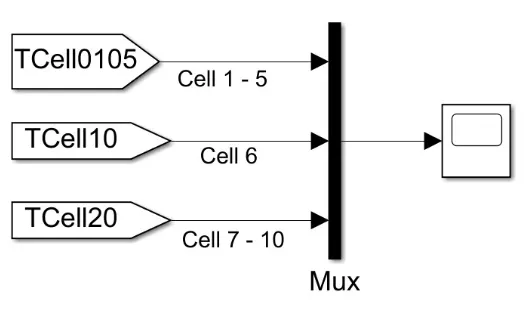
The second modification i made to the original model is the addition of an extra temperature sensing subsystem. Originally, a temperature sensing subsystem was in place to measure the temperature across the second and third battery packs, Since i am intrested to observe the thermal effects of all the battery packs, another subsystem was added to measure the temperature across the first pack. For this, the same blocks of temperature sensor, thermal reference, PS simulink converter and Goto blocks were used. To receive the signals from the Goto Block, a From block was also added which is in turn connected to the Mus=x block by adding an extra input port.
The image below shows the new temperature sensing subsystem with the new Goto block in the first pack and the Goto block is aptly named with a tag, ''TCell0105'' referring to it containing the first cells.
This image shows how an extra input port has been added to the Mux block and a From block with the same tag ''TCell0105'' so that it receives the sensed temperature data from the first pack's subsystem.
Drive cycle configuration
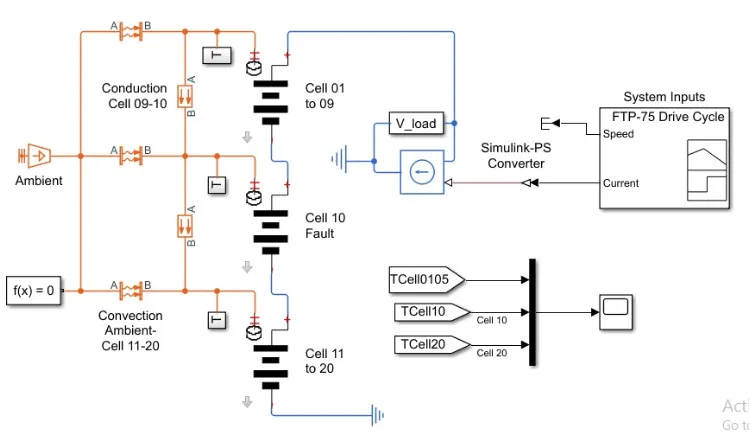
In this configuration, i have removed the AC current block which provides a cyclic charge/discharge load to the batteries. Instead, i have placed a set of blocks for a drive cycle load to be applied to the battery packs. These blocks includes-
- Signal builder block
- Controlled current source block
- Electrical reference block
- Simulink PS converter block
- Voltage senser block
The voltage sensor block is found by itself in the subsystem named V_load and a line connection is given from the connection between it and the controlled current source block to the positive terminal of the first battery pack. The third battery pack will be connected to the electrical reference block. The signal builder block contains the speed signal for the FTP-75 drive cycle as well as the corresponding current signal. Since we are applying an electrical load to the battery packs, the speed terminal of the signal builder block is terminated and the connection from the current terminal is used. The current signal and has to be sent to the controlled current source, so a Simulink-PS converter block is used in between.
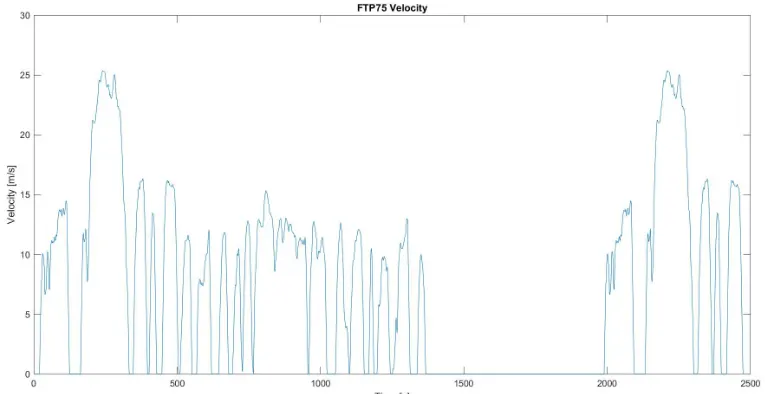
The image below shown the FTP-75 drive cycle plot-
The full drive cycle configuration is shown in the image below-
Result
Ta = 30k
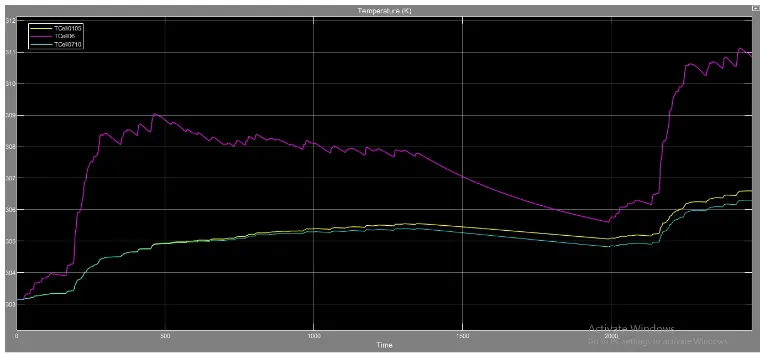
From the temperature results, we can see that the three battery packs all start out with the same initial temperature of 303k which is the same as the ambient temperature. After t = 23 seconds, the temperature of the second pack begins to rise noticeably compared to the other two packs. After t = 190 seconds, the temperature of the seconds, the temperature of the second pack rises rapidly between t = 125 and 163 seconds, the temperature of the second pack decreases slightly from 304k to 303.9k whereas the temperature of the other two packs remains constant at 303.3k. This corresponds to the period in the drive cycle where the vehicle is at rest. At t = 190 seconds, the vehicle accelerates rapidly and this reflected in the sharp increase in the second packs temperature. The temperature of the other two packs also increases noticeably quicker but to a lesser extent than the second pack at the same time period At t = 241 seconds, the vehicle reaches its top soeed of 25 m/s and the temperature of the second pack is 307.3k whereas that of the other two packs is 304k. The temperature of the packs continued to increase with small fluctuation.
At t = 461 seconds, the second pack reaches a temperature of 309k whereas that of the other two packs is still 304k. After t = 500 seconds, the temperatures of the first and third packs diverge slowly from each other but continue their general increasing trend with the first pack having a higher temperature throughout. However the second packs temperature follows a general decreasing trend. At t = 1354 seconds, the vehicle begins to decelerate and returns to rest at t = 1367 till t = 1987 seconds. During this same period, the second packs temperature dramatically decreases. The temperature of the first pack drop from 305.5k to 305k and that of the third pack drops from 305.3k 304.7k. After this period, the vehicle begins to accelerate once again and this is reflected in the temperatures of the packs increasing. At t = 2433 seconds, each pack reaches its maximum temperature. The second pack achieves 311k whereas the first and third packs achieve 306.5k and 306.2k respectively.
Ta = 308k
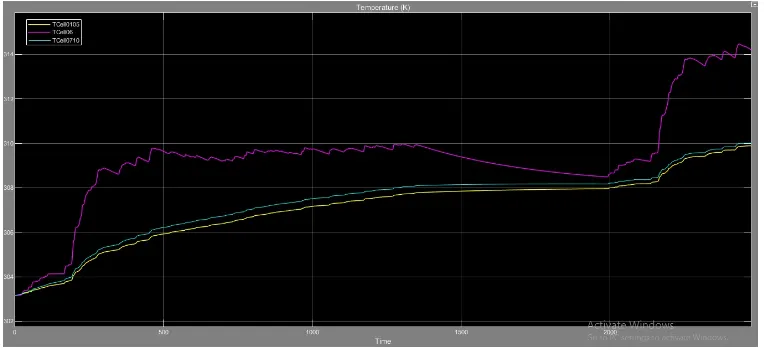
From temperature time grapgh, we can see that the battery packs all begin at a temperature of 303.2k which lower than the ambient temperature of 308k. Similar to the results at an ambient temperature of 303k, the temperature rises and drops correspond to the driving pattern followed by the FP-75 drive cycle. After t = 25 seconds, the temperature of the second pack diverges from the other two packs ans after t = 80 seconds, the temperatures of the first and third pack diverge from each other. At t = 190 seconds, the temperature of all the second pack begin to increse rapidly from 304.6k to 308k. At t = 302.2 seconds whereas that of the other two packs increases more gradually. From t = 463.7 seconds to t = 1348 seconds, the temperature of the second pack fluctuates between 309k and 310k. During the same period, there is a general increase in the temperatures of the other two packs with the first pack increasing from 305.8k to 307.8k and the third pack increases from 306.1k to 308.1k. Between t = 1348 seconds and t = 1989 seconds, there is a gradual decreases in the second packs temperature from 309.9k to 308.8k and this corresponds to the vehicle being at rest. During the same time frame, the temperatures of the other two packs continues to increases but levels off with the first pack at 308k and the third pack at 308.2k. The maximum temperature of the second pack is achieved at t = 2430 seconds at 314.4k whereas the first pack has its maximum at 309.9k and the third pack at 310k.
Compare to the ambient temperature of 303k, the overall temperatures of the packs are higher at an ambient temperature of 308k. Specifically, the temperature for the first and third packs are closer to that of the second pack. The temperatures of the first and third packs also reach higher levels than at the ambient temperature of 303k and thi can be explained by the higher ambient temperature causing more heat transfer via conduction and convection. The maximum temperatures of all the packs are also higher at the ambient temperature of 308k.
Ta = 313k
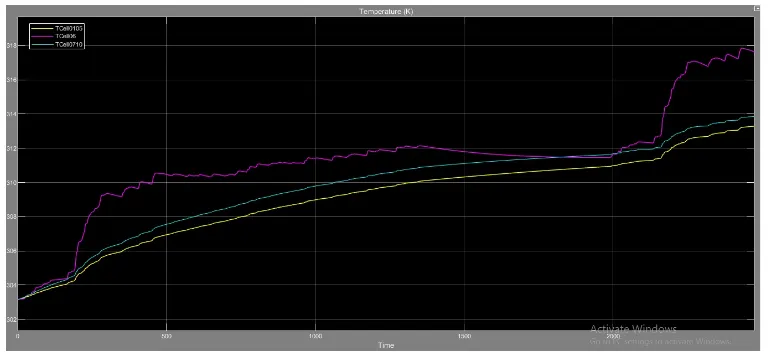
From the temperature time time grapg at an ambient temperature of 313k, we can see that the temperatures of all the packs show a general increasing trend as the time elapses for the simulation. Initially, all the battery packs begin at a temperature of 303k and after t = 50 seconds, the temperatre of the second pack begins to deviate from the other packs where as the first and third packs follow a similar trend together. At t = 190 seconds, there is a sharp increaes in the second packs temperature from 304.3k to 305.1k and that of the second pack rises from 304.5k to 305.5k. Between t = 1348 seconds and t = 1989 seconds, the vehicle is at rest and this is reflected in the pack temperatures. For instance, the second pack temperature which has been steadily increasingly begins to gradually decrease 312.1k to 310.9k. Interstingly, the temperature of the third pack surpasses that of the second pack at t = 1818 seconds before dipping again at t = 2009 seconds. The maximum temperatures of the packs are all achieved at different times. The maximum temperature pf the second pack is reached at t = 2429 seconds with 317.8k. The maximum temperatures of the first and third packs are reached at t = 2470 seconds 313.3k and 313.8k respectively.
Compared to the previous ambient temperatures, the temperature profiles of each pack is higher on average. The temperautres of the first and third packs are closer in proximity to that of the second pack and this is due to the higher ambient temperature causing more heat transfer via convection and conduction. The maximum temperatures of each pack are also higher than for the previous ambient temperatures. For the first time, the temperature of the second pack dipped below that of the third pack despite it being designed to go in to fault. Similar to the ambient temperature of 308k, the temperature of the third pack was greater than that of the first pack for the majority of the time which is unlike what was observed at the ambient temperature of 303k.
State of Charge(SOC)
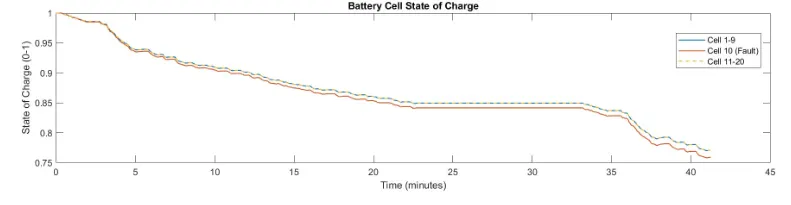
From the SOC results, we can se that all the paacks begin with 100% SOC and this begins to decrease with the increase in time. After t =3 minutes, the SOC has dropped t 98% and after this, the SOC drops at a higher rate falling to 94% at t = 5 minites. During the same period, the SOC of the three packs begin to diverge from one another with the second packs SOC dropping more than the other two packs which drop at the exact same pattern. From. t = 5 minutes to t = 20 minutes, there is a general decrease in the SOC of all the pack until t = 22 minutes where the SOC of the second pack reaches 84.16% and that of the other two packs reaches 84.93%. From t = 22.67 minutes to t = 33 minutes, the SOC of all the packs remain constant and this corresponds to the vehicle being at rest. After this period, the SOC of the packs continues to drop with continued driving. Between t = 36 minutes and t = 37.81 minutes, the SOC of the second pack drops from 82% to 77% and that of the other two packs drops from 83% to 79%. By the end of the drive cycle, the second pack has an SOC of 76% whereas that of the other two packs reaches 77%.
Unlike for the thermal effects, the SOC of the drive cycle configuration is unchanged when the ambient temperature changes. This may be due to the fact the ambient temperature was not high enough to create any noticeable or significant effect on the SOC of the three battery packs. Another reason for this could be that the change in the rate of increase and decrease in the SOC is more closely related to the type load applied to the battery pack.
Cycle configuration
This configuration is identical to the original Lithium-Ion Battery With Fault model in that it uses the same load an the battery packs. This load is in the form of an alternating current which is provided by the AC Current Source block, with the positivr terminal connected to the battery packs and the negative terminal connected to the electrical reference. This load will cyclically charge and discharge the battery packs in a particular frequency aand charging and discharging current. The AC Current Source block is shown in the image below-
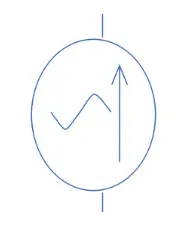
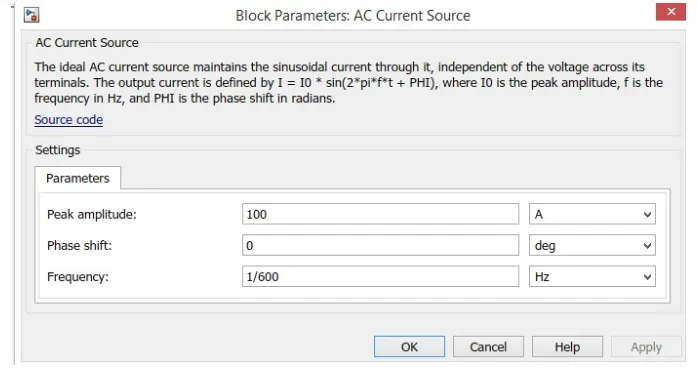
The image above shows the block parameters of the AC Current Source block. In it, i have modified the parameters so that the peak current is 100A and that the frequency is 1/600Hz. A very small frequency was chosen because common grid AC frequencies of 50/60Hz would take much longer to simulate in simulink. Since the frequency is 1/600Hz, the time period of the AC current is 600 seconds, and so a simulation time of 6000 seconds (10 minutes) was chosen. The overall configuration of the model is shown below-
Results
The results of the cyclic charge and discharge load on the battery packs is shown below-
T = 303K
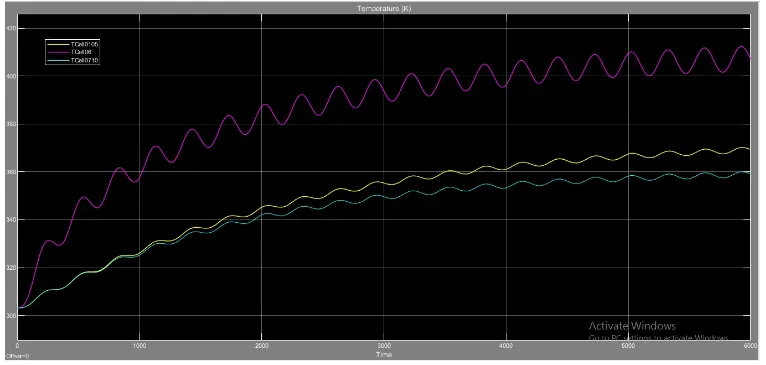
From the above temperature - time graph, we can see that there is a general increase in the temperature of the three packs as the time elapses. Initially, all the three packs start with the same temperature of 303k. Immediately after, the temperature of the second pack rises dramatically, diverging from the temperatures of the first and third packs. The temperatures of all three packs increases in a fluctuating manner due to the cyclic nature of the charging and discharging load. After t = 500 seconds, the temperature profile of the first and third packs also begin to diverge from ine another and this continues as the time elapses. At t = 1000 seconds, the temperaturenof the second pack had reached 357.4k whereas that of the first and third packs had reached 326k and 325k respectively.. At t = 2000 seconds, the temperatureof th second pack had climbed to 387.3k whereas that of the first and third packs had reached 345.1k and 342k. After t = 5000 seconds, the temperature profiles of all the packs seems to have levelled off. For instance the second packs temperature osci;;ated between 411k and 400k. The firast packs between 360k and 356.5k.
The general increase in the temperatures of all three packs can be attributed to the continous charging and discharging load. Both charging and discharging a battery can cause the temperature of a cell to increase, but repeating the process cyclically will increase the temperatures significantly. Since the second pack contanis the cell with the fault, its temperature shoots up and remains at a much higher level compared to the other two packs. Form this graph, we can see that the temperature of the second pack is at dangerously high levels as it devites from the other two packs to such a great extent. The temperature of the first pack is at higher level than that of the third pack because it contains an extra cell and this different contributes to the discrepancy between the two packs.
T = 308K
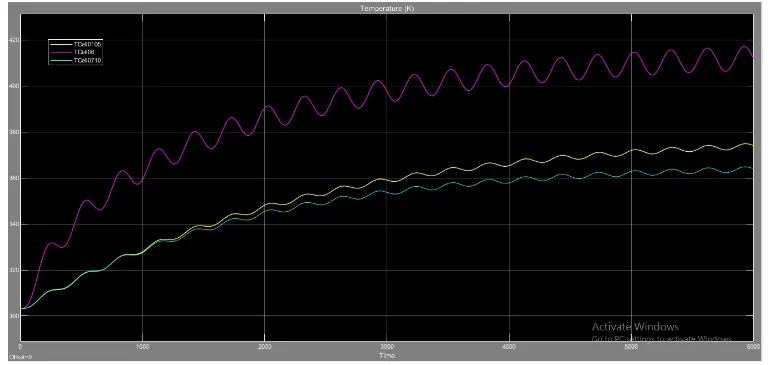
From the above temperature - time graph, we can see that just like the previous graph, is a general increase in the temperature of the three packs as the time elapses. Initially, all the three packs begin with the same temperature of 303k and immediately after, the temperature of the second pack deviates dramatically, from that of the other two packs. At t = 1000 seconds, the temperature of the second pack had risen 327.7k. Until this point, the temperature of the first and third packs were rising at the same rate, but immediately after, the temperature of the first pack begins to deviate away, increasing at a higher rate than compared to the third pack. By t = 2000 seconds, the temprature of the second pack had risen to 390.3k whereas that of the first and third packs had risen to 348.1k and 345.4k. After t = 5000 seconds, the temperature profiles each pack begins to stabilize and oscillate between fixed intervals. For instance, the temperature os the second pack oscillates between 417.2k and 404k. The first packs temperature oscillates between 370.5k and 374.9k and that of the third pack oscillates between 361.2k and 364.8k. These oscillations continue till the end of the simulation.
The general increase in the battery pack temperatures is due to the repetitive charging and discharging load. Compare to the ambient temperature of 303k, there is a slight increase in the temperatures of each pack on average. This is due to the higher ambient temperature causing more heat transfer to the cells in the battery pack via conduction and convection. This has effected each stage of the cells in the temperature profiles. For instance, towards the end of the simulation the temperatures of the second pack oscillated between a higher temperature rahge than observed at 303k. The same effect is seen with the first and third battery packs. Another trend observed is that the temperature level at which the temperature profiles of the first and third packs deviates at is increasing as the ambient temperature increases.
T = 313K
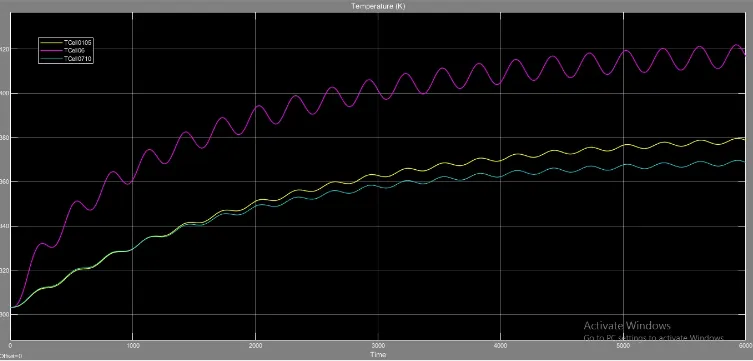
From the above temperature - time graph, we can see that there is a general increase in the temperature of the three packs as the time overall. Initially, all the three packs begins with the same temperature of 303k and immediately after, the temperature of the second pack begins to shoot up an deviate from that of the other two packs. This is the same pattern that was seen in the previous two ambient temperatures. At = 1000 seconds, the temperature of the second pack has risen to 360k which is the same level that was observed at the ambient temperature of 308k. The temperature of the first and third packs follow same trend and were rising at the rate reaching 330k, which is slightly higher than the observation in the previous ambient temperature. At t = 1500 seconds, the temperature profiles of the first and third packs begin to diverge from one another and thid divergenses as the time increases. At t = 2000 seconds, the temperature of the second pack reaches 393.1k, whereas that of the first and third packs reaches 351k and 348.8k respectively. After t = 5000 seconds, the temperature profiles of all three packs stabilizes in that they oscillate between fixed ranges, similar to what was observed in the previous two ambient temperature cases. For instance, the second packs temperature oscillates between 409.3k and 421.8k. The first packs temperature oscillates between 375k and 379.6k whereas that of the third pack oscillates between 365.9k and 369.6k. These oscillations continue till the end of the simulation.
The thermal effects for this ambient temperature are similar to what was observed in the% previous two ambient temperatures. At this ambient temperature, the temperature profiles f all three packs is greater than that of the previous two ambient temperature levels on average. This is because the higher ambient temperature led to greater heat transfer from the ambient air to the cells in the battery packs via conduction and convection. The temperature profile of the first and third packs were increasing at the same rate for a longer duration before diverging apart than compared with the previous two ambient temperatures. The stabilization region of the temperature profiles of the three battery packs are also at higher ranges than they were for the previous two ambient temperatures.
State of Charge(SOC)
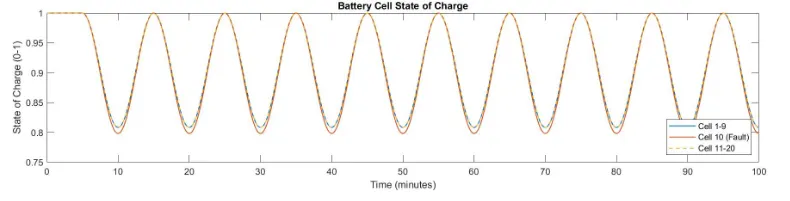
Similar to the drive cycle configuration's SOC results, The SOC results are unchanged for this configuration for the three temperature levels. From the above SOC graph, we can see that in general, the SOC of all three packs oscillates from 100% to 79.84% continouslt throughout the whole simulation period. The continous decrease and increase in the SOC correspond to the discharge and charge loads provides by the AC current source block. Initially, the SOC starts at 100% because the model begins with the cells in each pack having 100% SOC starts at till t = 4.9 seconds. Immediatly after, the first discharge load occurs causing the SOC to fall rapidly to two different levels. For the first battery pack, the SOC drops to 80.85% and that of the third battery pack drops to 79.84% at the same time at t = 10 seconds. Immediately after, the SOC rises back to 100% at 15 seconds and this is the first charge load that occurs for the simulation. These oscillations continue without any change in the SOC magitude of rate of change of SOC for all three packs.
The SOC observations do not change with the changes in the ambient temperature. Besides this the SOC results are exactlt as expected. With respect to the discrepancy between the second battery pack and the first and third battery packs, this is attributed to the differences in their electrical parameters. We know that the second pack has been designed to go in to fault due to its reduced capacity, capacitance and open circuit voltage and increased terminal and cell resistances. This has caused the SOC of the Second pack to fall to s slightly greater extent than compared to the other two packs.
Constant Current Charging
In this configuration. I will be making another slight change in the load applied to the battery packs. I will apply a constant current load to the battery pack at a specified current. This configuration will show how the thermals of the battery packs vary under the constant current charging mode. This configuration's model is shown in the below -
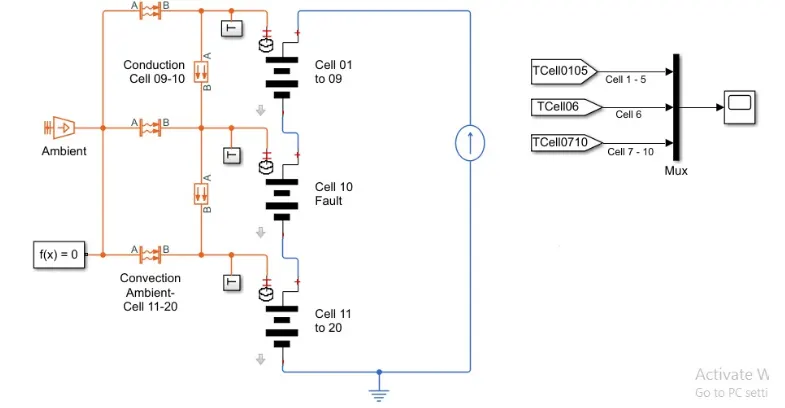
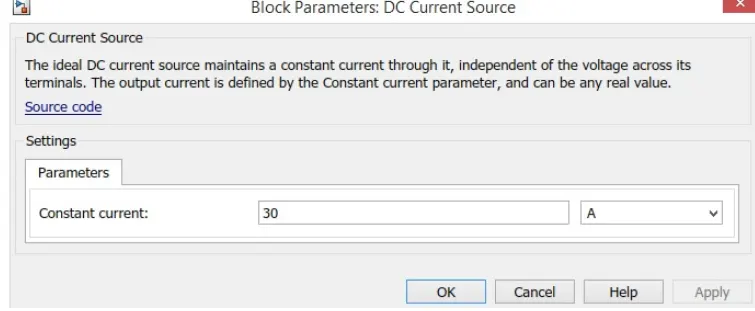
From this model, we can see that the small modification is in the form of the DC Current Source block and its block parameters are shown in the below image. I decided to use a constant current of 30A.
Results
T = 303K
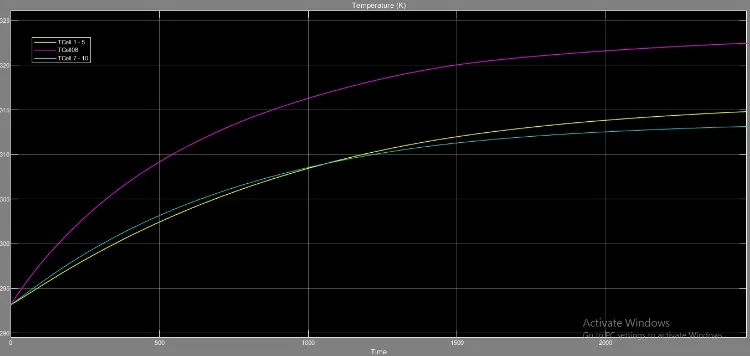
From the above temperature - time graph, we can see that there is a general increase in the temperature of the three battery packs as the time increases. Initially, all the three packs begins at a temperature of 293k and immediately after, the temperature of the second pack deviates from that of the other two packs. Shortly after, the temperature of the first and third packs also begin to deviate from each other, with that of the third pack increasing at a higher rate. At t = 500 seconds, the temperature of the second pack had risen to 309k whereas that of the first and third packs had climbed to 302.5k and 303.2k. At t = 1053 seconds, the temperature profiles of the first and third packs intersect at 308.6k before the first packs temperature surpasses that of the first and third pack and continuing to diverge once again till the end of the simulation. At the same time, the temperature of the second pack had risen to 316.3k. After t = 2000 seconds, the rate of increase of temperature of all three packs begins to level off coming to a more stable level. Fore instance, The temperature of the second pack had risen from 321.6k to 322.5k between t = 2000 seconds and t = 2500 seconds, and this is the slowest rate of increase of the temperature. The same is observed with the other two packs. For the same time period, the first packs temperature rises from 313.9k to 314.8k whereas that of the third pack rises from 312.6k to 313.1k.
Since the battery is being charged at a continuously at a constant rate, a temperature rise in the packs is expected. The second pack had an overall temperature increase of 29.5k whereas that of the first and third packs had risen by 21.8k and 20.1k respectively. The second pack had the highest temperature increase due to it being designed to go to fault. The temperature rise of the first and third packs is also not negligle and is also quite excessive but that of the first pack is greater due to it having one more extra cell than the third pack.
T = 308K
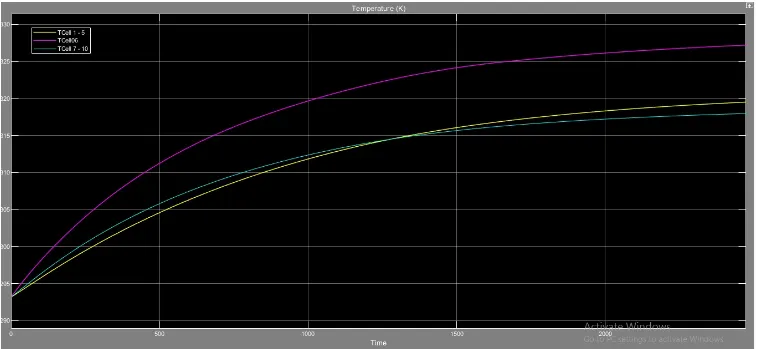
From this temperature - time graph, it is evident that the temperatures of all the battery packs shows an increasing trend as the time increases. Initially, the temperature of all three battery packs begins at 293k and as observed in the previous case, the second packs temperature diverges from that of the other two packs innediately after. The temperature of the first and thord packs also diverge from one another shortly after with that of the third pack incraesing at hogher rate than that of the first pack. At t =500 seconds, the temperature of the second pack had risen to 311.3k whereas that of the first and third packs has increased to 304.6k and 305.8k. At t = 1271 seconds, the temperature profiles of the first and third packs intersects with each other at 314.5k and shortly after, the first packs temperature surpasses that of the third pack. At the same time, the temperature of the second pack had risen to 322.5k. After t = 2000 seconds, the rate of increase of temperature of all three packs decreases. For instance between t = 2000 seconds and t = 2500 seconds, the temperature of the second pack rose from 326.1k to 327.2k. For the same time frame, the first packs temperature increased from 318.3k to 319.5k whereas that of the third pack rose from 317.2k to 318k.
Due to the higher ambient temperature, the temperature of the packs was higher on average than what was observed in the previous case, due to greater heat transfer occuring via conduction and convection. The rate of increase of temperature of all three packs was also hogher than compared to the previous case. The overall increase in the temperature of the second pack was 34.2k and that of the first and third packs was 26.5k and 25k respectvely. This is expected since the second pack is desingned to go in to fault and so would have a greater temperature rise overall than compared to the other two packs. The higher ambient temperature also helps aids this process. Compared to the previous case, the time and the temperature at which the temperatures of the first and third packs interscts has increased by 218 seconds and 5.9k.
T = 313K
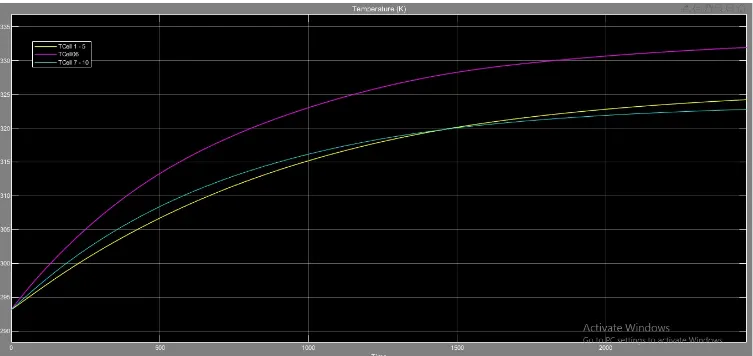
From the above temperature - time graph, the temperatures of all the battery packs undergoes a general increase as the time elapses. Initially, all the cells begin at the same temperature, 293k, which was observed in the previous two cases. Similar to the last two cases, the second packs temperature profile immediately diverges away from that of the other two packs. Shortly after, the temperature profile of the first and third packs also deviate from one another with that of the third pack increasing at a higher rate. This was also observed in the last two cases. At t = 500 seconds, the temperature of the second pack had risen to 313.3k whereas that of the first and third packs had increased to 306.7k and 308.4k respectively. At t = 1440 seconds, the temperature profiles of the first and third packs intersects with each other at 319.7k before that of the first pack surpassing that of the third pack right after. At the same tie, the temperature of the second pack had risen to 327.8k. Between t = 2000 seconds and t = 2500 seconds, the rate of increase of temperature for all three packs begins to decrease. For instance, for that time frame, the second packs temperature had risen from 330k to 331.9k. in the same time period, the first and third packs temperature rose from 322.8k and 321.9k to 322.8k respectively.
Due to the higher ambient temperature than the previous two cases, the overall increase in the battery pack temperatures was higher here. This is because the higher ambient temperature caused greater rates of heat transfer via the conduction and convection processes. The overall temperature rise of the second pack was 38.9k whereas that of the first and third packs was to it being designed to go in to fault. The time and temperature at which the temperature profiles of the first and third packs intersects by 169 seconds and 5.2k compared to previous case.
State of Charge (SOC)
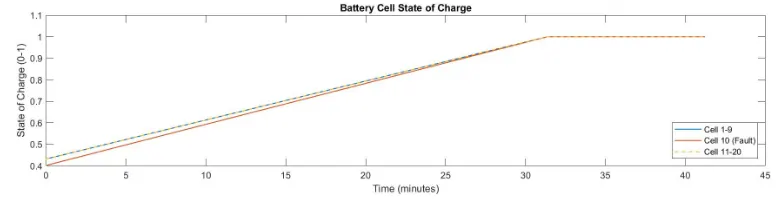
From the SOC graph, we can see that there is an increase in the SOC as the time elapses and this is expected since the three battery packs were being charged. Initially, the first nd third packs had an SOC of 43.35% whereas that of the second pack was 40.37%. The second packs SOC Begins at a lower value than compared to the other two packs because its block parameters design it to go in to fault. Since it has higher resistances and lower capacity and capacitance, its SOC will be lower. Despite the small discrepancy in the SOC between the second pack and the other two packs, the SOC of the second pack rises at a much quicker rate. For instance, between t = 0 minutes and t = 10 minutes, the SOC of the second pack had risen to 59.32% whereas that of the other two packs had increase to 61.35%. The faster rate of increase of SOC of the second pack is also attributed to its altered block parameters and this resulted in the intersection of the two SOC curves at an SOC of 98% at t = 31 minutes. At t = 31.37 minutes, all three battery packs reach an SOC of 100% and thus become fully charged. The SOC of all three packs remains at 100% till the end of the simulation time. Overall, the second pack had reached an SOC of 100% quicker than the other two packs. The reduced capacitance and capacity and increased resistances of the second pack has caused it to get charged more quickly than the other two packs. This higher rate of charging is undesirable since it must be higher than the safe charging current. This is why it goes in to fault. There is no variation in the SOC profiles of all three packs as the ambient temperature was increased.
Conclusion
In conclusion, the thermal modelling of a 10 cell series arrangement has been performed using Simulink at three different temperature levels 303k, 308k and 313k for three different charging and discharging conditions. For each condition, the Simulink model was configured slightly differently to change the load applied to the battery packs. The temperature and state of charge of each pack at each ambient temperature level for each load application was plotted, analyzed and expained in reference to the load applied to the battery packs.