Thermal modeling of battery pack
Aim: To model a 10 cell lithium ion battery pack and simulate it for studying thermal effects on the battery. The study consists of comparion of cell's performance for change in its temperature.
Introduction:
A battery is used by discharging the current stored in it and again charging it for next use. Chemical reactions take place in the battery in order to supply and recieve current. The effect of temperature on the battery is related to the chemical reactions and also the materials used in the battery cell. There is a relation between the rate of chemical reaction and the temperature of reaction, governed by an equation called Arrhenius equation. Simply, change in temperature can slow down or increase the rate of chemical reaction in the battery.
Also, due to change in temperature the conductivity of the ions of elctrolyte and the electrodes is also changed. These effects of temperature on battery are seen as reduced capacity, reduced charge and discharge rates, reduced SOC, reduction in the life cycle, etc.
A typical air cooled battery pack is supplied with ambient air and temperature to cool the cells. In this type of cooling the inner cells are not cooled properly as the air cannot reach them. Hene the inner cells remain hot under loading.
In order to validate this we are using a MATLAB model of lithium ion battery and analysing the result.
Procedure:
A lithium ion battery pack of 10 cells is used. In order to check for the thermal effects, one of the cells is considered faulty. Fault in the sense that the temperature of this cell is higher than the other nine.
The battery is assumed to be air cooled and provided with ventilators with ambient air and temperature. For modelling this case, all the cells are connected with ambient temperature.
The convective heat transfer from surrounding to the cells and conductive between the cells is also modelled using the respective blocks. There are temperature sensor blocks used to detect the temperature from the cells.
The current drawn from the cells is controlled by the 'Controlled CUrrent Source' block. The data of a drive cycle in the form of current is fed to this current controller. A signal builder block is used to feed this drive cycle data and it is stored in the form of current vs time.
After running the model a SOC vs time and temperature vs time graphs are plotted.
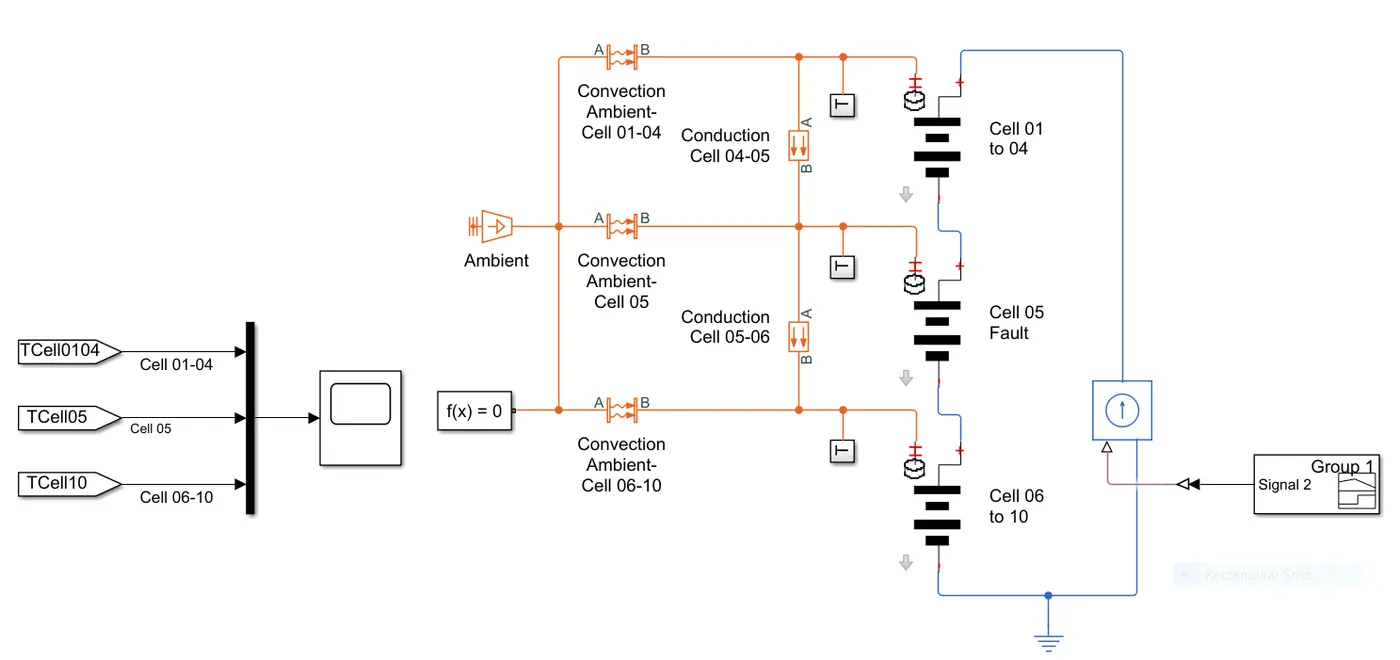
This is 10 cell lithium ion battery model with one faulty cell.
These 10 cells are connected in series with first four and last five cells with normal condition and behaviour. The middle fifth cell has high internal and terminal resistance amd hence genrate more temperature. The open circuit voltage and capacity is lower for this middle cell. The images below shows parameters for first four cells. There are 4 cells with all parameters same, indicating totally balanced cells. The last five cells aslo have same parameters.
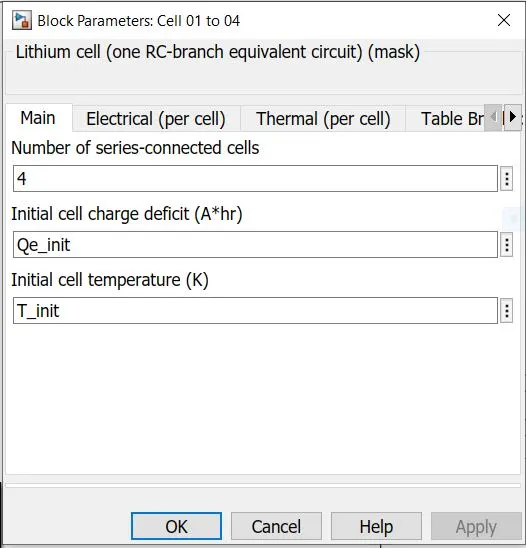
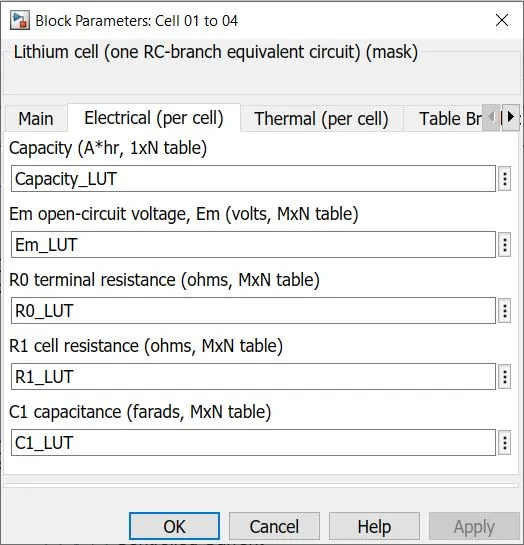
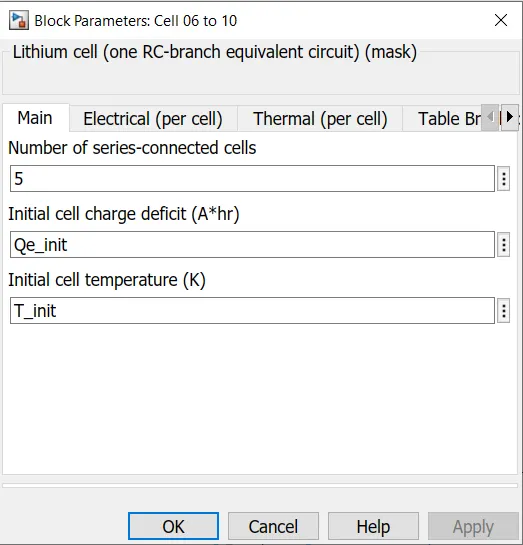
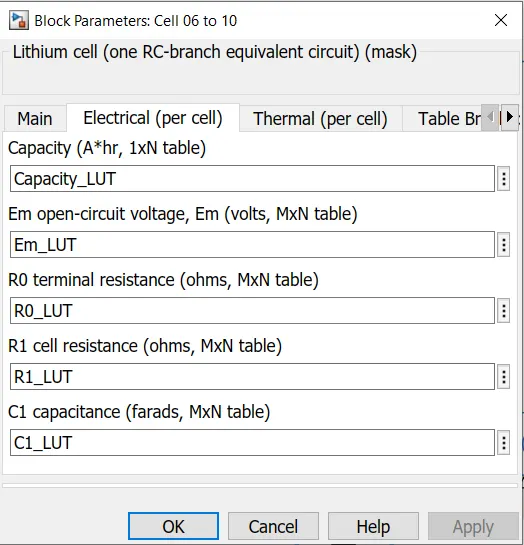
The middle two cells generate more temperature as they are not ventilated properly. This is modeled by increasing the terminal and internal resistance int these two cells. The below images show cell 5 and 6 parameters.
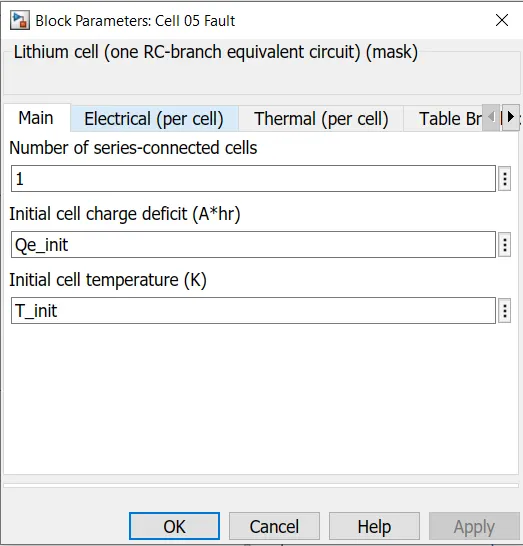
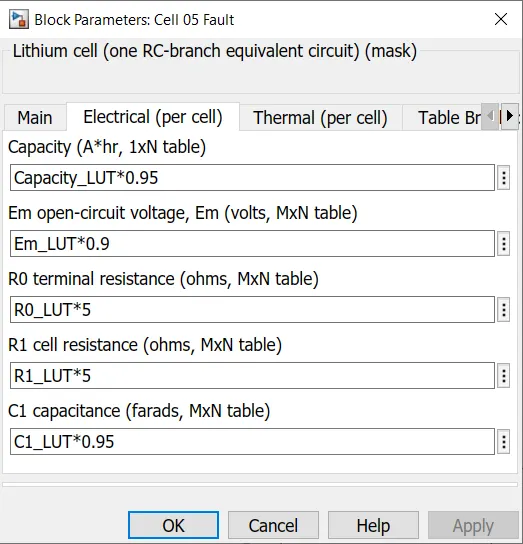
From the block parameters it is seen that the capacity, open circuit voltage and capacitance of cell 5 and 6 is reduced. Also, terminal resistance and internal resistance is increased.
The drive cycle data in the form of current vs time is shown below. A signal builder block is used to implement it in the model. This current data is sent to controlled current source block, so that it extracts the same amout of current through the battery pack.
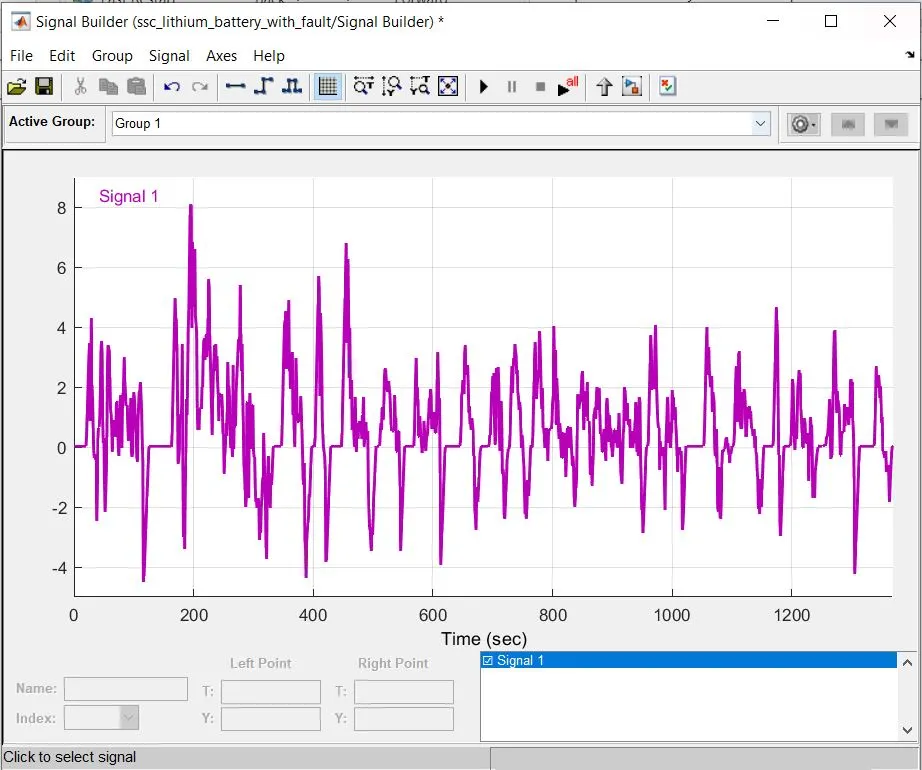
The negative and positive current indicates the current drawn from the battery and current drawn into the battery.
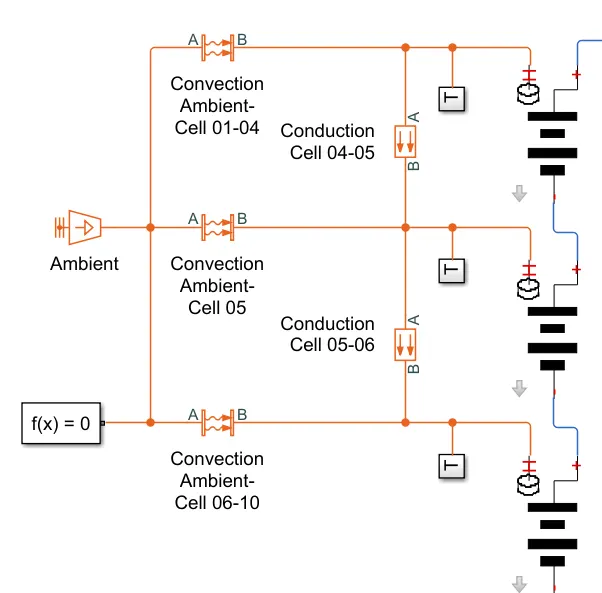
The orange lines are the thermal connections connecting thermal blocks in the model. There is convection implementing block between the surrounding and the cells. A conduction block is also used to carry out the calculation of heat travelled between cells due to conductioon. Ambient temperature source is used to cool the battery. Temperature measuring block is also used to sense the temperature of each cell in order to manage the heat in the battery by sending these measures to the BMS.
Results:
The aim was to see the change in the cell performance due to change in temperature. According to the model, there are ten cells in series from which 5th cell is faulty, meaning it has more temprature than others. The open circuit voltage and capacity is low, whereas the internal and terminal resistance is high. These all factors have resulted in the followig plot.
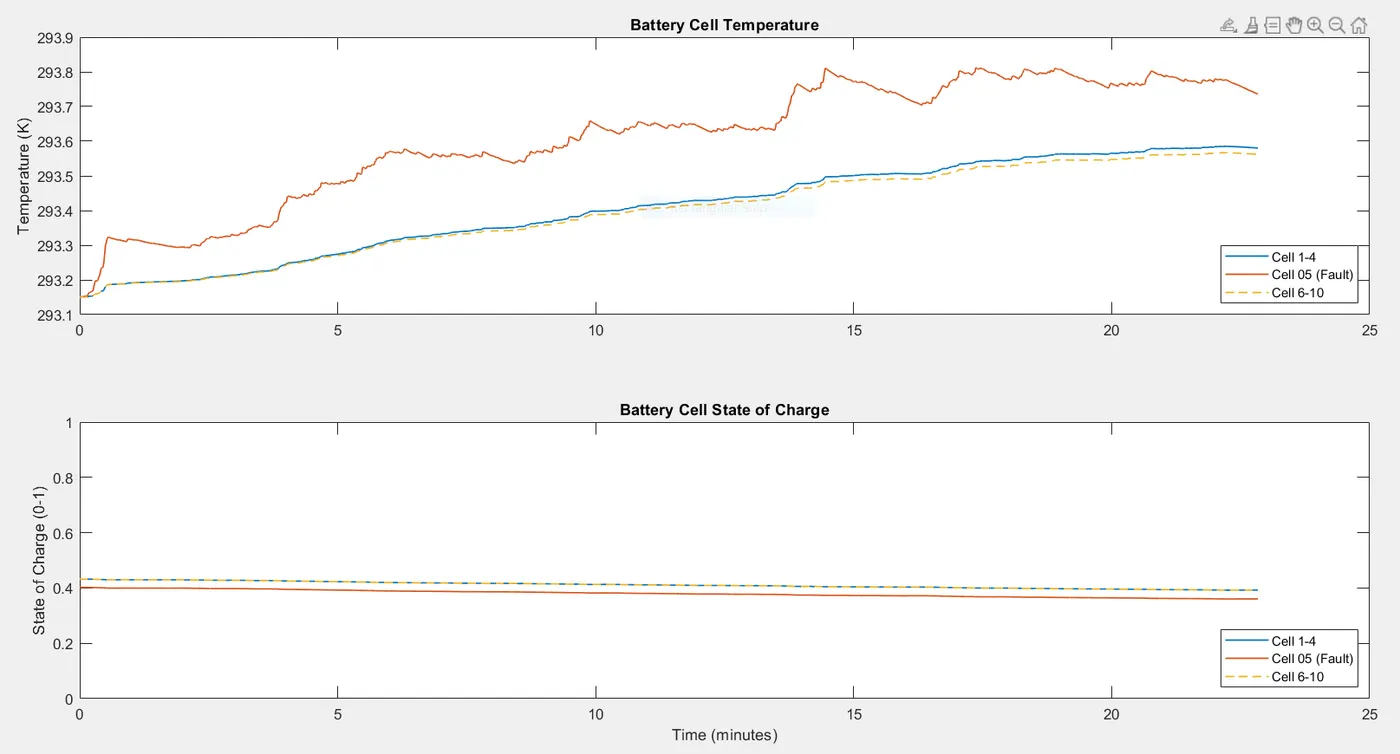
From the plot we get SOC and temperature of the cells w.r.t. time for a given drive data.
It can be seen from the first plot of temperature that cell 5 has higher temperature than all other cells. The initial temperature of all cells is 293.1 K. With ongoing driving condition for 22 minutes approxly, faulty cell temperature rises to 293.8K and other cells to 293.6K. The rate of rise and fall in the temperature of the 5th cell is high which states that it is highly unstable.
Higher temperature in any cell is not desired as it may increase the temperature on the surrounding cells. The SOC of the fault cell is less than the other cells. Starting from 40% the fault cell reduced to 35% in 22 minutes. All other cells from 45% state of charge, came down to 40%. This causes imbalance between cells and results in reduced life of the battery and deteriorates the performance.
Conclusion: A model for 10 lithium ion cells in series was created and simulated successfully. The change in temperature of a single cell reduces the performance of the battery. Varriance in the OCV also reduces the current drawing capacity and the temperature increases. The other main reason of the rise in temperature is the increased resistance, internal as well as terminal. Hence, thermal effects are simulated on a 10 cell series lithium ion battery.