Project 2 - Supply and Demand Gap Analysis
Supply and Demand Gap Analysis
Dataset link: https://www.kaggle.com/datasets/ksr102631/sigmacabprediction/data
Aim:
The aim of this project analyses the trend of Supply and Demand Gap Analysis of Sigma Cab Services and determine the effectiveness of cab for different distance, rating & pricing.
Introduction:
The main objective is to analyse the cab details and customer details so that we can able to understand what types of cabs are mostly preferred by customer by that we can introduce that type of cabs in large numbers for future so that we can be more profitable.
Problem Statement:
- We have analysed the sum of cancellation last 1 month and sum of customers across months.
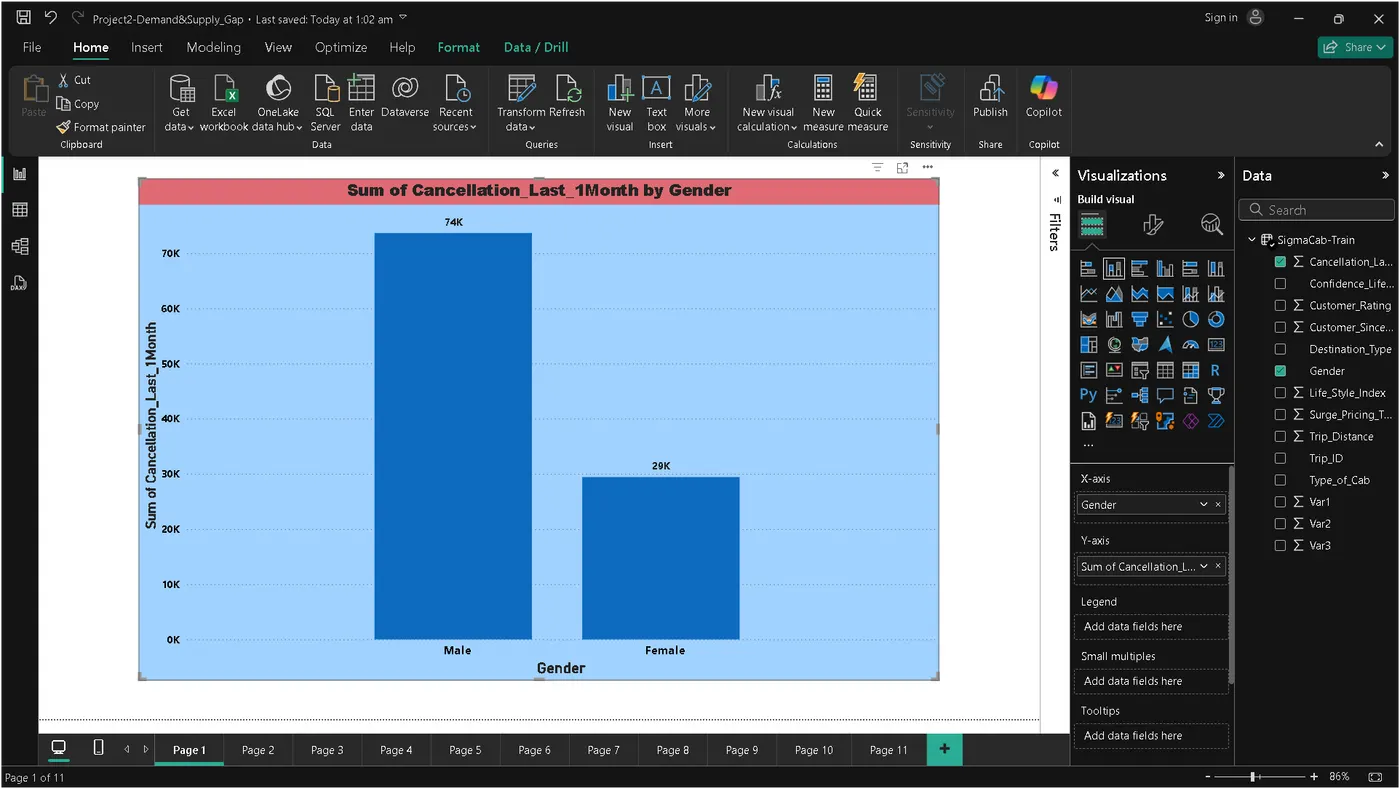
- We have analysed the cancellation records according to the gender.
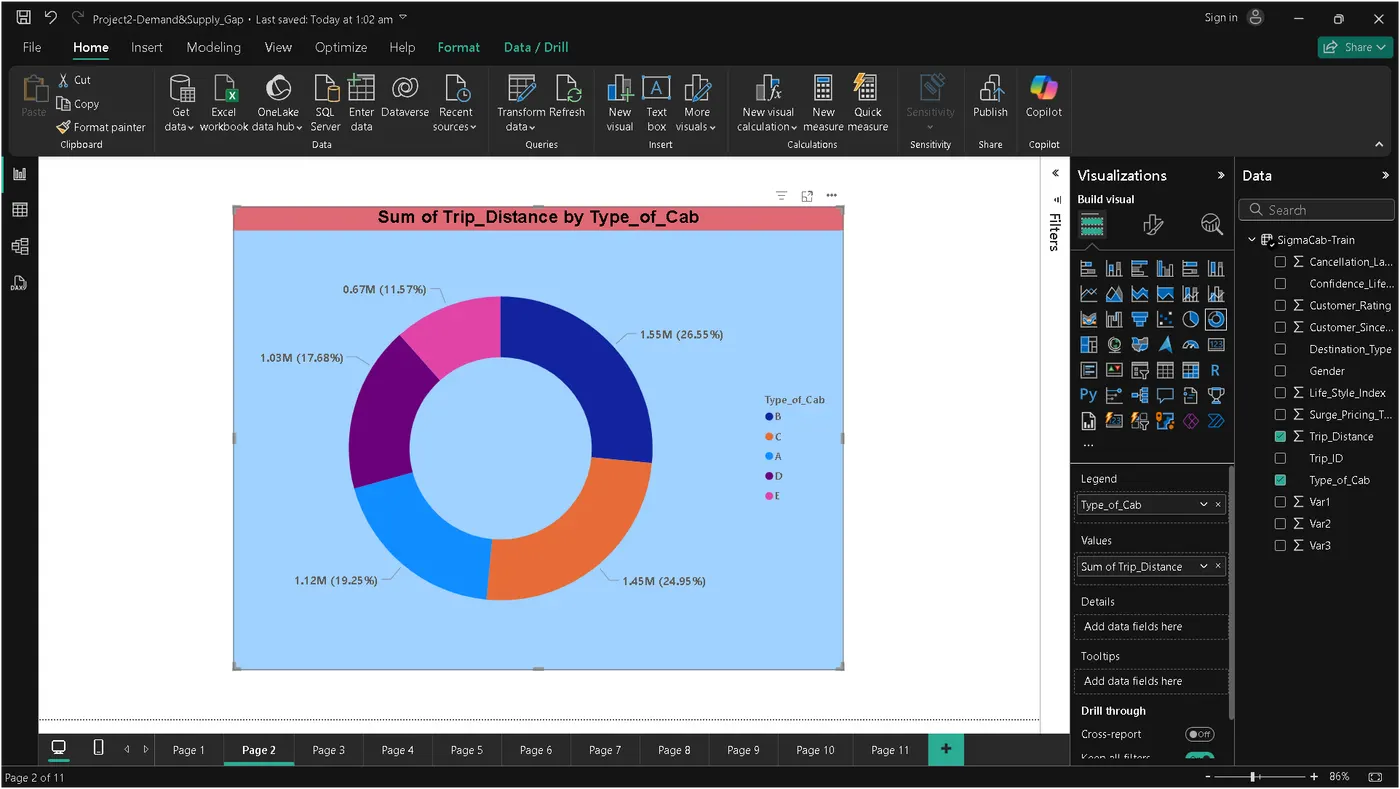
- We have analysed the trip distance according to the different types of cabs.
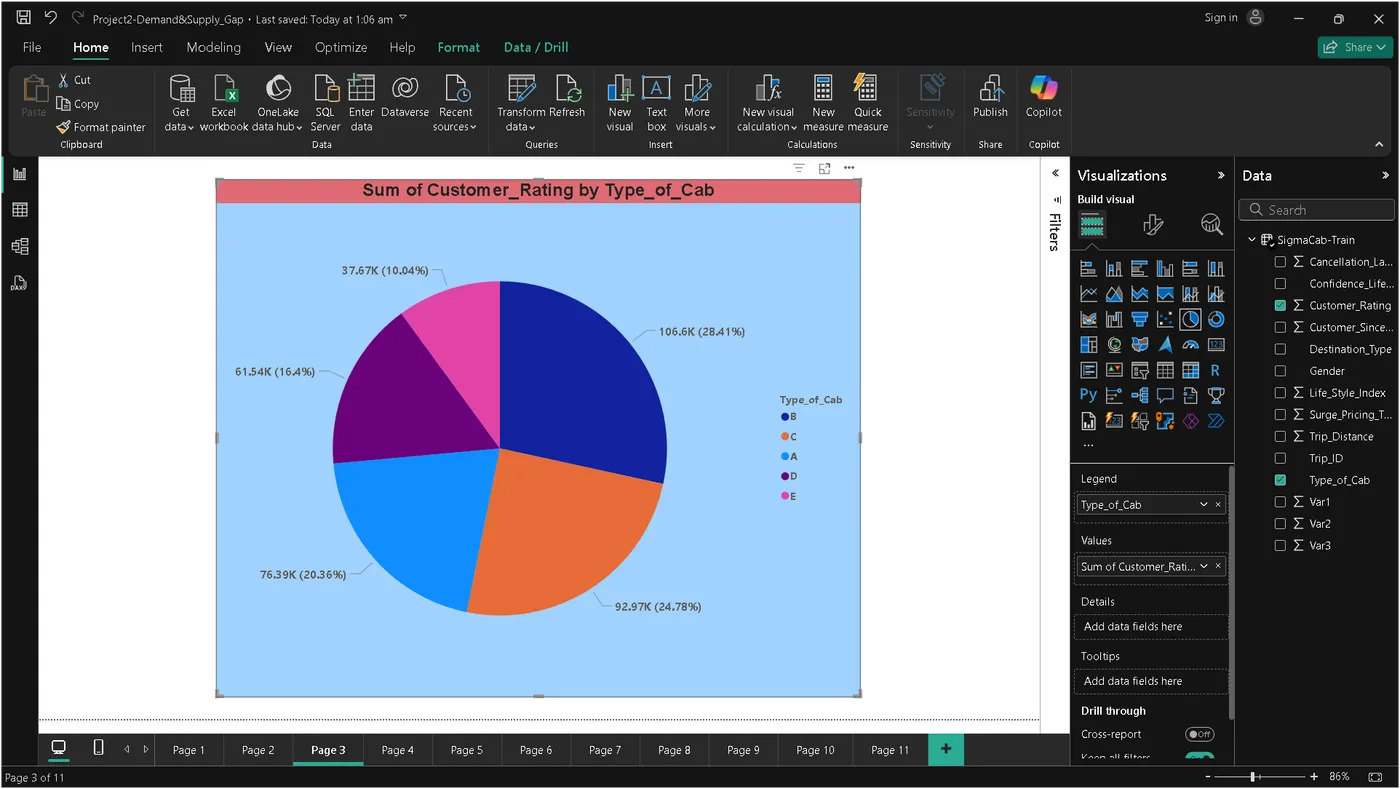
- We have analysed the customer rating according to the different types of cabs.
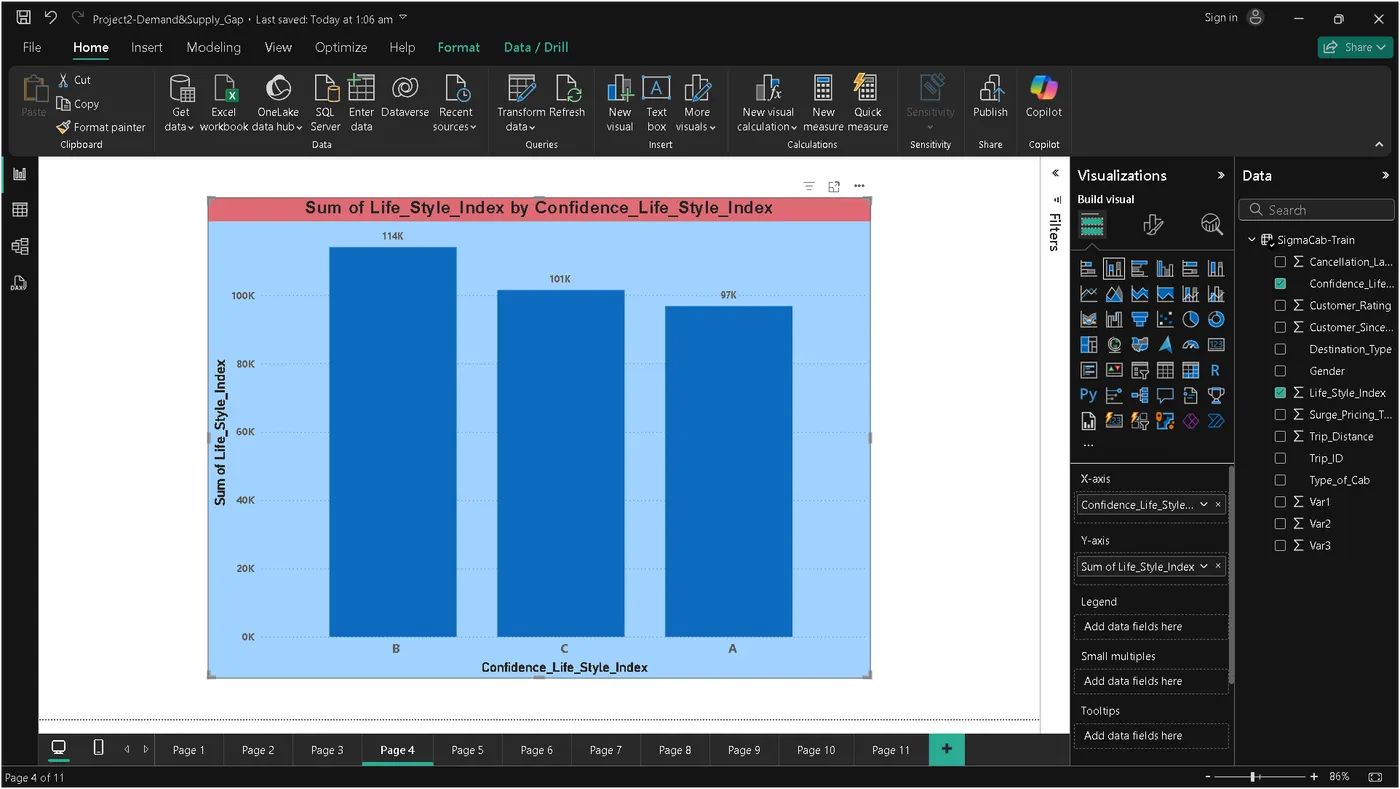
- We have analysed the life style index according to the confidence life style index.
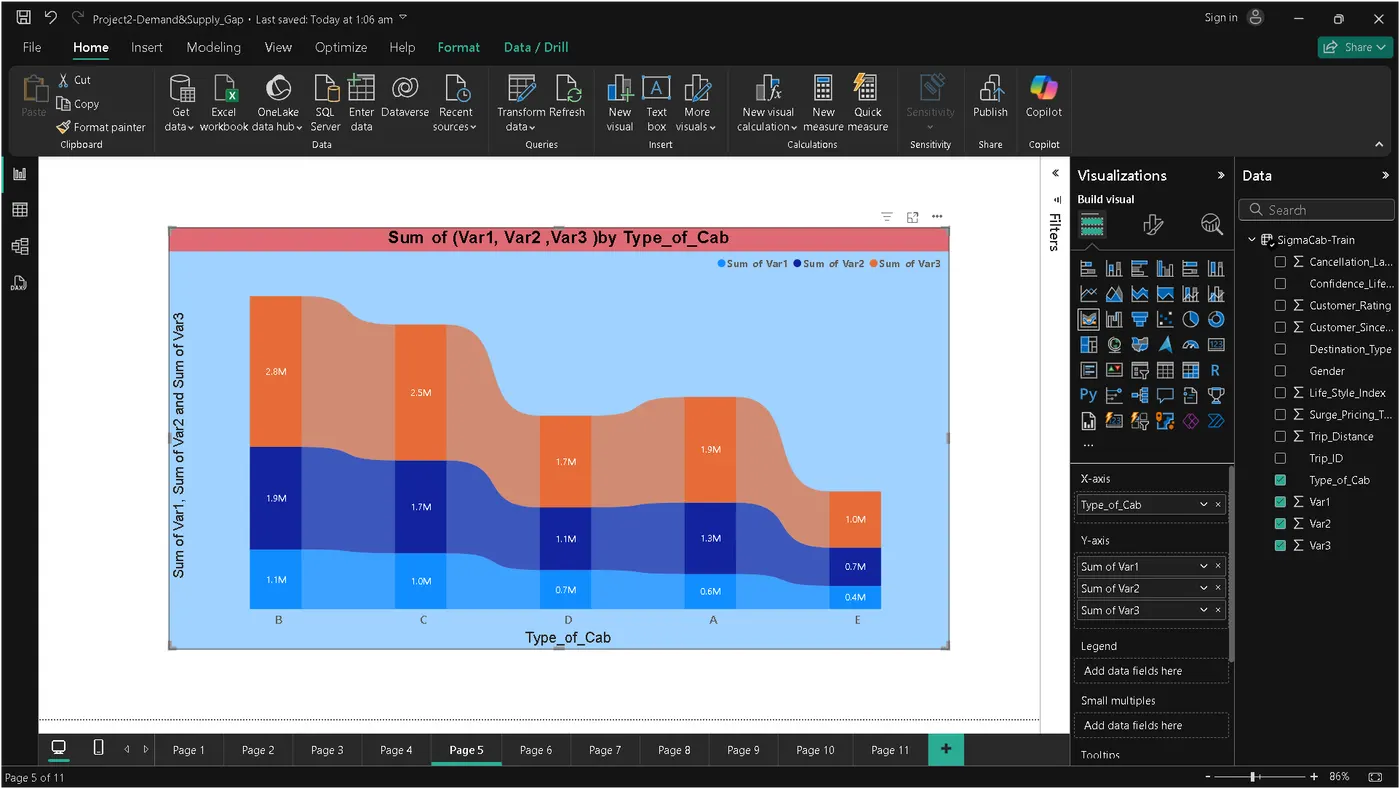
- We have analysed the sum of all three variables according to the different types of cabs.
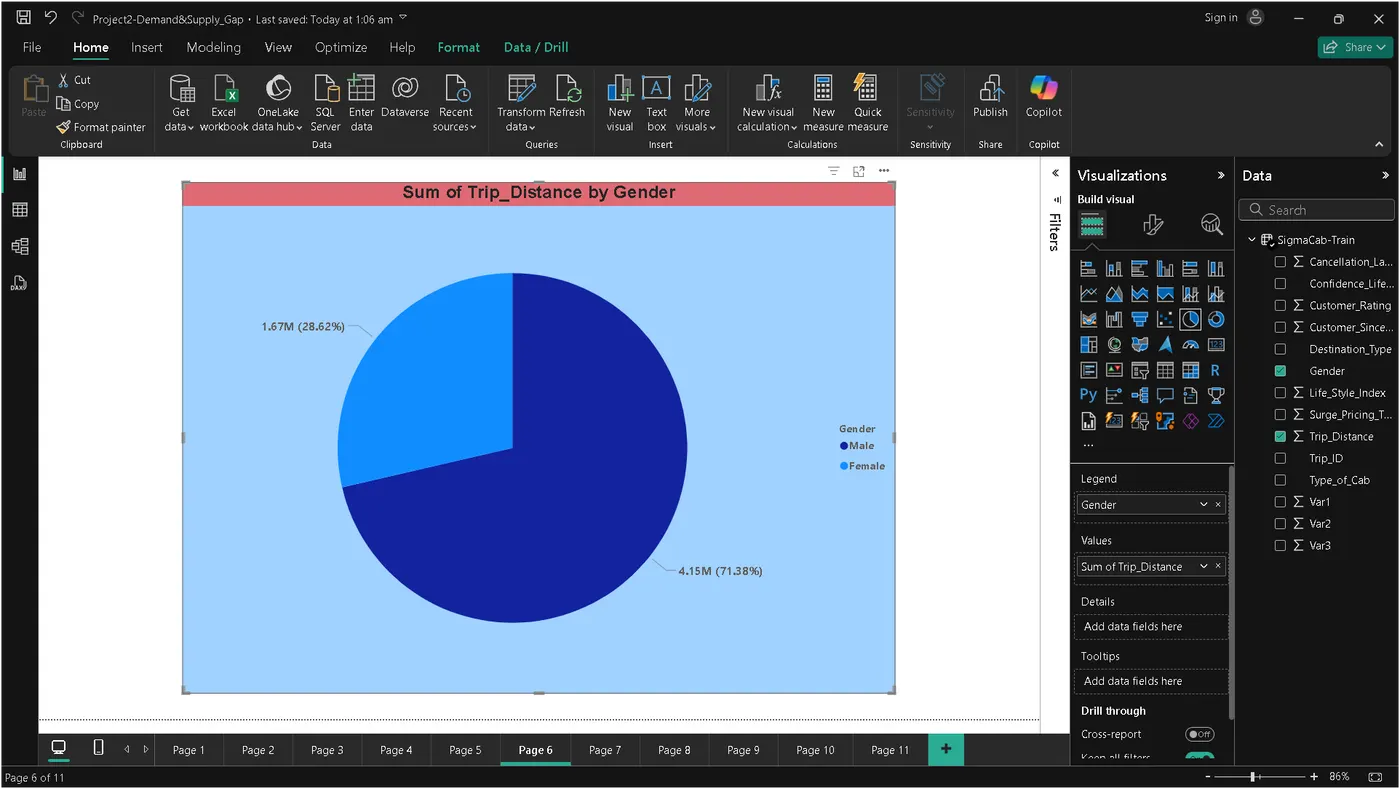
- We have analysed the total trip distance according to the gender.
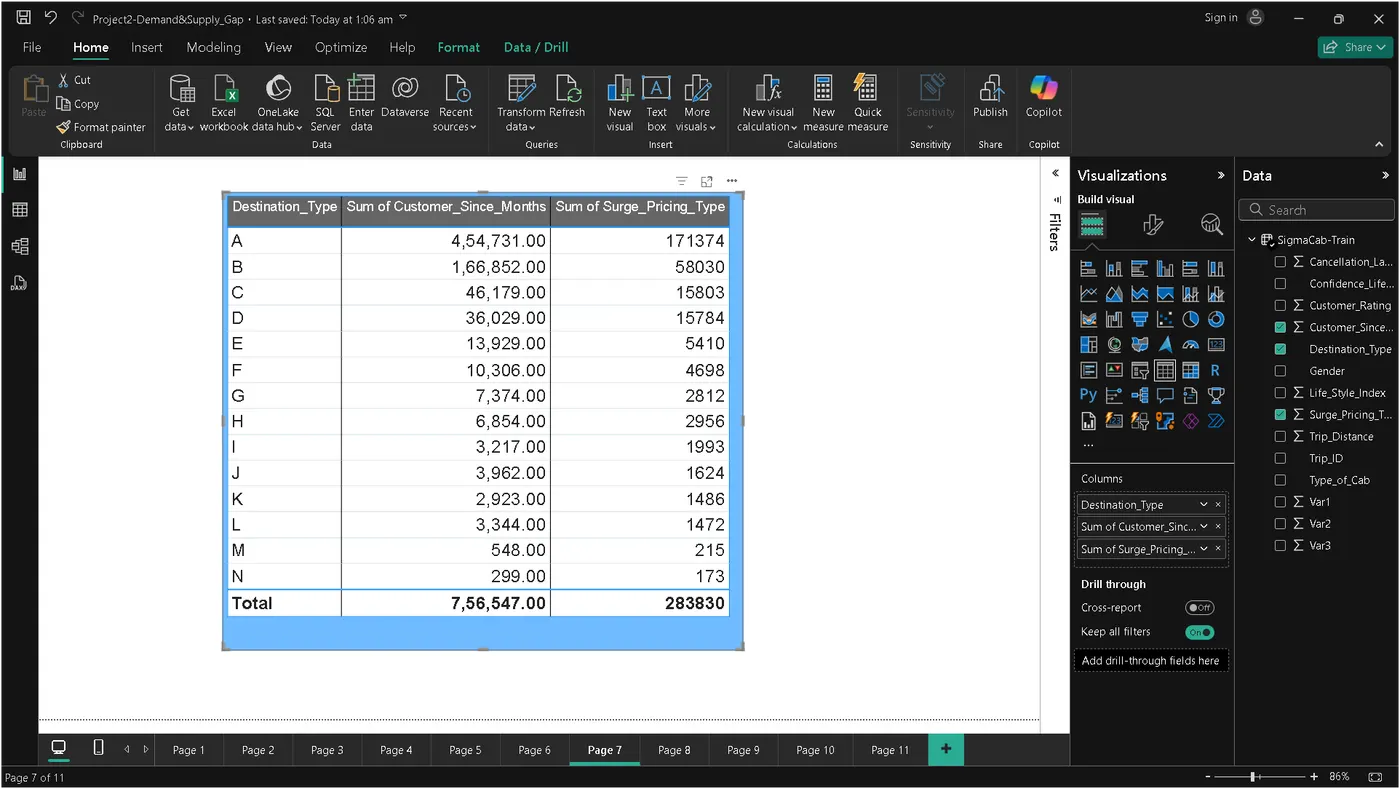
- We have analysed the customer across months and surge pricing type according to destination type.
- We have analysed the cancellation last 1 month and sum of customers across months according to cab type.
- We have analysed the customer across months according to gender.
- We have analysed the sum of all three variables according to gender.
Methodology:
The dataset contains information for the random period.
Step 1: Data Importing
In power BI desktop with the help of the get data option, import the CSV data which is named as SigmaCabs and click load option.
Step 2: Data Cleaning
After loading the data and after analysing the data I understood that there are 131662 rows and 14 columns. And in that some of the numerical columns contained null values I have replaced the null values by 0 with the use of replace functions and some categorical columns contained blank so filled it with fill down function, and then started working on the data.
Step 3: Data Visualization
In visualization part with the help of power BI desktop software I have used different kinds of charts, graphs, cards and table to display the data in the format which will be easy to understand.
Report View:
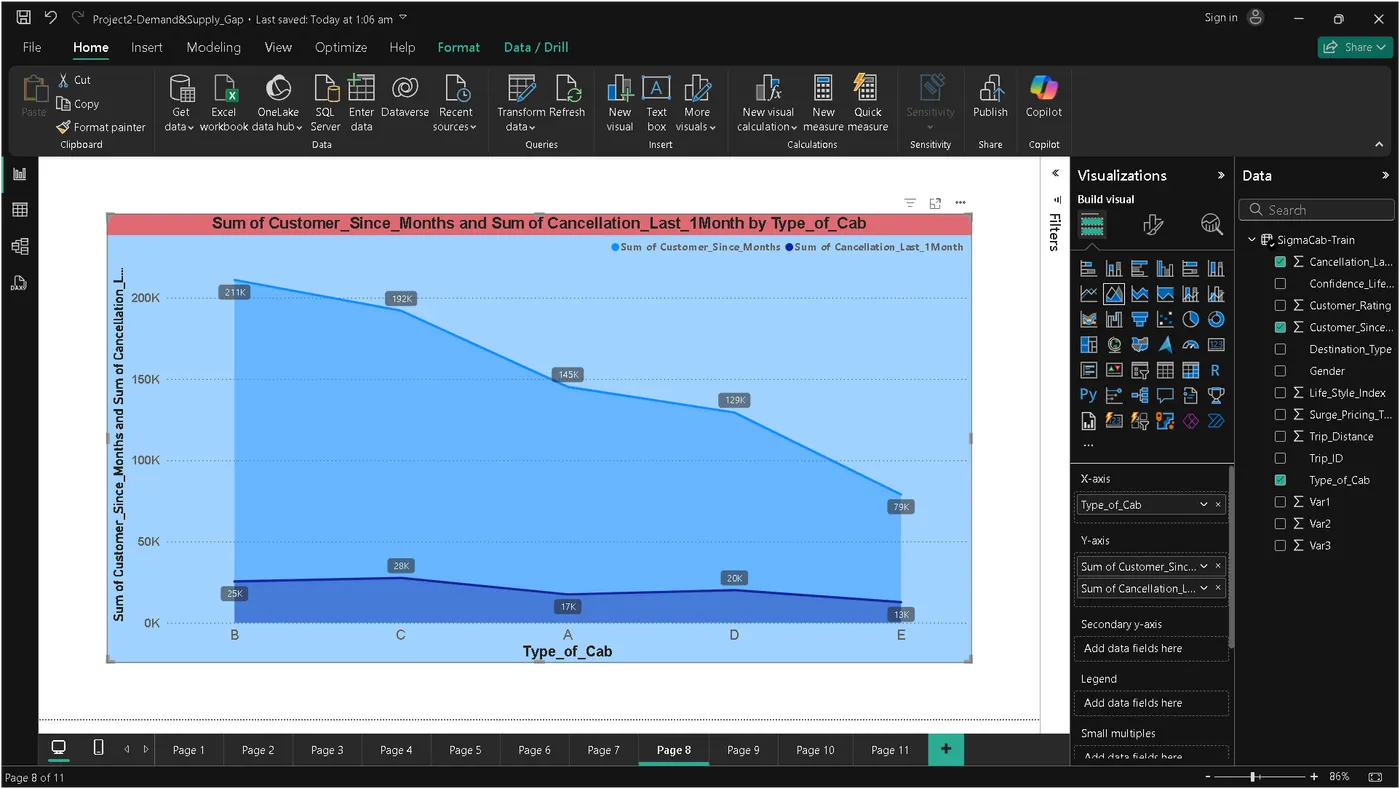
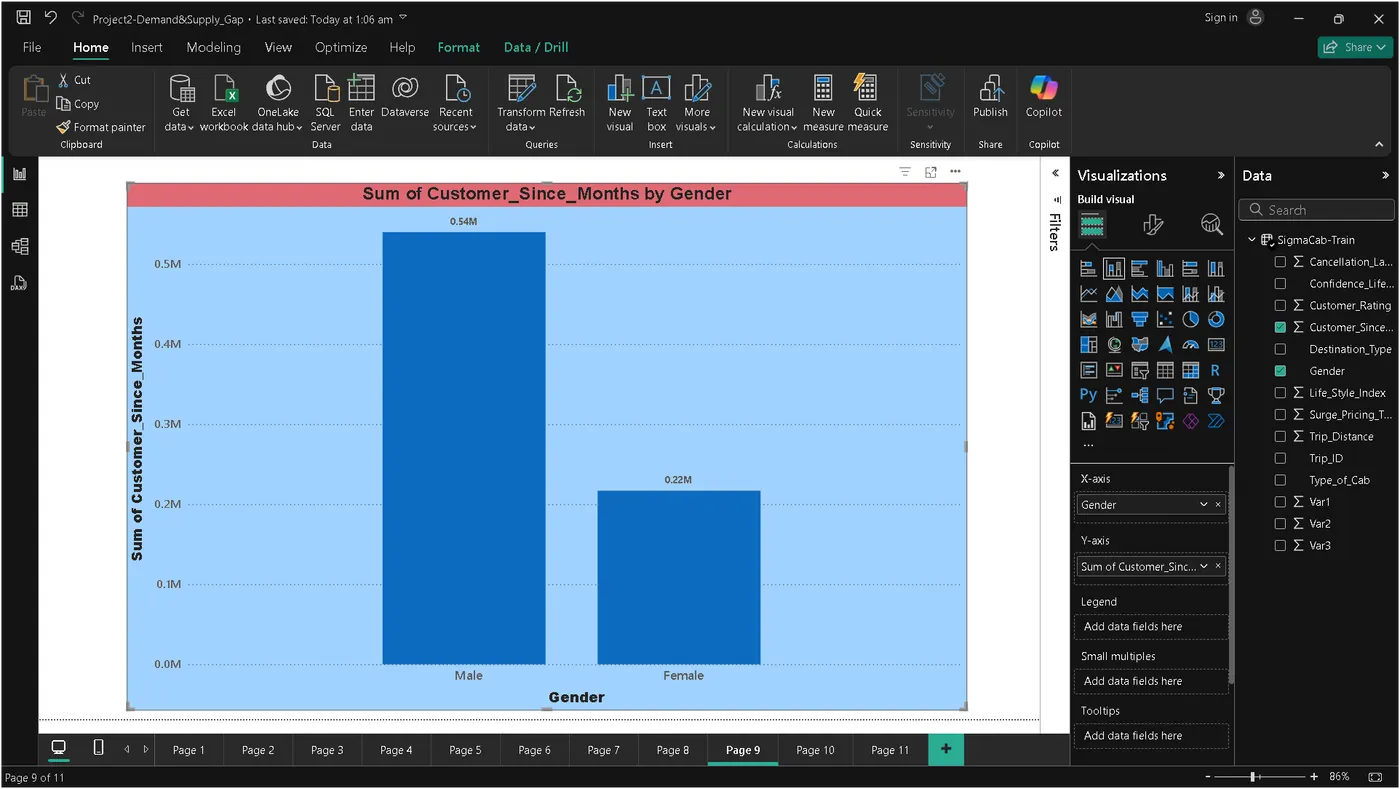
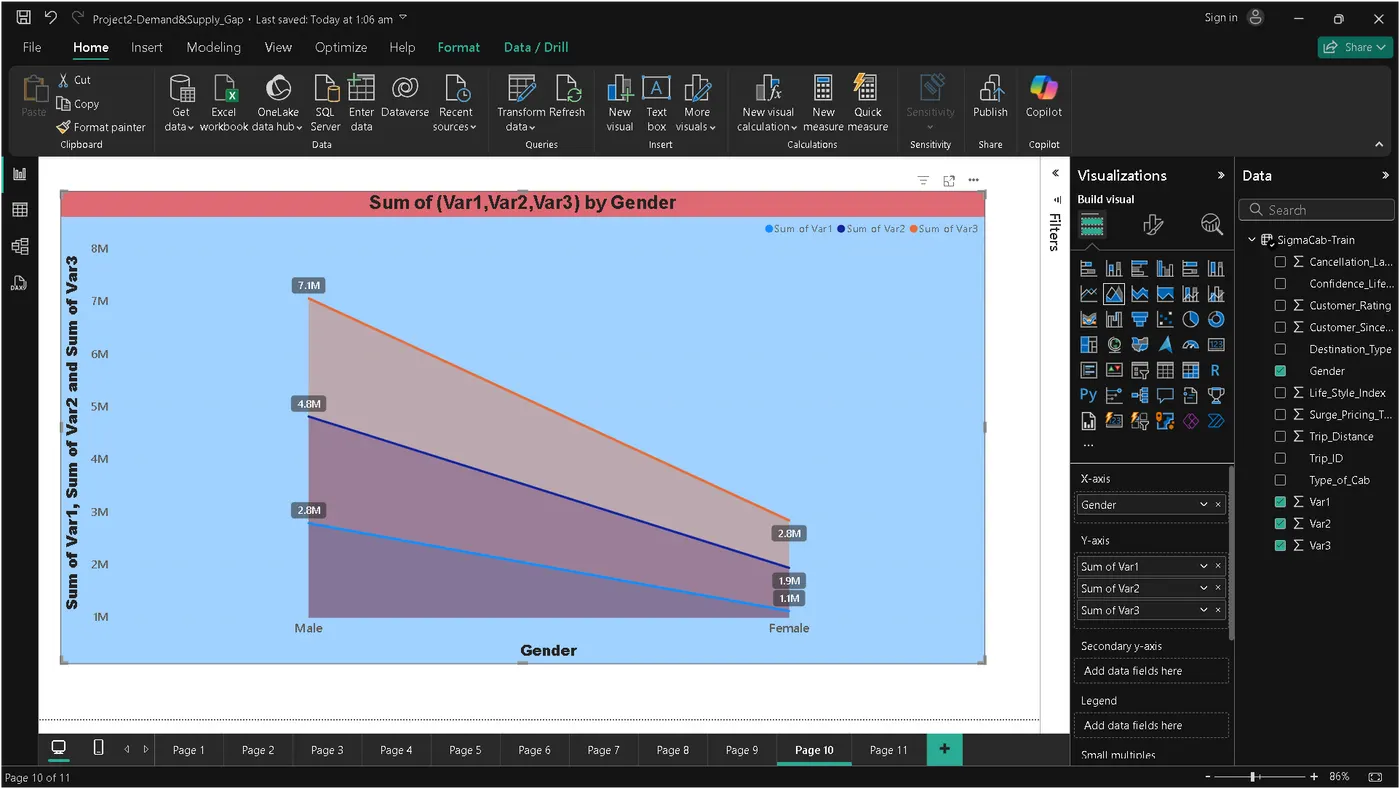
Analyses
- Trip_ID:-Unique identifier for each trip, serving as a primary key to distinguish each record in the dataset.
- Trip_Distance:- The total distance travelled during the trip, likely in kilometers or miles.
- Type_of_Cab:- Category or type of cab chosen for the trip, such as economy, standard, or premium. Different letters (A, B, C, etc.) may represent different service levels or cab types.
- Customer_Since_Months:-The duration (in months) since the customer first used the service. A low value suggests a new customer, while higher values indicate a more loyal or longstanding customer.
- Life_Style_Index:- A score indicating a customer's lifestyle segmentation, possibly based on spending habits, preferences, or other demographic indicators. Higher values could reflect a premium lifestyle preference.
- Confidence_Life_Style_Index:- Ordinal rating (A, B, C) representing the confidence or certainty level in the calculated Life_Style_Index. "B" may signify high confidence, while "A" might indicate lower confidence in the index's accuracy.
- Destination_Type:- Category of the trip destination, which could relate to the nature of the location (e.g., residential, business, recreational) or trip purpose.
- Customer_Rating:- The customer's rating for the trip experience, likely on a scale from 1 to 5, where 5 is the highest satisfaction.
- Cancellation_Last_1Month:- The number of times the customer has cancelled trips within the last month, providing insight into reliability or satisfaction with the service.
- Var1:- An auxiliary metric, possibly linked to customer behaviour or preferences, such as engagement or loyalty scores, specific to segments of the customer base.
- Var2:- A metric or score related to trip-specific data or customer segmentation, potentially indicating classification or survey-related metrics.
- Var3:- Likely another auxiliary score, possibly related to customer characteristics or previous trip behaviours, providing additional segmentation information.
- Gender:- The gender of the customer, typically represented as "Male" or "Female".
- Surge_Pricing_Type:- An indicator of surge pricing, with values likely corresponding to different surge levels (1 = no surge, 2 = moderate surge, 3 = high surge), reflecting demand-driven pricing adjustments.
Insights:
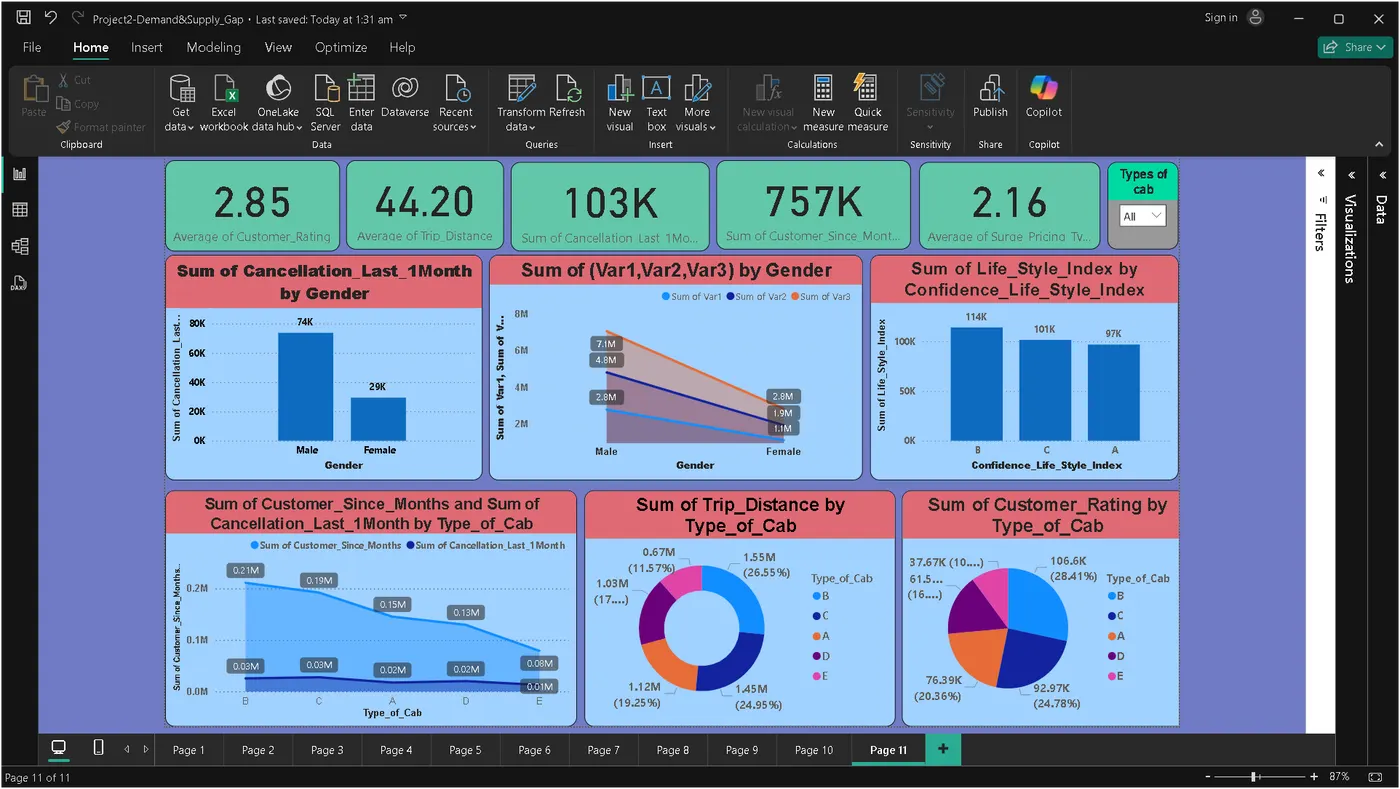
- Here we have analysed the average trip distance and average customer rating so that we able to calculate what will be average distance that the customer wants to travel and by average customer rating we can able to find our service satisfaction so that we can improve for future.
- And also analysed the customer rating and trip distance according to type of cab so that we can able to understand which type of cab is preferred by people.
- And also analysed the no. of customer details and cancellation details according by gender so that we can able to understand which gender is using the cab facilities more frequently.
- And also analysed which is the most frequently selected destination type and so that we can able to understand which destination needs more cabs.
Recommendations:
- From the above analyses we can able to find that B type of cab is mostly used cab by distance and it’s also highly rated by customer rating so it will be good to launch B type of cabs more frequently in future so that profit will be increased.
- And also, we came to know that male customers use cab services more often, so if we do advertisements more frequently means there also will be chance of getting more female customers.
- And destination type A is most preferred destination followed by destination type B and C so having more cabs for that destination will increase profit.
Conclusions:
From the above analysis we are able to know that we have to do some changes for that if we follow the above recommendations by doing continuous improvisation, we will more successful in future.