Project 2 - Supply and Demand Gap Analysis
Supply and Demand Gap Analysis-Uber
Aim
The aim of this project is to conduct a Supply and Demand Gap Analysis using the Uber Supply-Demand Gap EDA dataset. The goal is to identify and understand the discrepancies between the demand for Uber services and the supply of available drivers. The insights gained will assist in making informed strategic decisions to optimize service efficiency and customer satisfaction.
Introduction
Uber, a leading ride-sharing platform, faces challenges in balancing the supply of drivers with the dynamic demand for its services. This project aims to delve into the dataset, analyze key metrics, and provide actionable insights to address the gaps between demand and supply.
Problem Statement
The primary challenges include addressing instances of unmet demand, optimizing driver allocation, and mitigating factors contributing to cancellations. By understanding the dynamics of supply and demand, Uber can enhance operational efficiency and deliver a better user experience.
Methodology
The methodology involves exploratory data analysis (EDA) using Power BI. The Uber Supply-Demand Gap EDA dataset will be cleaned, transformed, and analyzed. Key metrics such as completion rates, cancellation rates, and driver performance will be assessed. Geospatial and temporal analyses will be employed to uncover patterns and trends.
Analysis
The following analyses have been conducted:
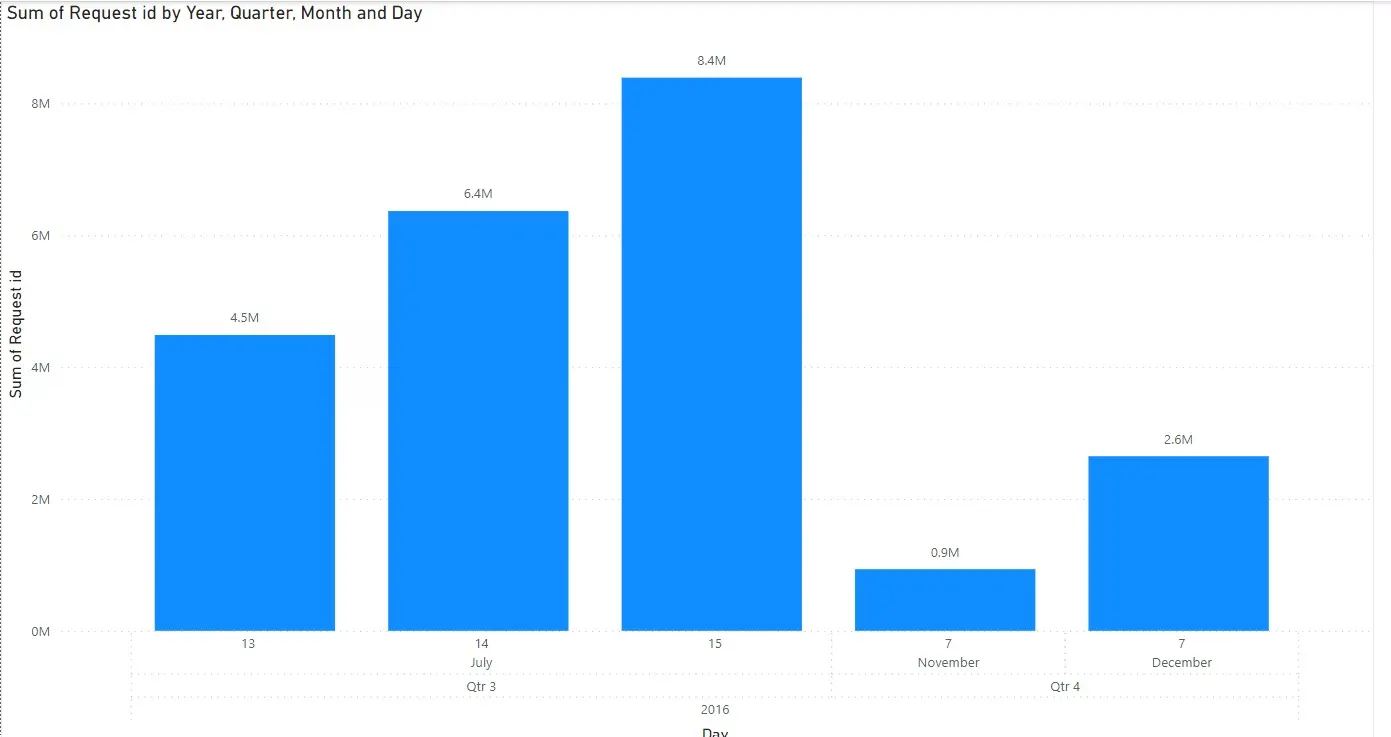
Sum of Request id by Year, Quarter, Month, and Day:
Explore temporal demand patterns to identify seasonal trends and variations.
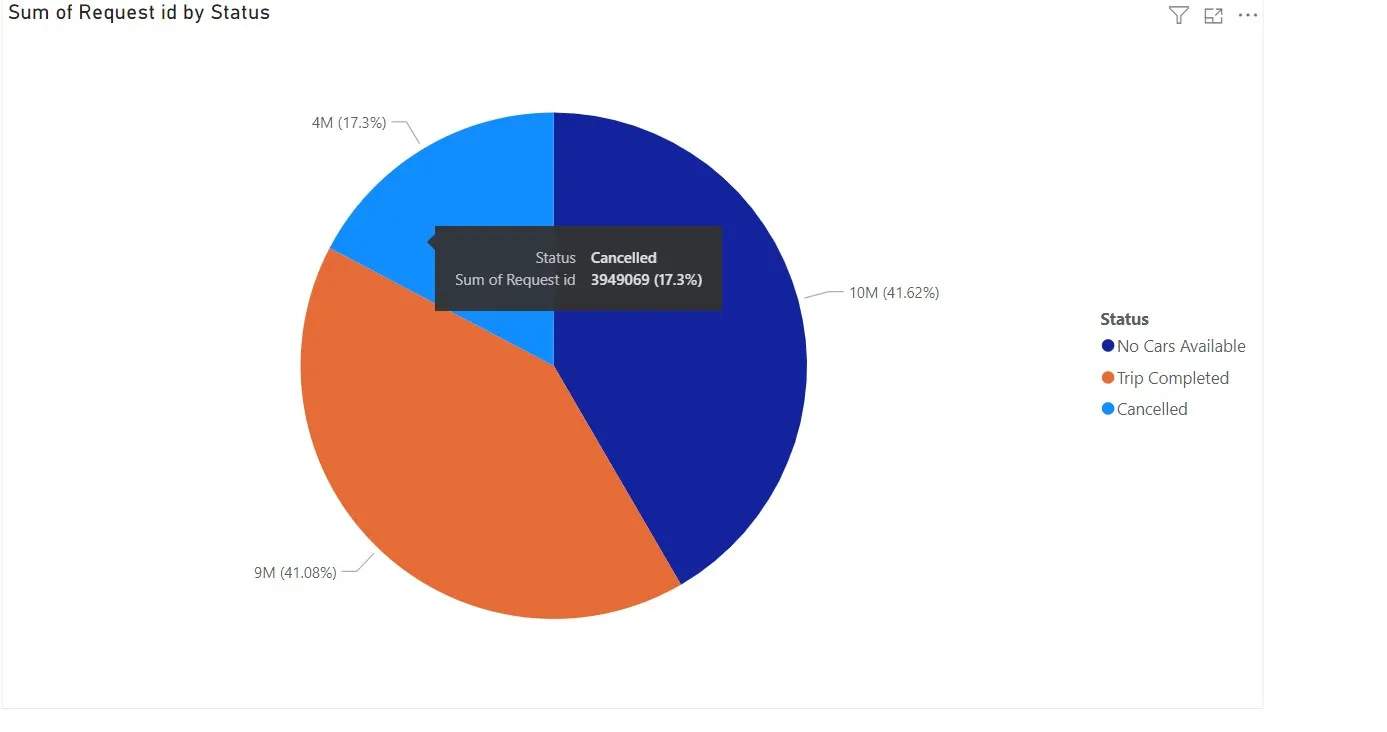
Sum of Request id by Status:
Analyze the distribution of requests based on different status categories ("No Cars Available," "Trip Completed," "Cancelled").
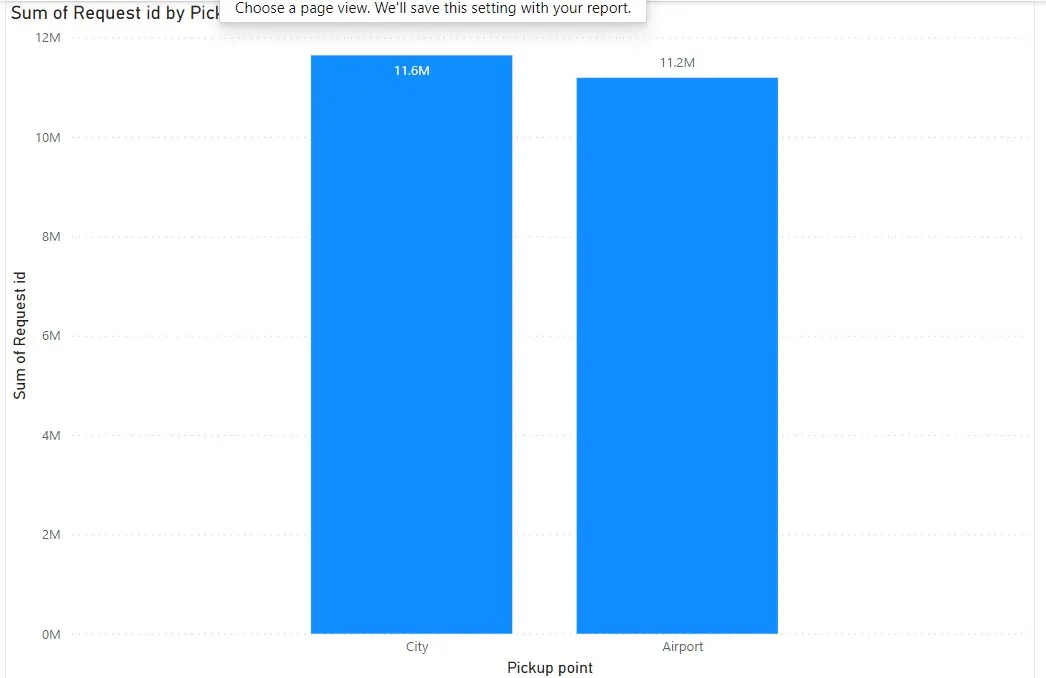
Sum of Request id by Pickup point:
Examine demand from different pickup points to understand distribution across locations.
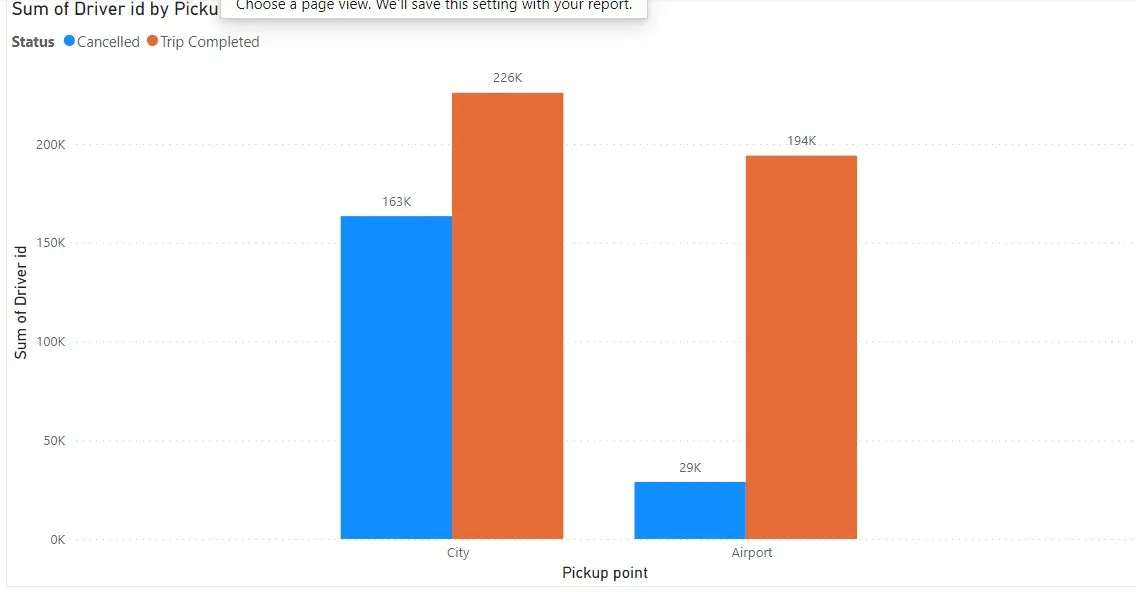
Sum of Driver id by Pickup point and Status:
Evaluate driver availability and performance based on pickup points and status categories.
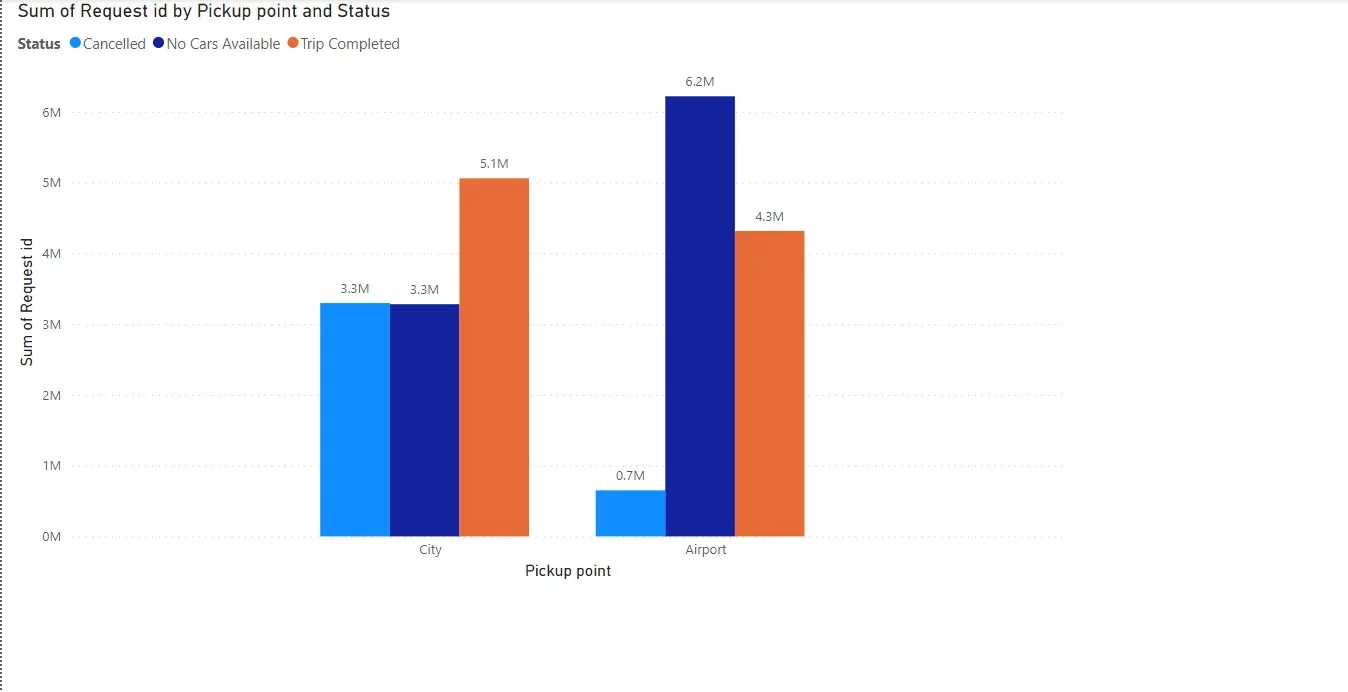
Sum of Request id by Pickup point and Status:
Analyze demand dynamics by examining the interaction between pickup points and status categories.
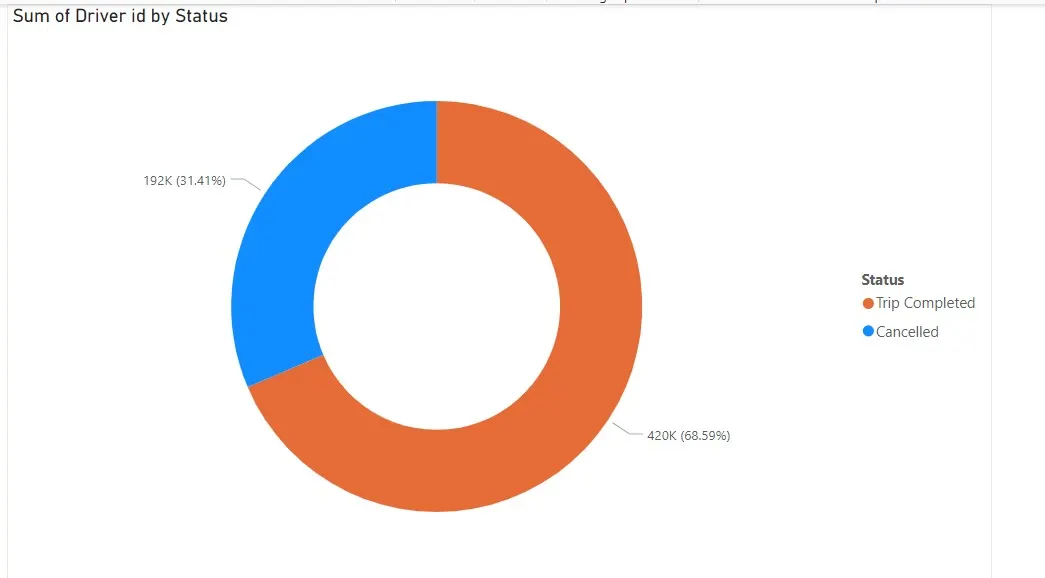
Sum of Driver id by Status:
Evaluate overall driver performance and availability across different status categories.
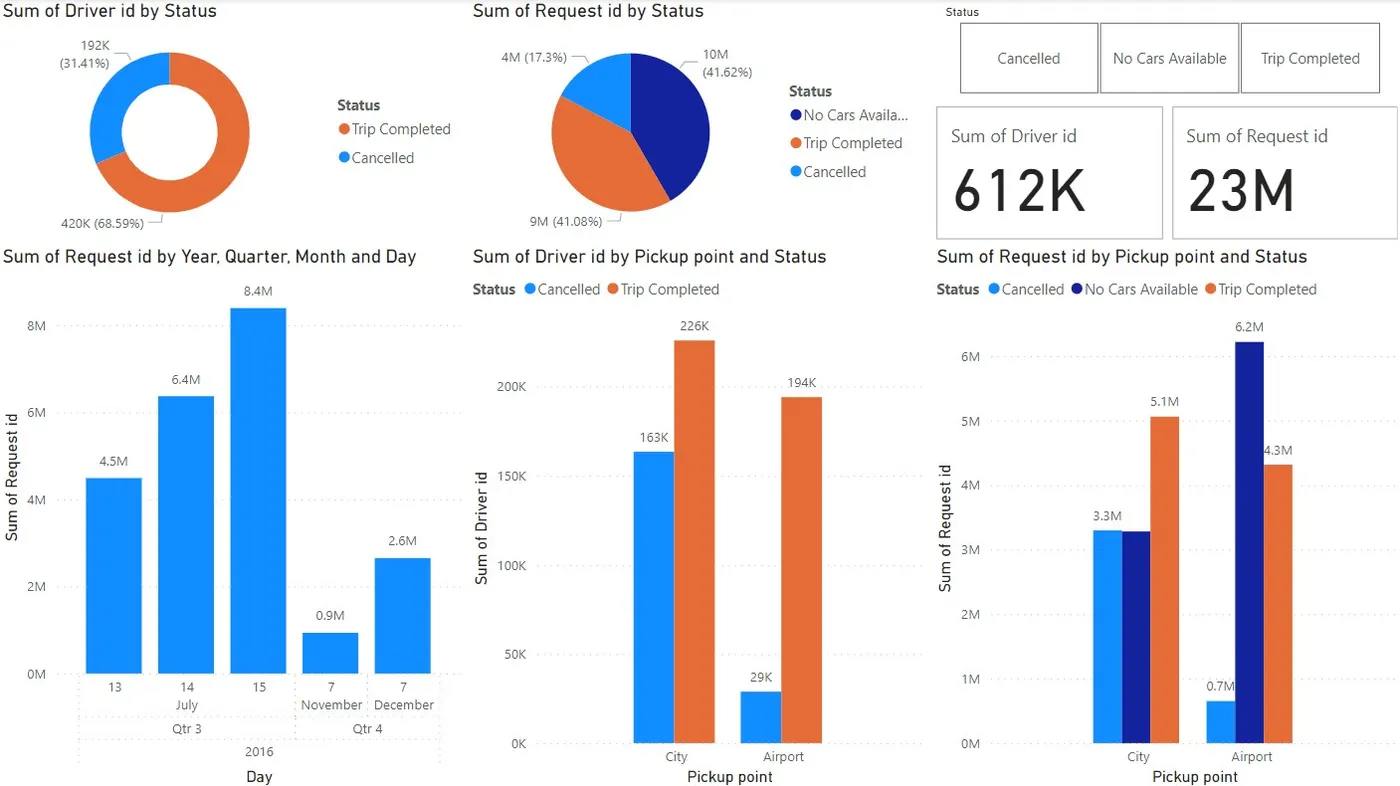
Dashboard showing Supply and Demand Gap Analysis of Uber
Insights
Based on the analyses, the following insights have been derived:
· Temporal demand patterns reveal peak periods, aiding in resource allocation.
· "No Cars Available" status is prominent, indicating potential service availability challenges.
· Pickup points exhibit varying demand levels, offering insights for targeted service improvements.
· Challenges in driver availability are identified in specific pickup points and status categories.
Recommendations
In light of the insights, the following recommendations are proposed:
· Optimizing Driver Allocation: Implement dynamic driver allocation strategies based on demand patterns and pickup point insights.
· Service Coverage Improvement: Expand service coverage in pickup points with high demand to meet customer needs effectively.
· Cancellation Rate Mitigation: Implement measures to reduce cancellation rates, enhancing overall service reliability.
Conclusions
In conclusion, the project provides a comprehensive analysis of Uber's supply and demand dynamics. The insights and recommendations aim to guide strategic decisions for improving operational efficiency, optimizing driver allocation, and enhancing customer satisfaction.