Project 2 - Supply and Demand Gap Analysis
VENKATESH GOWDA M
POWER BI PROJECT-2
SUPPLY AND DEMAND GAP ANALYSIS OF HUMAN RESOURCES
Aim:
This project aim is Determine the supply and demand gap analysis of human resource data from Kaggle dataset by department wise salary and top 10 of late from last 30days by employee name.
Introduction:
The main aim of this project is analysis of the data from human resources data and take meaning full insights from the raw data give meaning-full suggestions.
Problem Statement:
Human Resource Data set is not cleaned, to make an effective Meaning Insights Charts and Dashboard.
From the given raw data set we are filtering data by department and citizen desc
The employes name late to the organization from past 30 days, Find out the maximum and minimum salary of Employee, Date of hire and date of termination based on sex field and Total absences.
Methodology:
Steps that followed through this analysis:
· Data Cleaning
· Data Interpretation
· Data visualization
Data cleaning and interpretation
While importing data set into power bi that I identified that the headers are not arranged in proper manner so i used first row as header option to make the data relevant. After that identified some of null values in the data set it has been replaced with zero/empty string/NA.
Thereafter the data set was ready for analysis.
Data Visualization:
In report canvas by using visualization tool, some of the visual charts, slicers and cards etc.
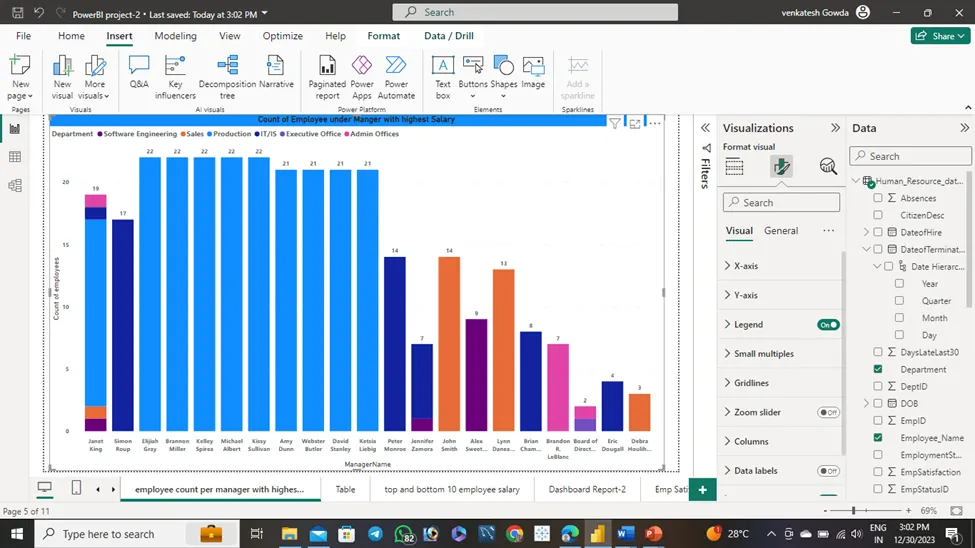
Count of Employees Under Manager and Managers Salaries
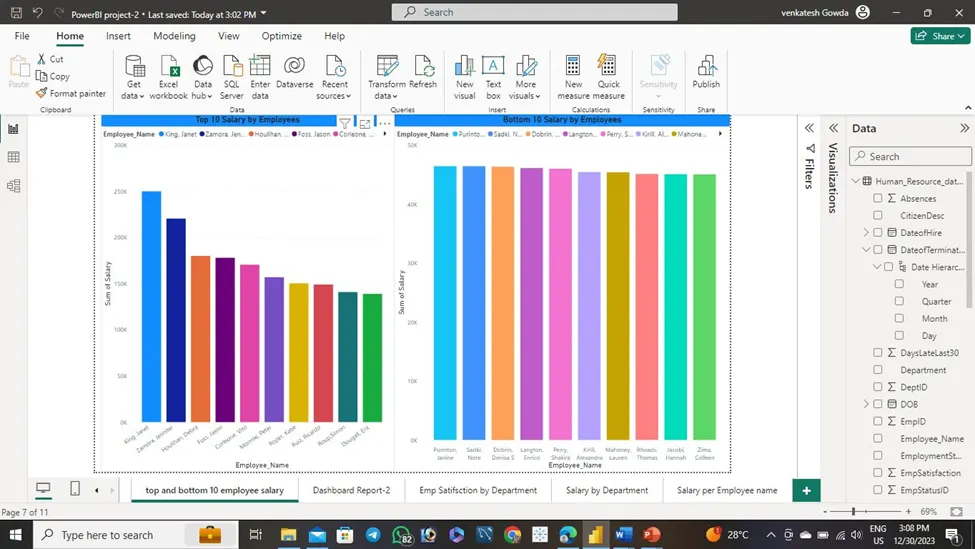
Top and Bottom 10 Salary per Employee
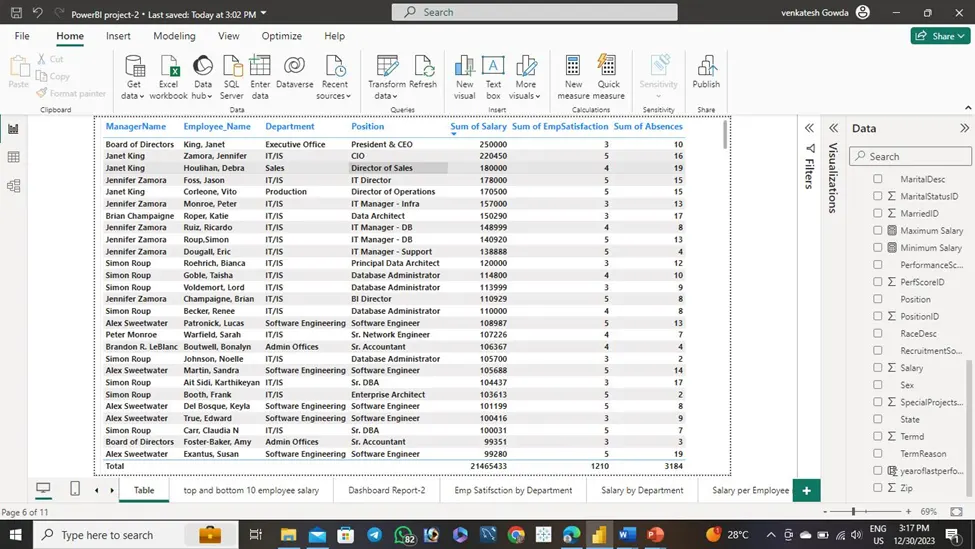
Employee with department and Position wise salary
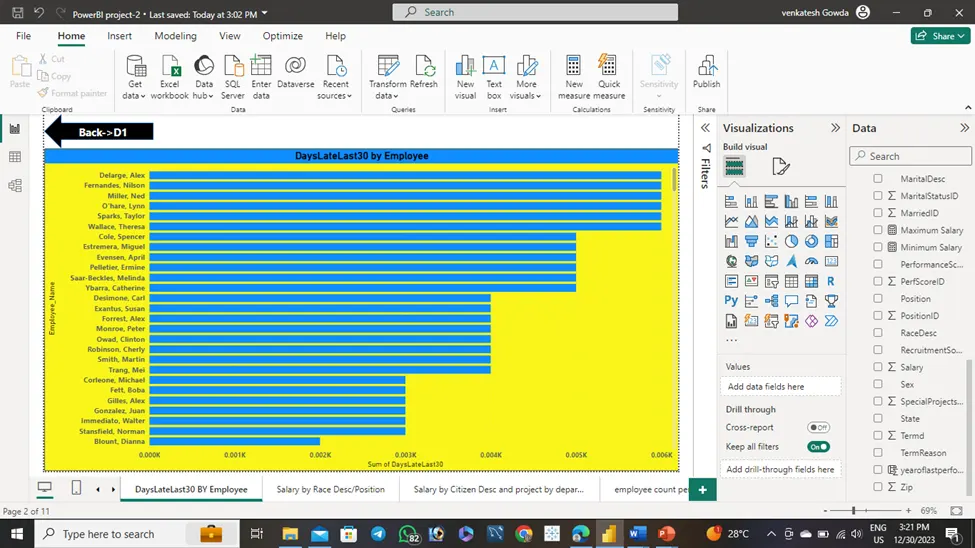
Employee Last late 30 Days
Analysis (Data sheets pertaining to it):-
In observation found some interesting points that are mentioned below.
· Dashboard 1 and 2 is Created on a Human Resource Dataset.
· According to data on Human Resource Dataset.
Dashboard -1
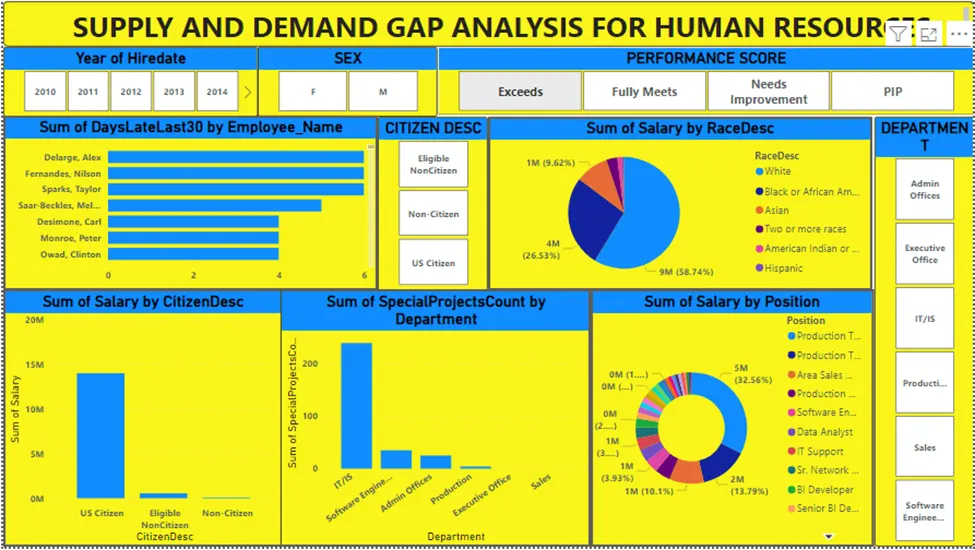
Dashboard-1
· The Total count of Last late 30 days per Employee in bar chart.
· Total Salary by the Citizen Desc in column chart.
· Total Special Projects Based on the Department in column chart.
· Total Salary by the Position with slicer of Department in pie Chart.
· Based on Individual Slicers or filter , we can select or Change the Categorical Values based on the individual Field.
Dashboard-2
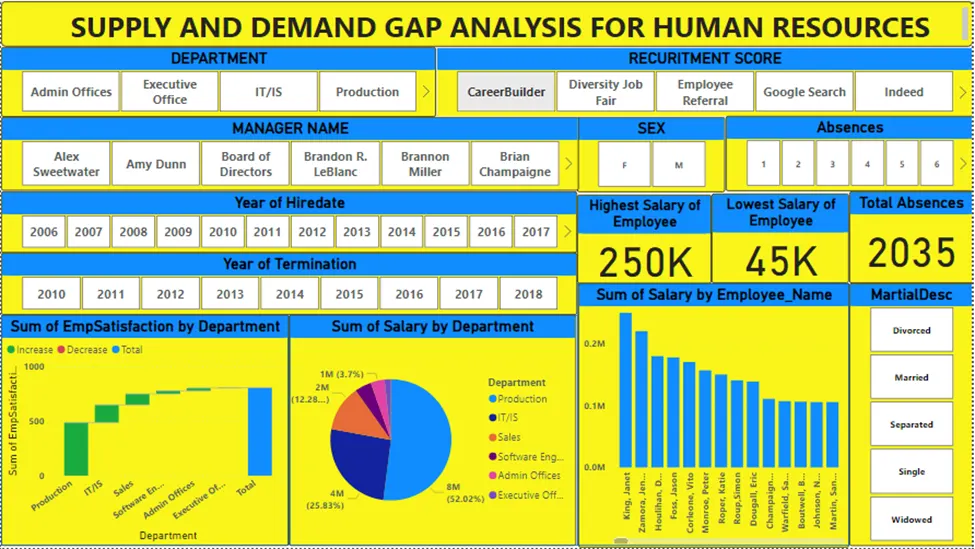
Dashboard-2
· The dataset is from Hire date and termination date of employee.
· Total Employee Satisfaction Wise Department.
· Total Salary Wise Department
· Total Maximum Salary based on Employee.
· Total Minimum Salary based on Employee.
· Total Absences.
· Individual slicers of department, Recruitment score, Manager Name, sex, Martial Desc, Absences, Hire date and Date of termination.
Insights: -In conclusion, we can look at the final Report for further analysis.
through department we can identify most people late to the organization and maximum salary that are taking each employee name.
and through Gender we are taking meaning full insights.
Recommendations: -
· By importing all countries list to the data, we can filter data from each country wise.
· After adding countries list, we can also filter data by region, city etc.
· By adding good amount of data set we can take more interactive reports and Charts from Data set.
· By adding the Total Absence per Employee and Leaves from the Organization.
Conclusion: -
In conclusion, we can look of final report of supply and demand gap analysis for human resources,
We can observe max salary by gender wise, performance score, hire date, date of termination and as well as department and citizen desc.