Project 2 - Supply and Demand Gap Analysis
Project 2 - Supply and Demand Gap Analysis
Aim:
The aim of this project is to find the gap between the organization and the consumer over demand and supply, that the organization is providing to the customer.
Here are we are using the data from a uber, where the customer booking cabs between Airport and city.
Introduction:
We got the travel details from the uber from Airport to city and city to airport in the year 2016, 5 days data.
Our objective is to find the gaps and improve them in future.
Problem statement:
Here we have analysed how many trips got completed and closed with no cars available and got cancelled.
How much time each trip took for the driver to complete.
Calculated the percent of status if the trips based on the pickup point. And which pick up point is getting more requests for pick up
Analysed the rate of change in the status of the trips that are getting completed, cancelled. Found total number if available drivers in the company.
Displayed on which days we got more completed trips, cancelled, no cars available for pickup.
Methodology:
Once the data is imported, we got 6 columns with request ID, driver ID pickup location, status of trip, booked and dropped date time.
Using the transform data option in the power Bi we have cleaned the data properly.
Using the add column and DAX formulas we have create one more column to get the total time taken to complete the trip.
Analysis:
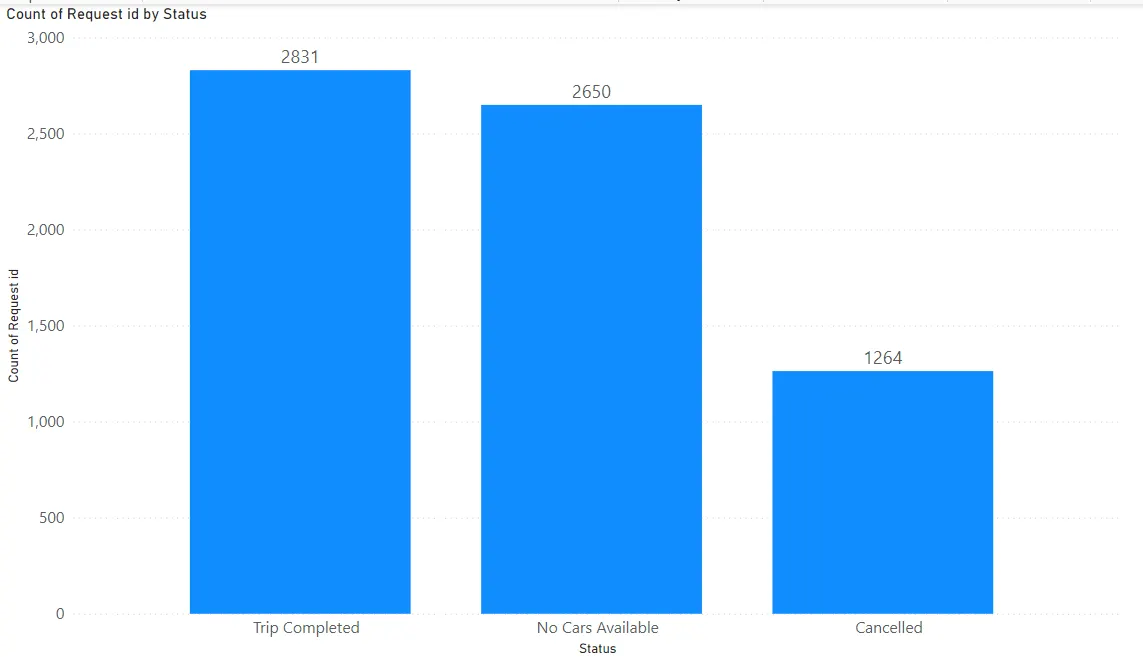
From the below graph we will get the details of how many trips got completed and how many got cancelled, on an overall in data there are a greater number of completed trips and almost equal cancelled trips because of no cars.
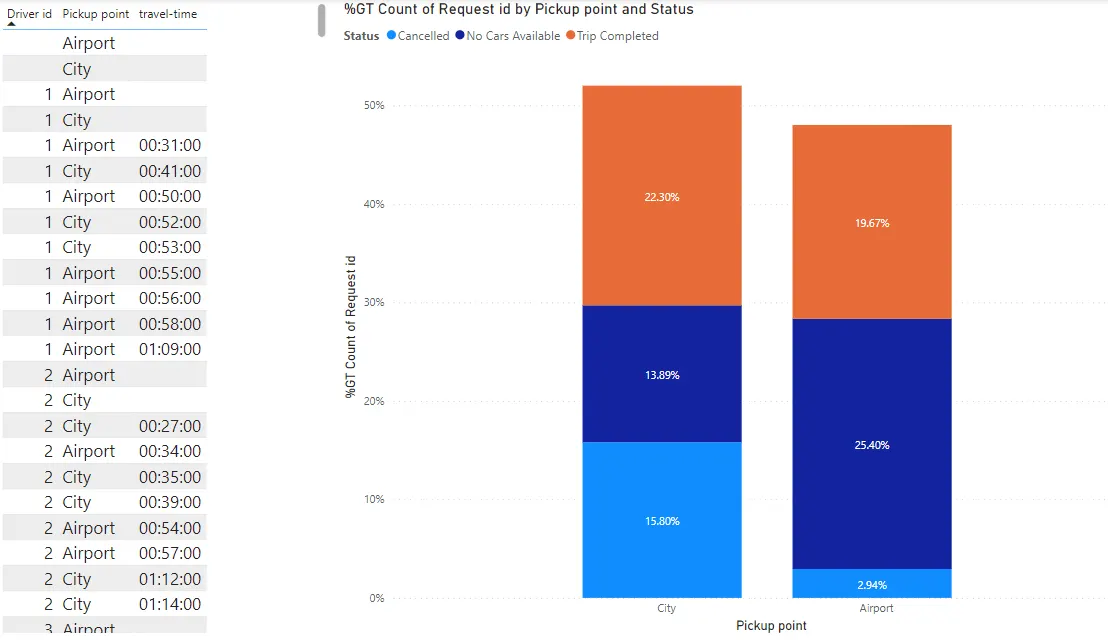
From the below viz we are having the information of how much time each trip took for the driver to complete, and the status of the trips based on pick up location, we can say that at airport we got more request which got cancelled because of less availability of the vehicles, and in the city, we observe more trips are getting cancelled after booking. In an overall peopled in the city is likely to travel more.
We have analysed that over the 5 days we can see there is a decrease in the availability of the cars to the customers and the trips are getting cancelled because of less availability. On a total of we have 300 drivers working and got around 6745 trip requests from those successfully completed trips we have only 2831 which is less than 50% of total trips
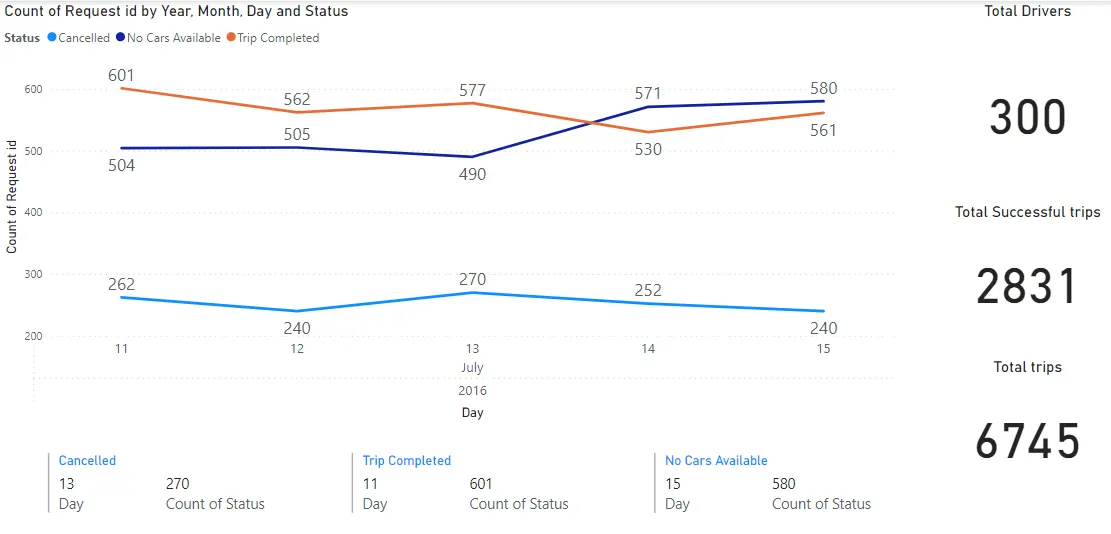
We can see that on the day 15 and 13 we got more cancelled trips than the completed trips.
Insights:
From the overall analysis we can say that total trips that are requested is very much high than the trips that got completed successfully.
On an average each driver has completed more than 8 trips in the 5 days that the data is shared for.
Recommendations:
It is recommended to hire more number drivers into the company to increase the availability to the customers.
If there is a concern of maintaining more vehicles suggested to hire the drivers having vehicles which help in decrease the maintaince and parking costs.
It would be more profitable if there are more cars provided at the airport location.
Conclusions:
On overall conclusion to the analysis, we can say the trend of the availability of cars is the same way company will be seeing a greater loss in the near future.
It is suggested to increase the availability of the cabs at airport to see the higher growth in future.