Project 2 - Supply and Demand Gap Analysis
PROJECT -2
AUTOMOBILE DATA
AIM
The aim of this Project is to create a Power BI dashboard to visualize and analyse Automobile data for a specific maker.
INTRODUCTION
The automobile industry is subject to various risk factors that can impact the perceived value of a vehicle in the market. This report aims to analyse these factors and propose a symbolling system for risk assessment. Create a text box or a title card that introduces the topic and the purpose of your report.
PROBLEM STATEMENT
The challenge is to develop a symbolling system that accurately reflects the degree to which an automobile is more or less risky than its price suggests. This symbolling system will help consumers and industry professionals make informed decisions.
METHODOLOGY
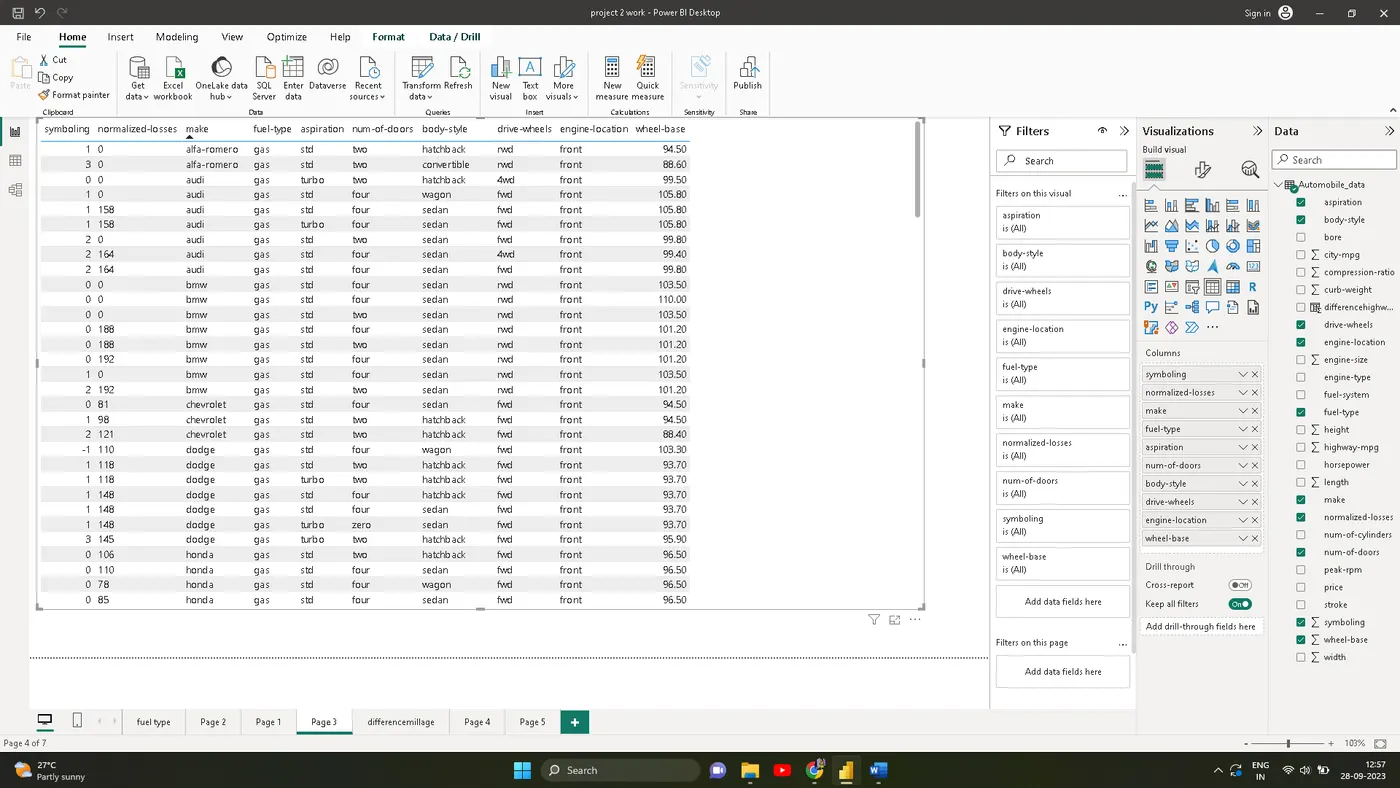
<!-- [if !supportLists]-->· <!--[endif]-->Data was collected on various automobile attributes, including normalized losses, make, fuel type, aspiration, number of doors, body style, drive wheels, engine location, and wheelbase.
<!-- [if !supportLists]-->· <!--[endif]-->The data was categorized and analysed to assign risk factors to each vehicle.
<!-- [if !supportLists]-->· <!--[endif]-->The symbolling system was developed by adjusting the initial risk factor based on the analysis.
<!-- [if !supportLists]-->· <!--[endif]-->Statistical and descriptive methods were used for the analysis.
ANALYSIS
<!-- [if !supportLists]-->· <!--[endif]-->The analysis categorized vehicles into different risk ranges based on the initial risk factors.
<!-- [if !supportLists]-->· <!--[endif]-->Symbolling adjustments were made for each vehicle, moving it up or down the risk scale.
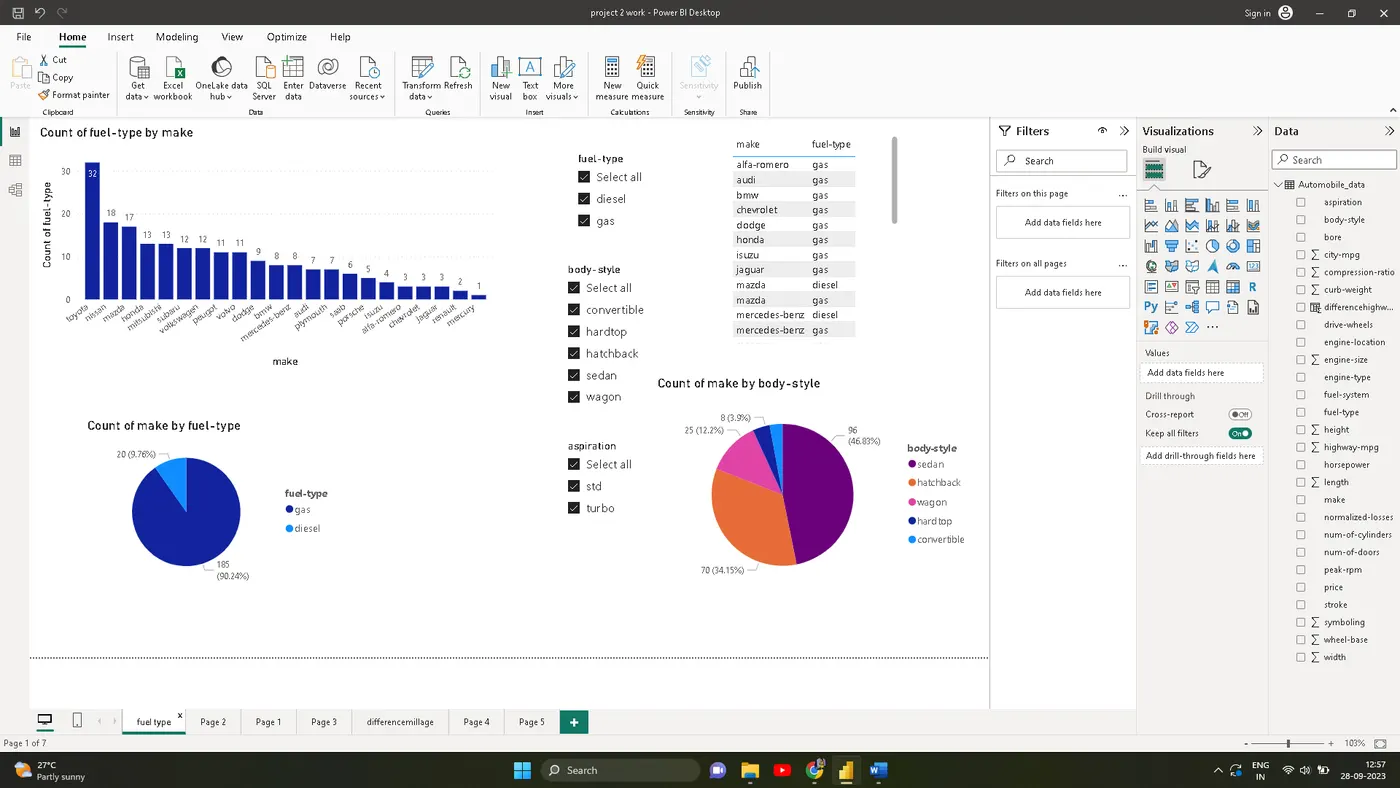
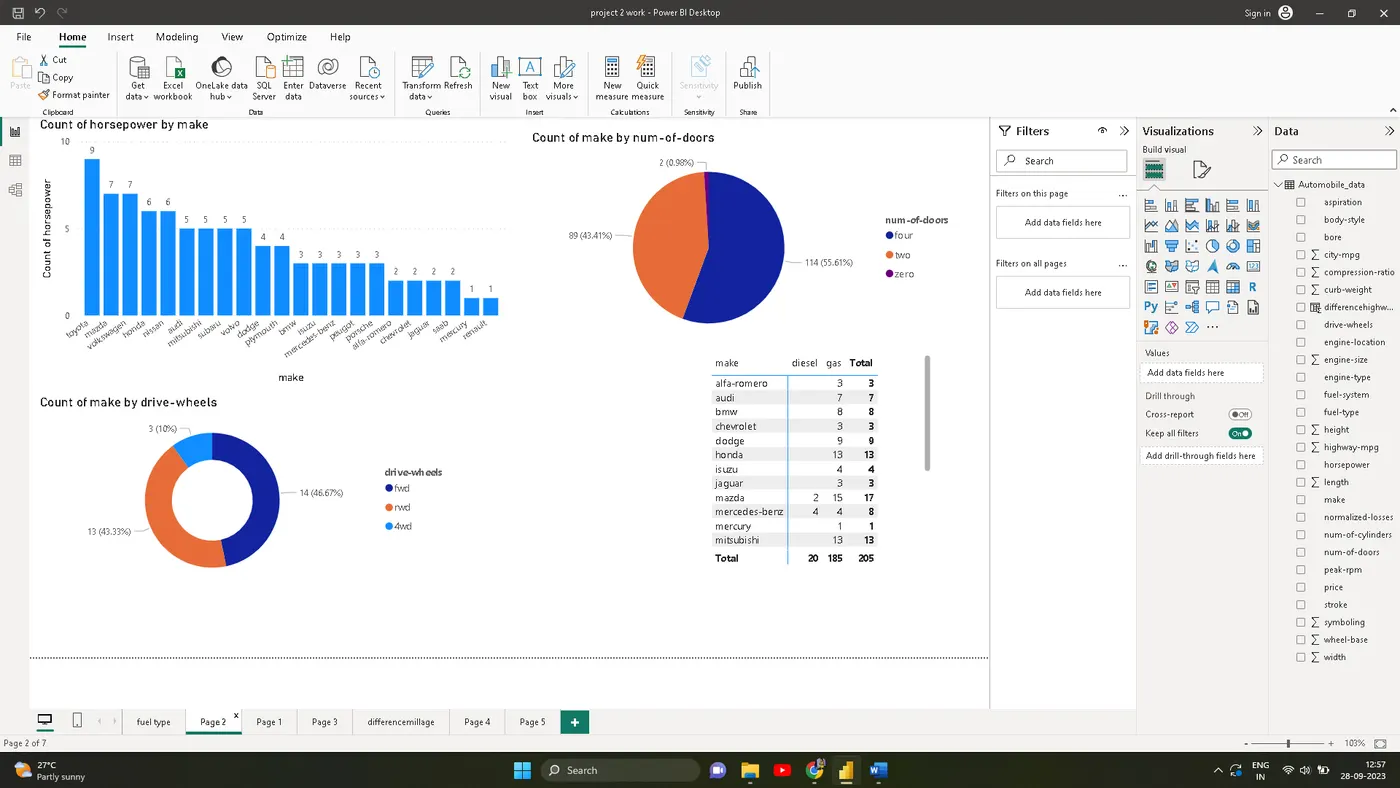
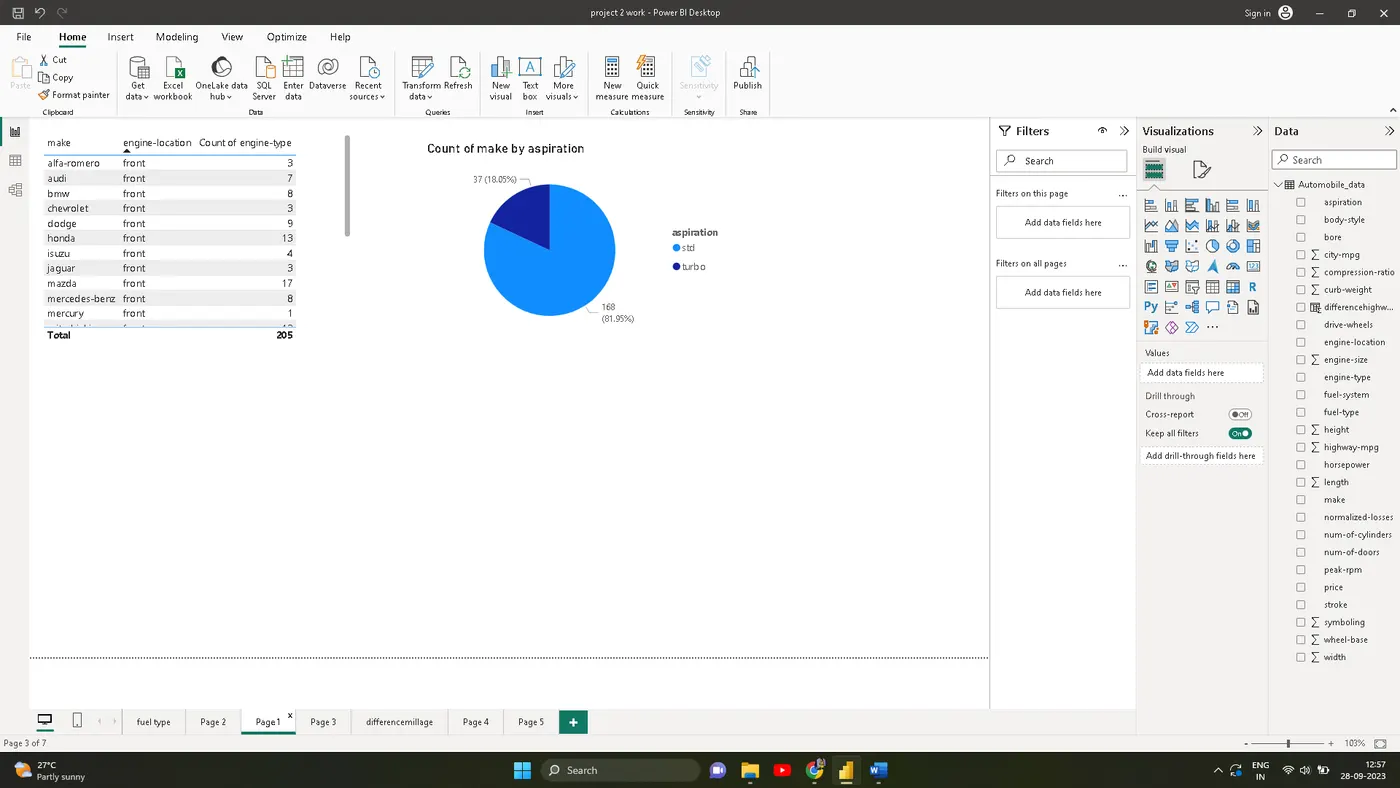
<!-- [if !supportLists]-->· <!--[endif]-->Additional insights may be derived from the analysis, such as the distribution of risk factors among different makes, body styles, or fuel types.
INSIGHTS
<!-- [if !supportLists]-->· <!--[endif]-->Present the insights gained from the analysis, such as which makes or body styles tend to have higher or lower risk factors.
<!-- [if !supportLists]-->· <!--[endif]-->Discuss any patterns or trends observed in the data
RECOMANDATIONS.
<!-- [if !supportLists]-->· <!--[endif]-->Propose a symbolling system that accounts for the risk factors identified in the analysis.
<!-- [if !supportLists]-->· <!--[endif]-->Provide guidelines for consumers, industry professionals, or insurers on how to use the symbolling system effectively.
CONCLUSION
<!-- [if !supportLists]-->· <!--[endif]-->Summarize the main findings and recommendations of the report.
<!-- [if !supportLists]-->· <!--[endif]-->Reiterate the importance of the symbolling system in assessing automobile risk.
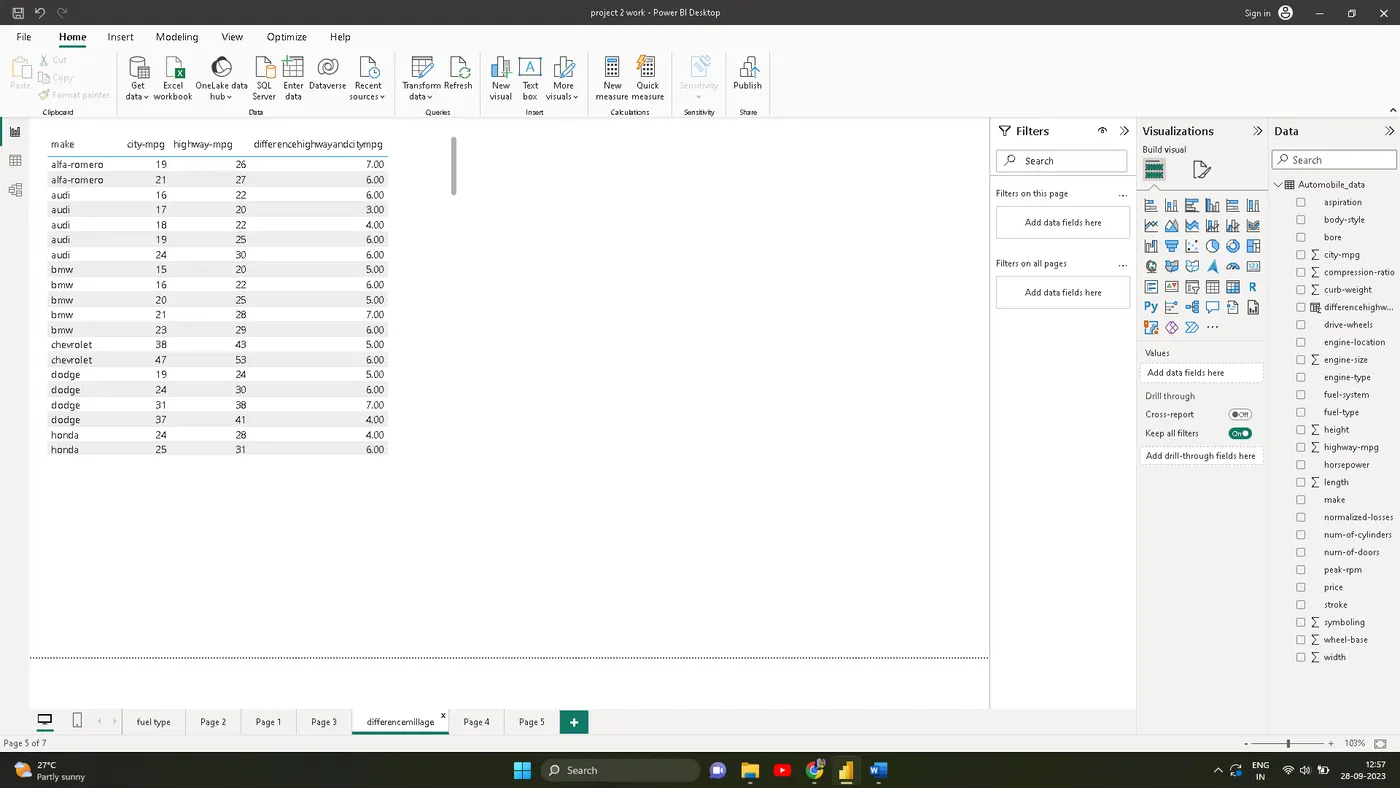
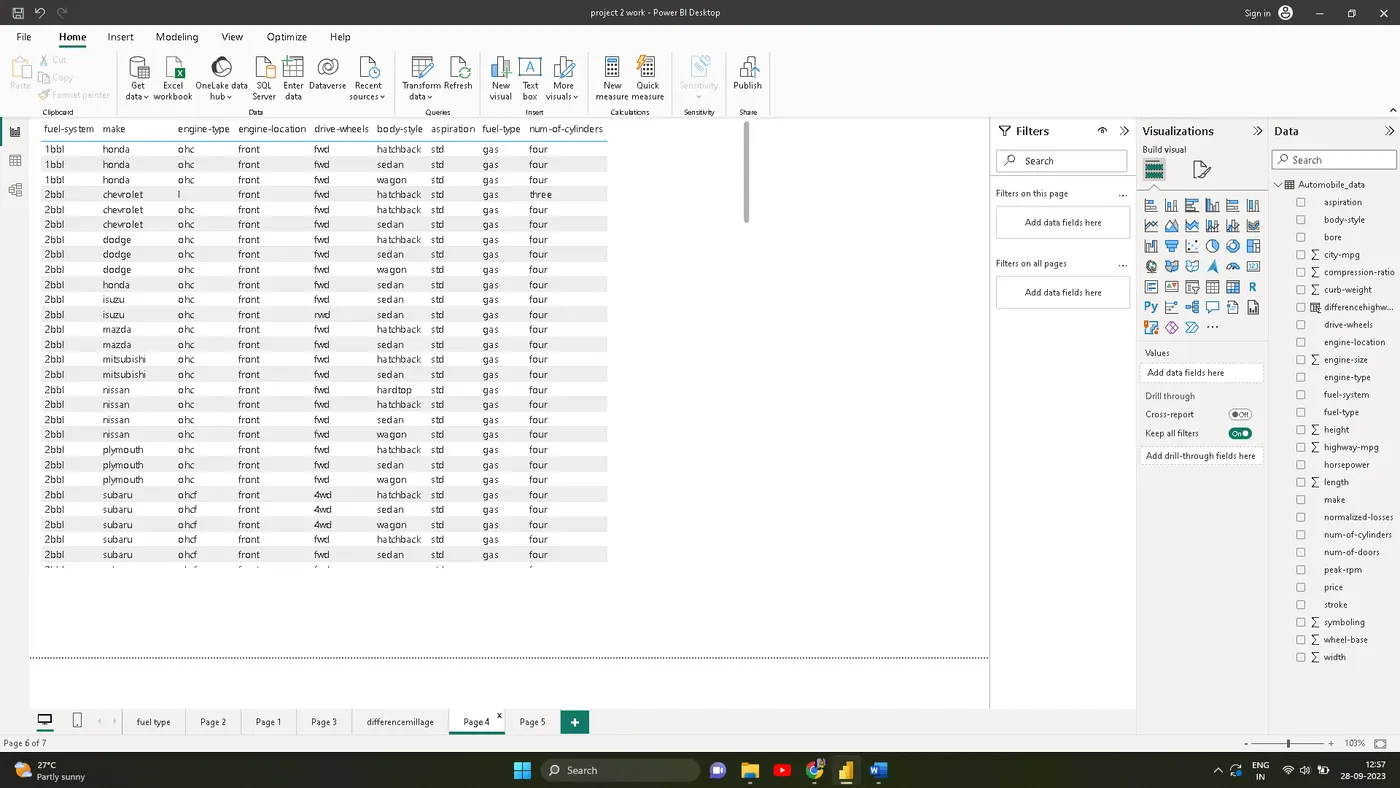
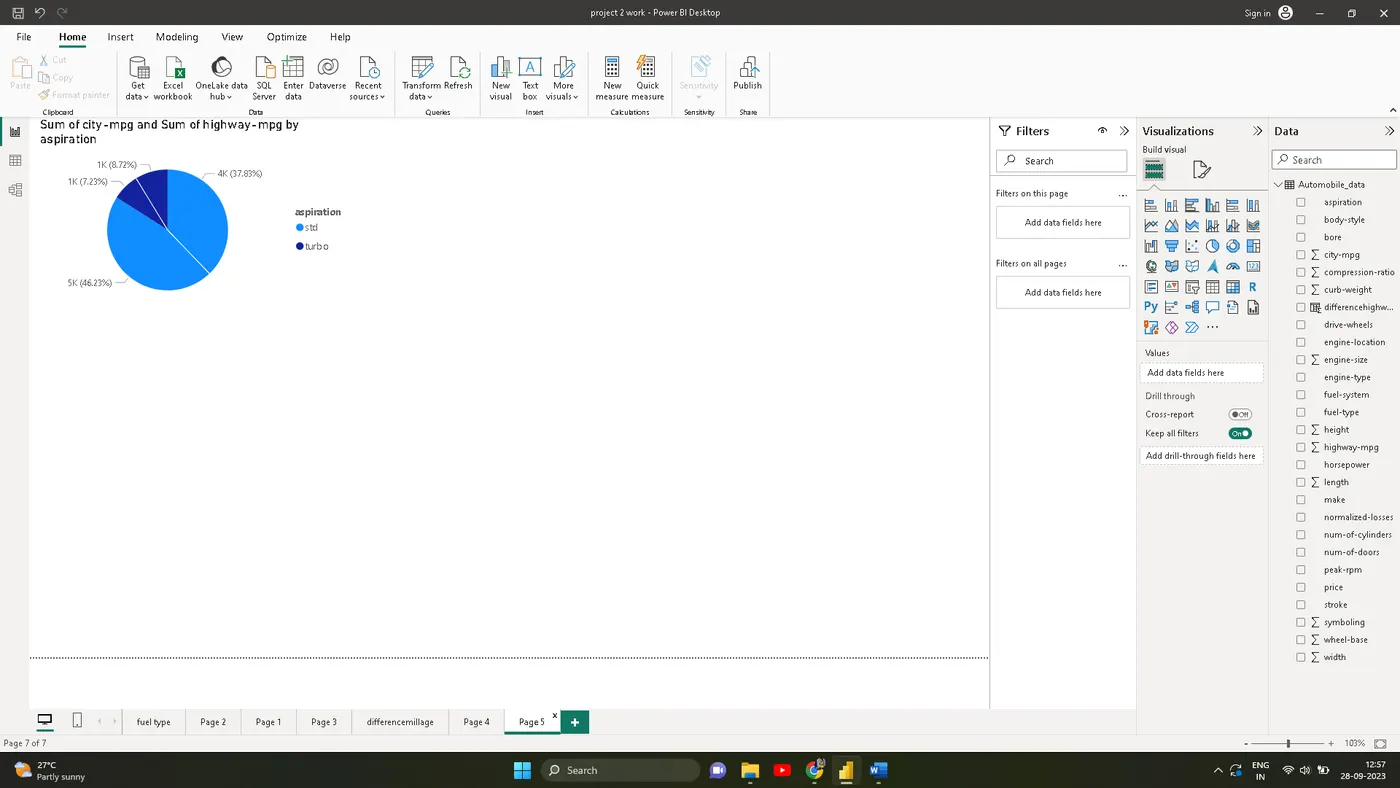
<!-- [if !supportLists]-->· <!--[endif]-->Now, you can start populating each section with the relevant data, analysis, and information to create your automobile risk assessment report. Remember to use charts, graphs, and tables where appropriate to visualize the data and analysis results.
CHARTS AND VISULAZATIONS
<!--[endif]-->
<!--[endif]-->