Project 2 - Supply and Demand Gap Analysis
Aim
The aim of this presentation is to demonstrate the insights and findings obtained from analyzing the Super Mart sales data using Power BI. By exploring various charts and visualizations, we aim to provide a comprehensive understanding of the sales performance by category and subcategory, sales trends by region and city, the relationship between discounts and profits, year-wise sales and profit analysis, top customers by sales and profit, and subcategory-wise profit and sales. Our goal is to enable the management to make informed decisions and take appropriate actions to improve the supply and demand gaps and maximize profits.
Introduction
- Welcome to the Super Mart Sales Performance Analytics and Demand Forecasting presentation. In this project, we have analyzed the sales data of a supermart and identified several key insights that can help improve the company's performance.
- We have used a variety of visualization techniques to identify trends and patterns in the data, including stacked charts, line charts, and bar charts. Through this analysis, we have discovered that certain product categories and subcategories are performing better than others, and certain regions and cities are stronger performers in terms of sales.
- Additionally, we have examined the relationship between discounts and profits, as well as the relationship between sales and profits, to identify areas where adjustments can be made to improve overall profitability. Finally, we have analyzed the top 20 customers by sales and profit, as well as the profit and sales trends over time for specific subcategories.
- Overall, the aim of this presentation is to provide actionable insights that can help the company improve its sales performance and increase profitability.
Problem statement
- Low sales and profits in certain product categories: Our analysis has shown that there are certain product categories, such as meat and snacks, that are not performing as well as others in terms of sales and profits. This indicates that there may be a problem with supply or demand for these products.
- Inefficient discount and pricing strategies: We have also identified that certain categories, such as oil and masala, are not offering enough discounts to drive sales. This suggests that there may be room for improvement in the company's discount and pricing strategies.
- Sub-optimal production planning: The analysis has revealed that there are periods of time when demand exceeds supply, particularly for popular products like beverages. This indicates that there may be a need for better production planning to ensure that there is sufficient supply to meet demand.
- Poor performance in certain regions: The data shows that some regions are performing better than others in terms of sales and profits. This suggests that there may be underlying factors, such as local competition or consumer preferences, that are affecting sales in these regions.
Methodology
- Data collection: We collected data on sales performance from the Super Mart sales database, including information on categories, subcategories, cities, regions, and customer details. We have extracted from the Kaggle.
- Data analysis: We analyzed the data using a variety of visualizations, including stacked charts, line charts, bar charts, and tree maps. We used Power BI and Excel to create these visualizations and to identify trends and patterns in the data.
- Insights generation: Based on the data analysis, we generated insights into sales performance and demand forecasting for Super Mart. These insights helped us identify areas of opportunity for increasing sales and profits, as well as areas where Super Mart may need to make changes to its operations or marketing strategies.
Analysis (Data sheets pertaining to it)
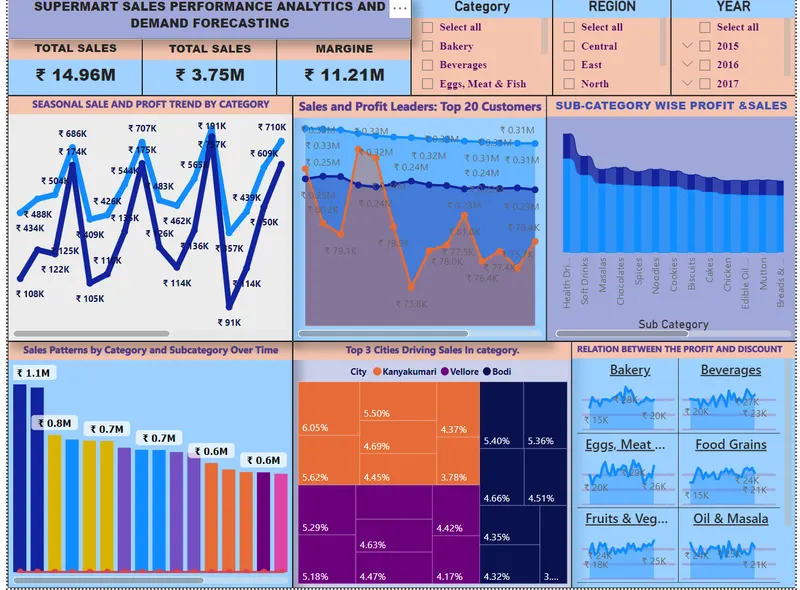
Insights
- Beverages are the best-performing category, followed by office supplies and technology. Meat and snack items are performing relatively poorly, indicating a need to increase production.
- The top three cities in terms of sales by category are Kanyakumari, Bodhi, and Vellore. This suggests that these cities have good potential for expanding sales in those categories.
- The relationship between discounts and profits varies depending on the category. For example, the oil and masala category would benefit from increasing discounts to boost sales, while other categories do not show a significant correlation between discounts and profits.
- The year 2015 had lower sales and profits compared to the other years, indicating a need to investigate the factors that contributed to this decline.
- The top 20 customers have varying levels of profitability, with only two customers providing a significant profit margin. This suggests that the sales team may need to focus on targeting high-profit customers to increase profitability.
- The subcategory of flour items generates relatively low profits, indicating a need to re-evaluate the pricing and production of these items.
Recomendations.
- Increase production of meat and snack items: Since these products have lower sales, increasing their production can help capture more sales and improve overall revenue.
- Offer more discounts on oil and masala: The sales trends show that these products have less sensitivity to discounts, so offering more discounts can help increase sales and improve profitability.
- Review the pricing strategy for flour products: As these products have lower profitability, a review of their pricing strategy can help identify opportunities to increase margins.
- Focus on top-performing categories and subcategories: Categories such as beverages have high sales and profitability, so focusing on these areas can help drive growth and profitability.
- Analyze customer behavior: Analyzing the top 20 customers can help identify patterns in their behavior, such as preferred products and purchasing frequency, which can inform marketing and sales strategies.
- Explore expansion opportunities: Identifying the top-performing regions and cities can help inform expansion opportunities, such as opening new stores or targeting marketing efforts in these areas.
Conclusions
- In conclusion, this project on Super Mart Sales Performance Analytics and Demand Forecasting provided valuable insights into the sales trends and performance of different categories and subcategories of products, as well as the behavior of customers in different regions and cities. Through the use of various visualizations, we were able to identify the strengths and weaknesses of the Super Mart's sales strategies and make recommendations for improving its performance.
- We found that certain products, such as beverages, were performing well, while others, such as meat and snack items, were lagging behind. By analyzing the sales trends and patterns, we were able to suggest increasing production for these underperforming categories. We also found that certain cities, such as Kanyakumari, Bodhi, and Vellore, were performing well in terms of sales, while others needed to be targeted for improvement.
- Additionally, we found that discounts had a significant impact on sales, with certain categories being more sensitive to discounts than others. We recommended adjusting the discount strategies to improve sales in underperforming categories.
- Overall, this project provided valuable insights into the Super Mart's sales performance and highlighted opportunities for improvement. By implementing our recommendations, Super Mart can enhance its sales performance and increase profitability in the long run.