Project 2 - Supply and Demand Gap Analysis
PROJECT-2 POWER BI
AIM:
The aim is to analyze the data and how many people are using the cabs and how many people are booked and then cancelled the cabs.
Introduction:
The main objective of this project is to analyze the data on, Trip pricing with taxi mobility. Through the Analysis of data, we can find out some important insights of the taxi booking and cancelling & the customer’s destinations.
Problem Statement:
- We can find out how many males/females are on how many long destinations they are travelling
- Total pricing by gender and then by type of cab. In this analysis, we can see the number of cancellations in the last month, the Lifestyle index, etc. Customers since month by destination type etc.
Methodology:
- Data Cleaning:
In data cleaning I cleaned the data with the transform data option present in Power BI because the dataset was not cleaned and included some missing values, with ‘a’. So with the help of the duplicates function in Power BI, I cleaned the data and replace the null values with 0 and then started working on it
- Data Interpretation:
- The data is clean only, but there are some missing values and that values are replaced
- There are totally 131663 rows & 14 rows
- Data Visualization:
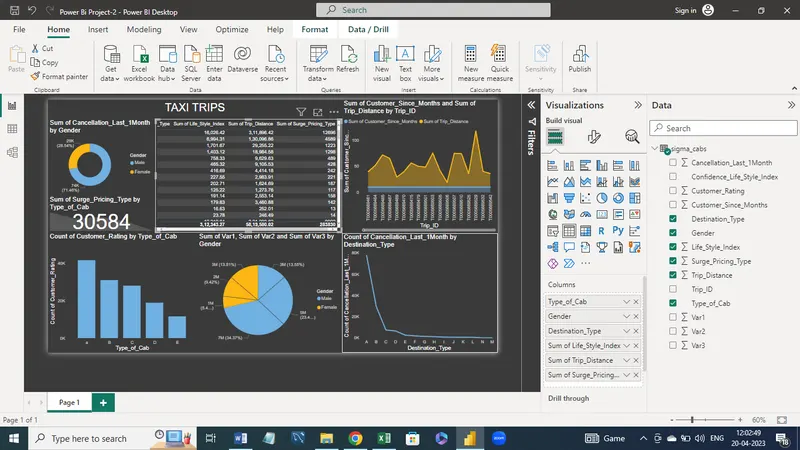
Then with the help of this dataset the visualization has been created. In visualization, I took the help of Power BI Desktop software to make graphs and charts here some relevant graphs and charts are attached.
Analysis:
- The Customer Ratings by the trip and the type of cab used by the customers .
- The variation1, variation 2 and variation 3 of customers in gender wise
- Count of the cancellation of the trip by previous month and their destinations
- Sum of the customers since months and their trip id.
- Sum of cancellation by gender wise and the destinations.
- The type of cab used, gender, Destination type, Pricing, lifestyle index are being displayed.
- Pricing type and the surge type of cab pricing type has been displayed.
Insights:
- The insight of the data, is that the more number of taxi cabs are booked than the number of the taxi’s cancelled.
- The more number of cancellation was done by the male then the female customer’s.
Recommendations:
- We can collect a large dataset for analysis from the kaggle website
- The data is about trip and we can analyze the data of the trip destination and cancellations.
- Like this dataset we can perform operations with various types of cabs, gender, or destination type.
- We can work on large datasets and analyze them with the proper format of the chart.
Conclusions:
In conclusion, the dataset is analyzed and created a visualization with the dataset which was taken from the kaggle website. The dataset about the how the customer’s using the taxi’s. Then how the customer’s are booking and cancelling their trip in taxi’s in the gender wise. These are all the things we can analyze from the datasets.
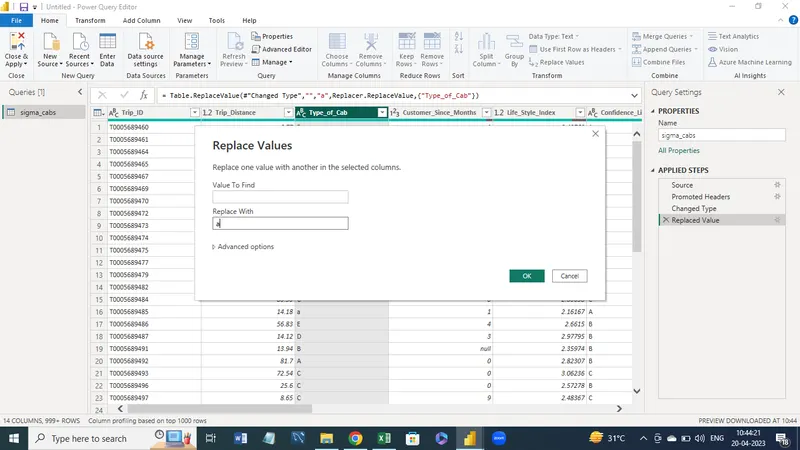
Replaced the empty values with the small 'a'