Project 2 - Supply and Demand Gap Analysis
Super Store Analysis

1.Aim
2.Introduction
3.Problem Statement
4.Tools and dataset used
5.Methodology
6.Conclusion
Aim:
The primary aim of the project is to collect and analyze the data to create a dashboard which helps to understand the sales done in each region for the respective years.
Introduction:
The Super Store dataset contains data on order details of customers for orders of a superstore in the US. It is a data set which has around 51000 values. It is a customer centric data set, which has the data of all the orders that have been placed through different vendors and markets, starting from the year 2012 till 2015.Power BI is a data analysis and visualization tool which is commonly used in today's industry. Many organizations still find it important for the research relevant to data science. The ease of use of Power BI is to provide a drag and drop interface. This feature helps to perform tasks like sorting, comparing, and analyzing, very easily and fast
Problem Statement:
To analyze the top profit and loss products and to find the orders, sales, returned order that has taken for each region with the respective years and to visualize the number of delivery days taken for each item to be send to the customer
Tools and Datasets Used:
- Power BI
- MS Excel
- For Datasets - Google.com and Kaggle.com
Methodology:
Step 1:
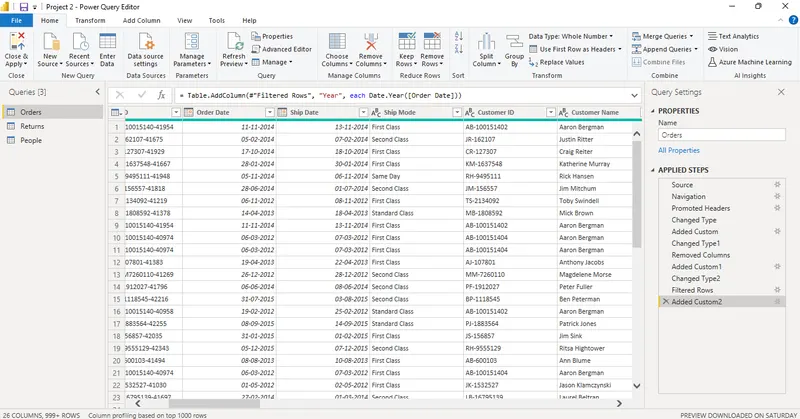
Searched for the superstore dataset, loaded the Excel file in Power BI and performed data cleaning with the transform option available in power BI.
Step 2:
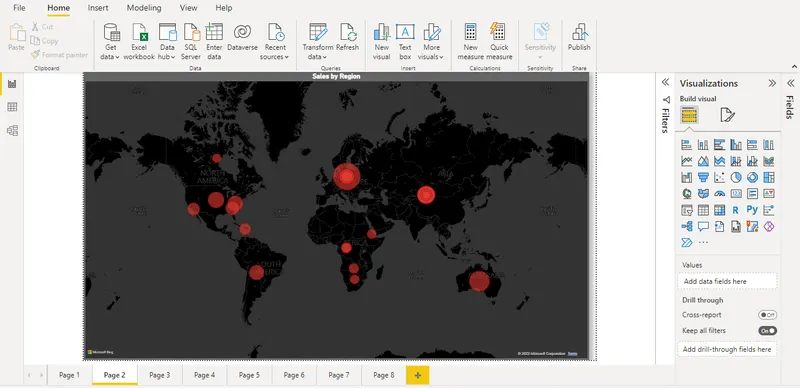
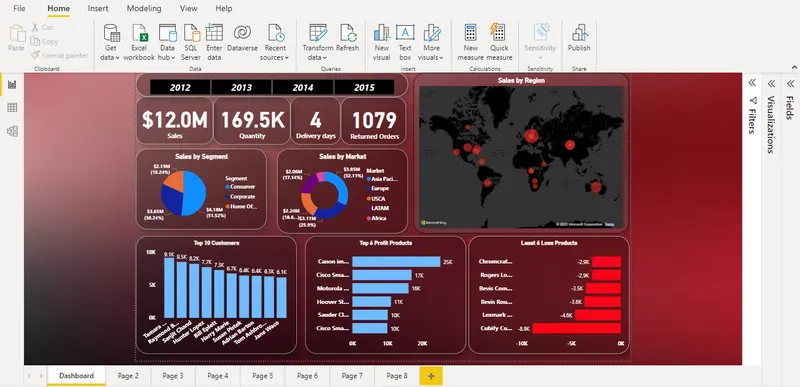
Analyzed the data and mapped the sales with region using dark theme for the map
Step 3:
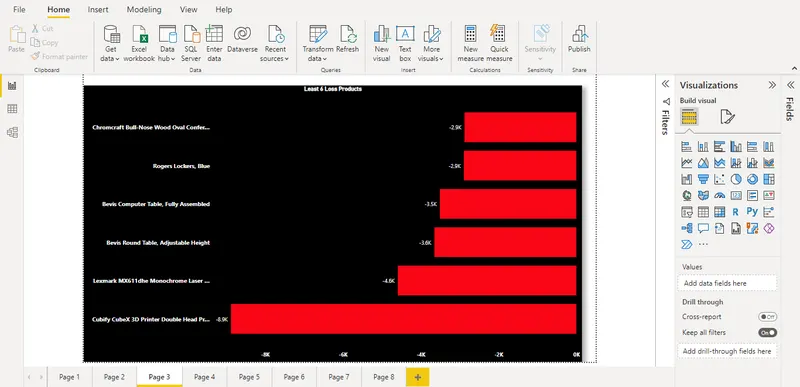
The profit for the least 6 products was visualized with clustered bar chart using the filter option. The least 6 products with respect to profit was colored with red color to indicate that has negative values
Step 4:
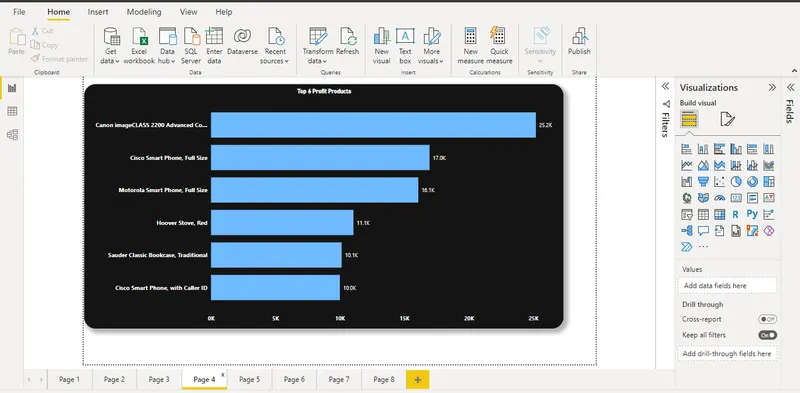
The profit for the top 6 products was visualized with clustered bar chart using the filter option.
Step 5:
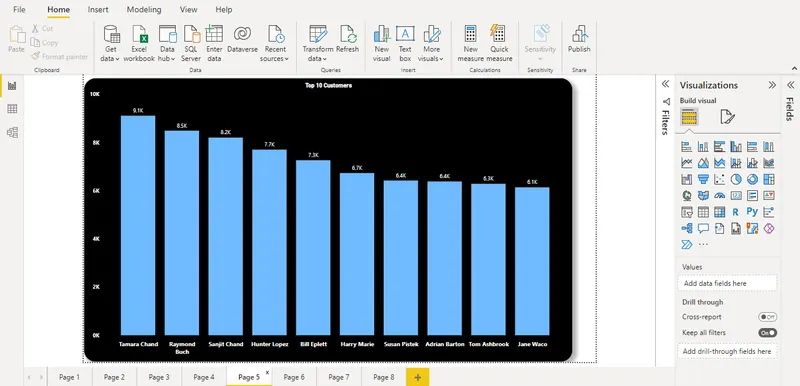
The top10 customers with respect to profit was visualized with stack bar chart. Text formatting was done using the format option available for the stack bar chart
Step 6:
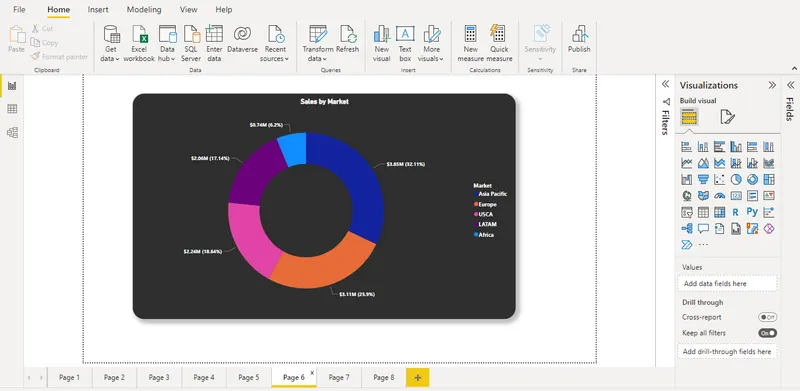
Used donut chart for the sales that has been done in market. In which legends undertook market and values took sales. The marketing region like Asia Pacific, Europe, USCA, LATAM,Africa was colored with different colors to indicate the region and text formatting was also done
Step 7:
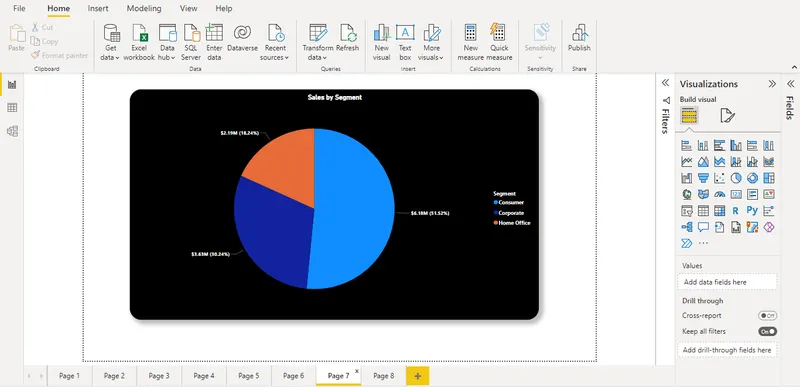
Used pie chart for the sales that has been done in each segment like consumer, home office, corporate. In which legends undertook segment and values took sales. Text formatting was also done
Step 8:
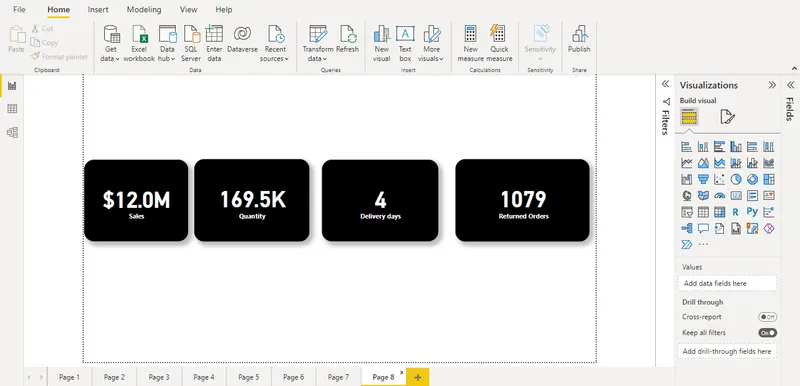
The number of sales, the order quantity, the number of delivery days taken for the product to reach the customer and the orders that returned was visualized using card. Dollar ($) was assigned for the total sales and was quantity it was indicated in thousands(K)
Step 9:
All the above visualization steps were changed to black background and the dashboard wallpaper was changed to Gaussian blur gradient. The text which was in black color was transferred to white with the formatting options. The final dashboard is shown below
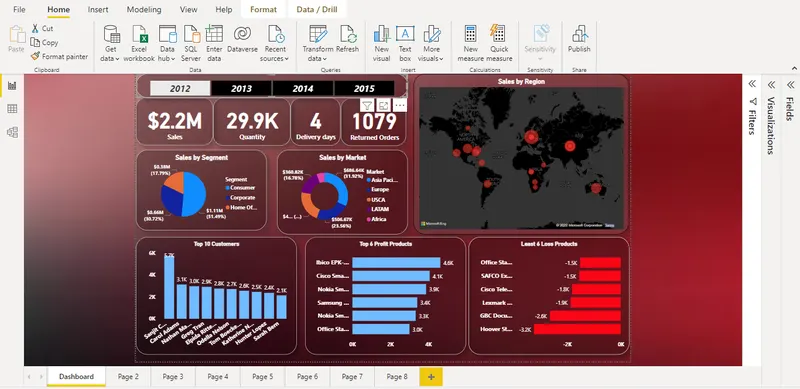
For the year 2012,there were $2.2M total sales ,29.9K ordered quantity and the least and top 6 products with respect to profit was shown in the dashboard with top10 customers
Conclusion:
I have visualized and analyzed various use cases in the superstore dataset. I got some insightful results about the Profit and Sales in the superstore. I can now confidently pick up more datasets to define use cases for, and visualize them in Power BI.
Conclusion:
This is the analysis of the given data set and I came to know that this visualization differs based on the values of the customer. I have given my sales organization insights which they can use, helping everyone to make critical decisions based on data’s.