Project 2 - Rankine cycle Simulator
Aim - Understand the concept of Rankine cycle by referring to standard thermal engineering text book.
Objective -
- Create a Rankine Cycle Simulator using MATLAB.
- Calculate the state points of the Rankine Cycle (any type of your choice) based on user inputs.
- Then, plot the corresponding T-s and H-s plots for the given set of inputs.
Theory -
As the water condenses in the condenser, waste heat is given off in the form of water vapour which can be seen billowing from a plant's cooling towers. This waste heat is necessary in any thermodynamic cycle. Due to this condensation step, the pressure at the turbine outlet is lowered. This means the pump requires less work to compress the water—resulting in higher overall efficiencies.
- Pump - Compression of fluid to high pressure.
- Boiler - High pressure liquid to vapour at high temperature and pressure.
- Turbine - Expansion of high pressure and high temperature steam to generate work.
- Condensor - Condensation or cooling of expanded vapour.
Formula Used -
Pump - Wpump,in=h4−h3�����,��=ℎ4-ℎ3
Boiler - Qin=h1−h4���=ℎ1-ℎ4
Turbine - Wturbine,out=h1−h2��������,���=ℎ1-ℎ2
Condensor - Qout=h2−h3����=ℎ2-ℎ3
Efficiency Formula -
Wnet=Qin−Qout����=���-����
Processes -
There are four processes in the rankine cycle :
1. Process 1-2 - Isentropic Expansion in the turbine.
2. Process 2-3 - Constant pressure Heat rejection in condenser.
3. Process 3-4 - Isentropic compression in pump.
4. Process 4-1 - Constant pressure heat addition in the boiler.
Working of the rankine cycle simulator -
-
In Process 1-2 , The vapour expands and go through a turbine, generating power, here this process decreases the temperature and pressure of the vapour, and some amount of condensation may occur.
-
In Process 2-3 , The vapor-liquid mixture leaving the turbine (2) is condensed at low pressure, usually in a surface condenser using cooling water. In well designed and maintained condensers, the pressure of the vapor is well below atmospheric pressure, approaching the saturation pressure of the operating fluid at the cooling water temperature.
-
In Process 3-4 , The pressure of the condensate is raised in the feed pump. Because of the low specific volume of liquids, the pump work is relatively small and often neglected in thermodynamic calculations.
-
In Process 4-1 , High pressure liquid enters the boiler from the feed pump (4) and is heated to the saturation temperature. Further addition of energy causes evaporation of the liquid until it is fully converted to saturated steam (1) or superheated (1).
PROGRAM Codes -
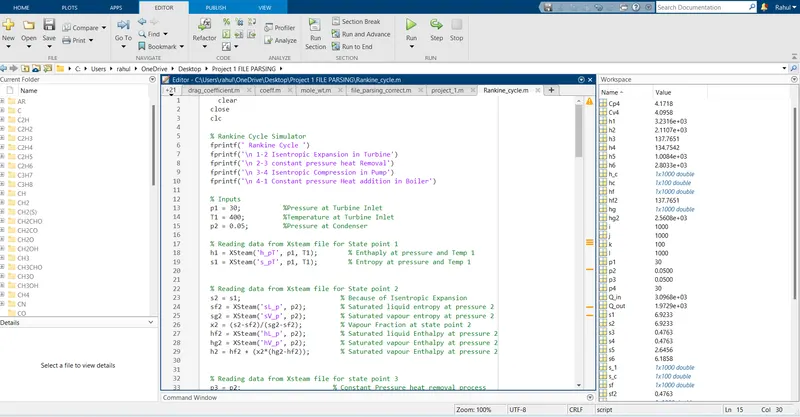
clear
close
clc

% Rankine Cycle Simulator
fprintf(' Rankine Cycle ')
fprintf('\n 1-2 Isentropic Expansion in Turbine')
fprintf('\n 2-3 constant pressure heat Removal')
fprintf('\n 3-4 Isentropic Compression in Pump')
fprintf('\n 4-1 Constant pressure Heat addition in Boiler')

% Inputs
p1 = 30;           %Pressure at Turbine Inlet
T1 = 400;          %Temperature at Turbine Inlet
p2 = 0.05;         %Pressure at Condenser

% Reading data from Xsteam file for State point 1
h1 = XSteam('h_pT', p1, T1);        % Enthaply at pressure and Temp 1
s1 = XSteam('s_pT', p1, T1);        % Entropy at pressure and Temp 1


% Reading data from Xsteam file for State point 2
s2 = s1;                          % Because of Isentropic Expansion
sf2 = XSteam('sL_p', p2);         % Saturated liquid entropy at pressure 2
sg2 = XSteam('sV_p', p2);         % Saturated vapour entropy at pressure 2
x2 = (s2-sf2)/(sg2-sf2);          % Vapour Fraction at state point 2
hf2 = XSteam('hL_p', p2);         % Saturated liquid Enthalpy at pressure 2
hg2 = XSteam('hV_p', p2);         % Saturated vapour Enthalpy at pressure 2
h2 = hf2 + (x2*(hg2-hf2));        % Saturated vapour Enthalpy at pressure 2


% Reading data from Xsteam file for state point 3
p3 = p2;                        % Constant Pressure heat removal process
s3 = XSteam('sL_p', p3);        % Saturated liquid entropy at Pressure 3
h3 = XSteam('hL_p', p3);        % Saturated liquid Enthalpy at Pressure 3

% Reading data from Xsteam file for State point 4
s4 = s3;                            % Isentropic Compression process
p4 = p1;                            % Constant Pressure heat rejection

% Work done in Turbine for the rankine cycle
W_T = h1-h2;

% Work done required for pump
v3 = XSteam('vL_p',p3);
W_P = v3*(p4-p3)*100;
h4 = h3 - W_P;

% Net work done for Rankine Cycle
W_net = W_T - W_P;

% Heat Addition to System
Q_in = h1-h4;

% Heat Rejection from System
Q_out = h2-h3;

% Thermal Efficiency of Rankine Cycle
T_eff = (W_net/Q_in)*100;

% Specific steam consumption  = (Mass flow rate / Net work done)
Sp_S = (3600/W_net);

% Calculation of Temperature at All state Point 2, 3 and 4
T3 = XSteam('Tsat_p',p3);     % Saturation Temperature at Pressure 3
T2 = T3;                      % Becuase of Constant Pressure Heat addition
Cp4 = XSteam('Cp_ps',p4,s4);  % Specific isobaric heat capacity
Cv4 = XSteam('Cv_ps',p4,s4);  % Specific isochoric heat capacity
k = Cp4/Cv4;
T4 = T3/((p3/p4)^((k-1)/k));  % Temperature at State point 4

% Calculation of Other constant for saturated liquid and Vapour

T6 = XSteam('Tsat_p', p1);    % Saturated Temperature at Pressure 1
s5 = XSteam('sL_p', p1);      % Saturated Liquid entropy at pressure 1
s6 = XSteam('sV_p', p1);      % Saturated Vapour entropy at Pressure 1
h5 = XSteam('hL_p', p1);      % Saturated Liquid Enthalpy at Pressure 1
h6 = XSteam('hV_p', p1);      % Saturated Vapour Enthalpy at pressure 1
T5 = T6;

% Plotting for Saturation Line
T = linspace(1,560,1000);
for i = 1:length(T)
    sf(i) = XSteam('sL_T' ,T(i));    % Saturated Liquid Entropy
    sg(i) = XSteam('sV_T' ,T(i));    % Saturated Vapour Entropy
    hf(i) = XSteam('hL_T' ,T(i));    % Saturated Liquid Enthalpy
    hg(i) = XSteam('hV_T' ,T(i));    % Saturated Vapour Enthalpy
end

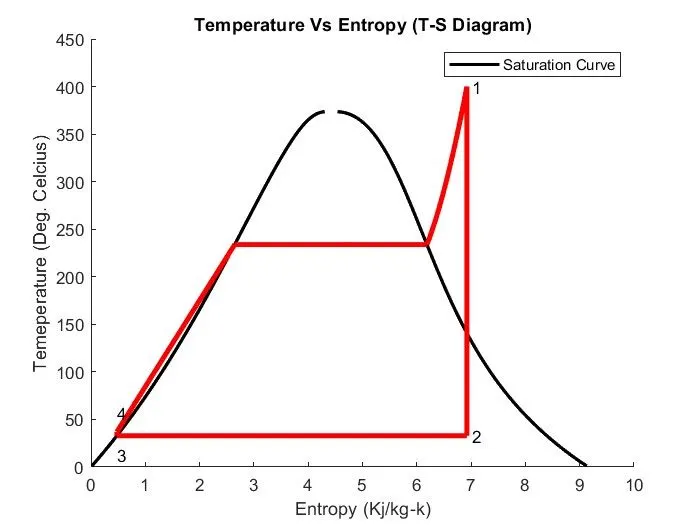
% Plotting T-S Diagram for Rankine Cycle
figure(1)
hold on
plot(sf,T,'color','black','linewidth',2)
plot(sg,T,'color','black','linewidth',2)
plot([s1 s2],[T1 T2], 'color', 'r', 'linewidth',3)
plot([s2 s3],[T2 T3], 'color', 'r', 'linewidth',3)
plot([s3 s4],[T3 T4], 'color', 'r', 'linewidth',3)
plot([s4 s5],[T4 T5], 'color', 'r', 'linewidth',3)
plot([s5 s6],[T5 T6], 'color', 'r', 'linewidth',3)
s_1 = linspace(s6,s1,1000);
for j = 1:length(s_1)
    Tc(j) = XSteam('T_ps',p1,s_1(j));
end

plot(s_1,Tc,'color','r','linewidth',3)
text(s1+0.1, T1, '1')
text(s2+0.1, T2, '2')
text(s3, T3-20, '3')
text(s4, T4+20, '4')
title('Temperature Vs Entropy (T-S Diagram)')
xlabel('Entropy (Kj/kg-k)')
ylabel('Temeperature (Deg. Celcius)')
legend('Saturation Curve')


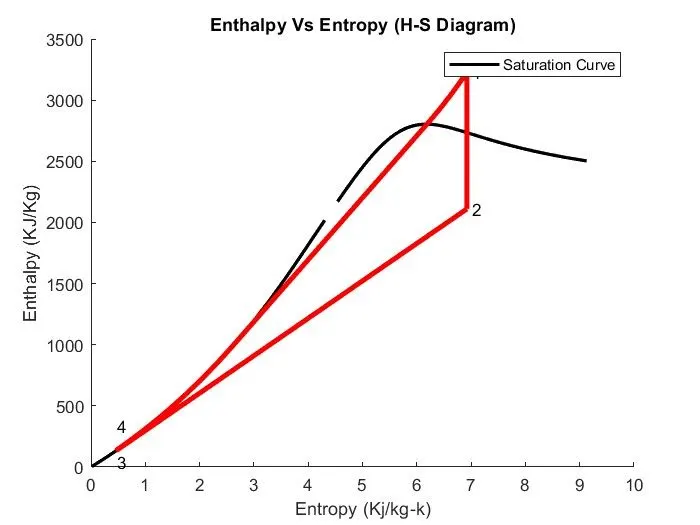
% Plotting H-S Diagram for Rankine Cycle
figure(2)
hold on
plot(sf,hf,'color','black','linewidth',2)
plot(sg,hg,'color','black','linewidth',2)
plot([s1 s2],[h1 h2],'color','r','linewidth',3)
plot([s2 s3],[h2 h3],'color','r','linewidth',3)
plot([s3 s4],[h3 h4],'color','r','linewidth',3)
hc = linspace(h4,h5,100);
for k = 1:length(hc)
    s_c(k) = XSteam('s_ph',p1,hc(k));
end
plot(s_c,hc,'color','r','linewidth',3)
plot([s5 s6],[h5 h6],'color','r','linewidth',3)
for l = 1:length(s_1)
    h_c(l) = XSteam('h_ps',p1,s_1(l));
end

plot(s_1,h_c,'color','r','linewidth',3)
text(s1+0.1,h1,'1')
text(s2+0.1,h2,'2')
text(s3,h3-100,'3')
text(s4,h4+200,'4')
title('Enthalpy Vs Entropy (H-S Diagram)')
xlabel('Entropy (Kj/kg-k)')
ylabel('Enthalpy (KJ/Kg)')
legend('Saturation Curve')

% Displaying Results in Command window
fprintf('\n')
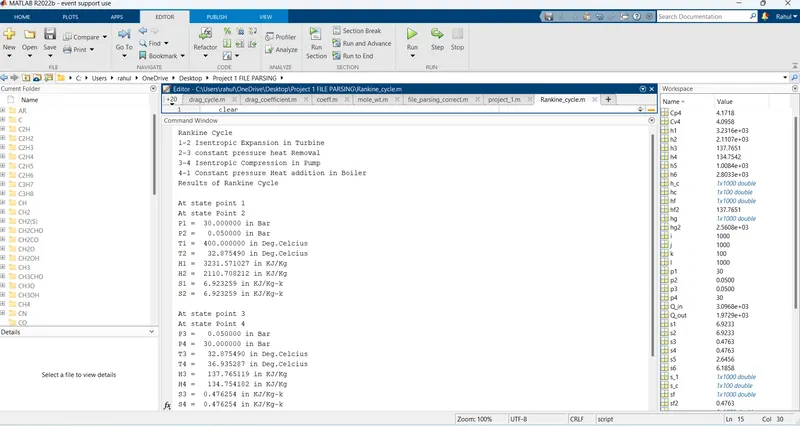
disp(' Results of Rankine Cycle ')
fprintf('\n At state point 1')
fprintf('\n At state Point 2')
fprintf('\n P1 = %10f in Bar',p1);
fprintf('\n P2 = %10f in Bar',p2);
fprintf('\n T1 = %11f in Deg.Celcius',T1);
fprintf('\n T2 = %11f in Deg.Celcius',T2);
fprintf('\n H1 = %12f in KJ/Kg',h1);
fprintf('\n H2 = %12f in KJ/Kg',h2);
fprintf('\n S1 = %9f in KJ/Kg-k',s1);
fprintf('\n S2 = %9f in KJ/Kg-k',s2);
fprintf('\n')
fprintf('\n At state point 3')
fprintf('\n At state Point 4')
fprintf('\n P3 = %10f in Bar',p3);
fprintf('\n P4 = %10f in Bar',p4);
fprintf('\n T3 = %11f in Deg.Celcius',T3);
fprintf('\n T4 = %11f in Deg.Celcius',T4);
fprintf('\n H3 = %12f in KJ/Kg',h3);
fprintf('\n H4 = %12f in KJ/Kg',h4);
fprintf('\n S3 = %9f in KJ/Kg-k',s3);
fprintf('\n S4 = %9f in KJ/Kg-k',s4);
fprintf('\n')
fprintf('\n Turbine Work Done = %14f in KJ/Kg',W_T)
fprintf('\n Pump Work Done = %15f in KJ/Kg',W_P)
fprintf('\n Net Work Done  = %17f in KJ/Kg',W_net)
fprintf('\n Thermal Efficiency = %13f in percent',T_eff)
fprintf('\n Sp. Steam Consumption = %f in KJ/Kw',Sp_S)
Program code window:
Command window output :
Graphical Output:
Conclusion -
Sucessfully simulated the Rankine cycle with calculation for performance parameters along with plots for T-S and H-S diagram.
References -
Theory of Rankine Cycle - Equations and Calculation (nuclear-power.com)
https://in.matx-steam-thermodynamic-properties-of-water-and-steam