Project 2 - Rankine cycle Simulator
Rankine Cycle:
Rankine cycle is a heat enginne that uses fuel to produce the heat. The process off the Rankine Cycle is
Process 1-2 Isentropic Expansion i the Turbine
Process 2-3 Constant pressure heat rejectio by condenser
Process 3-4 Isentropic compression at te pump
Process 4-1Constant pressure heat addition.
Programm
disp('Rankine Cycle');
disp('1-2 Isentropic Expansion i the Turbine');
disp('2-3 Constant pressure heat rejectio by condenser')
disp('3-4 Isentropic compression at te pump')
disp('4-1Constant pressure heat addition');
%input
p1 = input('value of pressure at the turbine inlet, p1 =')
T1 = input('Value of temperature at the turbine, T1=')
p2 = input('value of pressure at the condenser inlet,p2=');
%satae 1
h1= XSteam('h_pT', p1, T1);
s1= XSteam('s_pT', p1, T1);
%statae 2
s2 = s1;
sf2 = XSteam('sL_p',p2);
sg2 = XSteam('sV_p',p2);
x2 = (s2-sf2)/(sg2-sf2);
hf2 = XSteam('hL_p',p2);
hg2 = XSteam('hV_p',p2);
h2 = hf2 + (x2*(hg2-hf2));
%state 3
p3 = p2;
s3 = XSteam('sL_p',p3);
h3 = XSteam('hL_p',p3);
%state 4
s4 = s3;
p4 = p1;
%work done by turine
wt = h1-h2;
%work done to run pump
v3= XSteam('vL_p',p3);
Wp = v3*(p4-p3)*100;
h4 = h3 + Wp;
%network
Wnet = wt-Wp;
%heat into the Sysyem
Qin = h1-h4;
%heat out of the system
Qout = h2-h3;
%Thermal efficiency
eff = (Wnet/Qin)*100;
%Specific stream consumption
%SSC = mass flow rate/power
SSC = (3600/Wnet);
%calculatihg temperatures at the stste points
T3 = XSteam('Tsat_p', p3);
T2 = T3;
Cp4 = XSteam('Cp_ps',p4,s4);
Cv4 = XSteam('Cv_ps',p4,s4);
k = Cp4/Cv4;
T4 = T3/((p3/p4)^(k-1)/k);
%calculating temperature , enthalpy and entropy
T6 = XSteam('Tsat_p',p1);
s5 = XSteam('sL_p',p1);
s6 = XSteam('sV_p',p1);
h5 = XSteam('hL_p',p1);
h6 = XSteam('hv_p',p1);
T5 = T6;
%Plotting the saturation curve
T = linspace(1,375,1000);
for i = 1:length(T)
sf(i)= XSteam('sL_T', T(i));
sg(i)= XSteam('sV_T', T(i));
hf(i)= XSteam('hL_T', T(i));
hf(i)= XSteam('hV_T', T(i));
end
%Plotting T_s diagram
figure(1)
hold on
plot(sf,T)
plot(sg,T)
plot([s1 s2],[T1 T2])
plot([s3 s4],[T3 T4])
plot([s4 s5],[T4 T5])
plot([s5 s6],[T5 T6])
sc1 = linspace(s6, s1,1000);
for l = 1:length(sc1)
Tc1(1)= XSteam('T_ps', p1, sc1(1));
end
plot (sc1,Tc1)
%figure 2 h-s diagram
figure(2)
hold on
plot(sf, hf)
plot(sg,hg2)
plot([s1 s2],[T1 T2])
plot([s3 s4],[T3 T4])
plot([s4 s5],[T4 T5])
hc = linspace(h4,h5,100)
for k = 1:length(hc)
sch(k)= XSteam('s_ph', p1, hc(k));
end
plot (sch,hc)
plot([s5 s6], [h5 h6])
for m = 1:length(sc1)
hc1(m) = XSteam('h_ps', p1,sc1(m));
end
plot(sc1,hc1)
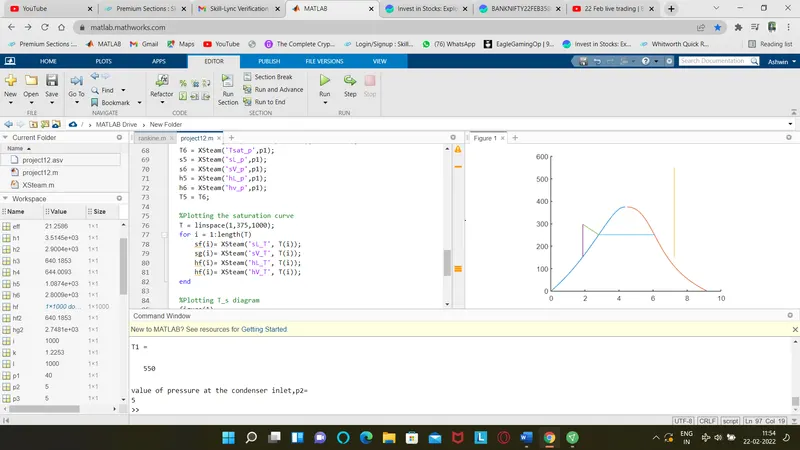
Xsteam data is used to extract steam and water properties like enthalpy and entropy at specific pressure and temperature.
The input of P1, T1 ans P2 are provided to the the program.
With the help on inputs and from Xsteam data the program calucaltes all the state points of the rankine cycle.
Plot the graph .