Project 2 - Rankine cycle Simulator
Aim: 1. Create rankine cycle simulator
- calculate the state points
3.plot t-s and h-s
Theory:
Rankine cycle is a model used to predict the performance of steam turbine systems.
It was also used to study the performance of reciprocating steam engine.
Processing of rankine cylce
1-2 isobaric heat transfer
2-3 isentropic expansion
3-4 isobaric heat rejection
4-1 isentropic compression
close all
clear all
clc

fprintf('1-2 isobaric heat transfer\n')
fprintf('2-3 isentropic expansion\n')
fprintf('3-4 isobaric heat rejection\n')
fprintf('4-1 isentropic compression\n')

p1=input('enter the pressure at the turbine inlet(in bar):');
t1=input('enter the temperature at the  inlet(in degreee celcius):');
p2=input('enter the pressure at the condeser(in bar):');


t= XSteam('Tsat_p',p1);
if t1>=t
h1= XSteam('h_pT',p1,t1);
s1= XSteam('s_pT',p1,t1);

p4=p1;
p3=p2;
h3= XSteam('hL_p',p3);
s3= XSteam('sL_p',p3);
t3= XSteam('Tsat_p',p3);
s2=s1;
t2=t3;
sf2= XSteam('sL_p',p2);
sg2= XSteam('sV_p',p2);
x2=(s2-sf2)/(sg2-sf2);
hf2= XSteam('hL_p',p2);
hg2= XSteam('hv_p',p2);
h2=hf2+x2*(hg2-hf2);
s4=s3;
h4= XSteam('h_ps',p4,s4);
cp4= XSteam('cp_ps',p4,s4);
cv4= XSteam('cv_ps',p4,s4);
g4=cp4/cv4;
o=(g4-1)/g4;
t4=t3*((p4/p3)^o);


wt=h1-h2; %turbine work
wp=h4-h3; %pump work

wnet=wt-wp;

qs=h1-h4;

n_per=(wnet/qs)*100;

stm_rate=3600/(wt-wp);

t5= XSteam('Tsat_p',p1);
s5= XSteam('sL_p',p1);
s6= XSteam('sV_p',p1);


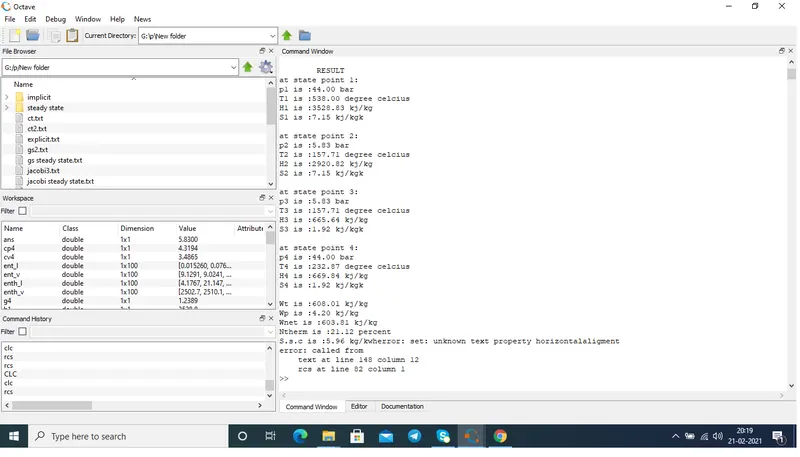
fprintf('\n\tRESULT\n')
fprintf('at state point 1:\np1 is :%4.2f bar\nT1 is :%4.2f degree celcius\nH1 is :%4.2f kj/kg\nS1 is :%4.2f kj/kgk\n\n',p1,t1,h1,s1)
fprintf('at state point 2:\np2 is :%4.2f bar\nT2 is :%4.2f degree celcius\nH2 is :%4.2f kj/kg\nS2 is :%4.2f kj/kgk\n\n',p2,t2,h2,s2)
fprintf('at state point 3:\np3 is :%4.2f bar\nT3 is :%4.2f degree celcius\nH3 is :%4.2f kj/kg\nS3 is :%4.2f kj/kgk\n\n',p3,t3,h3,s3)
fprintf('at state point 4:\np4 is :%4.2f bar\nT4 is :%4.2f degree celcius\nH4 is :%4.2f kj/kg\nS4 is :%4.2f kj/kgk\n\n',p4,t4,h4,s4)
fprintf('Wt is :%4.2f kj/kg\nWp is :%4.2f kj/kg\nWnet is :%4.2f kj/kg\nNtherm is :%4.2f percent\nS.s.c is :%4.2f kg/kwh',wt,wp,wnet,n_per,stm_rate)


temp=linspace(1,400,100);
for i=1:length(temp)
  ent_l(i)=xsteam('sL_T',temp(i));
  ent_v(i)=XSteam('sV_T',temp(i));
  enth_l(i)=XSteam('hL_T',temp(i));
  enth_v(i)=XSteam('hV_T',temp(i));
end

subplot(1,2,1)
plot([s1 s2 s3 s4 s5 s6 s1],[t1 t2 t3 t4 t5 t5 t1],'color','k','linewidth',2,'marker','o','markersize',2,'markerfacecolor','b','markeredgecolor','b')
hold on
plot(ent_l,temp,'color','r')
plot(ent_v,temp,'color','r')
axis([0 10 0 700])
text(s1,t1,'1','fontsize',15)
text(s2,t2,'2','fontsize',15)
text(s3,t3,'3','fontsize',15,'horizontalaligment','right')
text(s4,t4,'4','fontsize',15,'horizontalaligment','right')
xlabel('entropy')
ylabel('temperature')
subplot(1,2,2)
plot([s1s2 s3 s4 s1],[h1 h2 h3 h4 h1],'color','k','linewidth',2,'markersize',2,'markerfacecolor','b','markeredgecolor','b')
axis([0 10 300 5000])
hold on
plot(ent_v,enth_v,'color','r')
plot(ent_l,enth_l,'color','r')
text(s1,h1,'1','fontsize',15)
text(s2,h2,'2','fontsize',15)
text(s3,h3,'3','fontsize',15,'horizontalaligment','right','verticalalignment','top')
text(s4,h4,'4','fontsize',15,'horizontalaligment','right','verticalalignment','bottom')
xlabel('entropy')
ylabel('enthalpy')
else
  fprintf('enter temperature greater or equal to saturation temperature')
 end