Project 2 - EDA on Vehicle Insurance Customer Data
A company has customer data that contains 8 columns of customer details and another table having name customer_policy data contains the policy details of the customer.
The company intends to offer some discount in premium for certain customers. To do that they ask their Data scientist team to get some information. Hence, following tasks DS team decided to perform:
- Add the column names to both datasets:
i. Column Name for customer details table:
       customer_id,

       Gender,

       age,

       driving licence present,

       region code,

       previously insured,

       vehicle age

       and vehicle damage, in respective order.
ii. Column Name for customer_policy table:
       customer_id,

       annual premium (in Rs),

       sales channel code,

vintage and response. - Checking and Cleaning Data Quality:
i. Null values
Generate a summary of count of all the null values column wise Drop Null values for customer_id because central tendencies for id’s is not feasible. Replace all null values for numeric columns by mean. Replace all null values for Categorical value by mode. ii. Outliers
Generate a summary of count of all the outliers column wise Replace all outlier values for numeric columns by mean. (Hint1: for outlier treatment use IQR method as follows:
For example: for a column X calculate Q1 = 25th percentile and Q3 = 75th percentile then IQR = Q3 – Q1 ) then to check outlier, anything lower than a Q1 – 1.5IQR or greater than Q3 + 1.5 IQR would be an outlier
Hint2: For getting percentile value, explore pd.describe() function)
iii. White spaces
Remove white spaces iv. case correction(lower or upper, any one)
v. Convert nominal data (categorical) into dummies
for future modeling use if required vi. Drop Duplicates (duplicated rows)
- Create a Master table for future use. Join the customer table and customer_policy table to get a master table using customer_id in both tables.
(Hint: use pd.merge() function)
-
Company needs some important information from the master table to make decisions for future growth.They needs following information:
i. Gender wise average annual premium
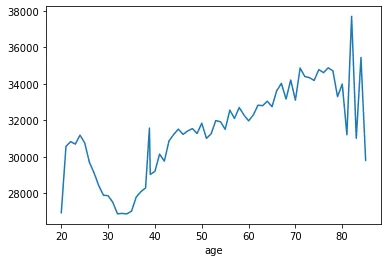
ii. Age wise average annual premium
iii. Is your data balanced between the genders?
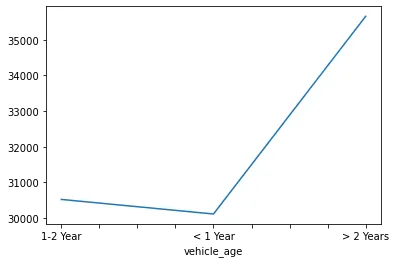
(Hint: Data is balanced if number of counts in each group is approximately same)iv. Vehicle age wise average annual premium.
- Is there any relation between Person Age and annual premium?
Hint: use correlation function (Correlation describes the relationship between two variables).
Correlation coefficient < -0.5 - Strong negative relationship
Correlation coefficient > 0.5 - Strong positive relationship
0.5 < Correlation coefficient < 0.5 - There is no relationship.
Click here for the files
import pandas as pd
# STEP 1: Reading Data
import pandas
table1 = pandas.read_csv(".\customer_details_excel\customer_details.csv")
table2 = pandas.read_csv(".\customer_details_excel\customer_policy_details.csv")
print(table1.head())
print(table2.head())
     0       1     2    3     4    5          6    7
0  1.0    Male  44.0  1.0  28.0  0.0  > 2 Years  Yes
1  2.0    Male  76.0  1.0   3.0  0.0   1-2 Year   No
2  3.0    Male  47.0  1.0  28.0  0.0  > 2 Years  Yes
3  4.0    Male  21.0  1.0  11.0  1.0   < 1 Year   No
4  5.0  Female  29.0  1.0  41.0  1.0   < 1 Year   No
     0        1      2      3    4
0  1.0  40454.0   26.0  217.0  1.0
1  2.0  33536.0   26.0  183.0  0.0
2  3.0  38294.0   26.0   27.0  1.0
3  4.0  28619.0  152.0  203.0  0.0
4  5.0  27496.0  152.0   39.0  0.0
# STEP 2: Checking and Cleaning the data
# 2.1 Null values
# 2.1.1 Table1
table1_labels={'0':'customer_id', '1':'gender', '2':'age', '3':'driving_licence_presence',
'4':'region_code', '5':'previously_insured', '6':'vehicle_age', '7':'vehicle_damage'}
# 2.1.1.1 counting the null values of each column of table1
for i in range(table1.shape[1]):
print(f"number of cells of {table1_labels[str(i)]} with null values = {table1[str(i)].isnull().sum()}")
table1.info()
# 2.1.1.2 dropping rows with null customer_id of table1
table1.dropna(subset=['0'],inplace=True)
print(f"number of cells of {table1_labels[str(0)]} with null values = {table1[str(0)].isnull().sum()}")
# 2.1.1.3 replacing all null values for numeric columns by mean of table1
for i in range(2,6):
table1[str(i)].fillna(table1[str(i)].mean(),inplace=True)
print(f"number of cells of {table1_labels[str(i)]} with null values = {table1[str(i)].isnull().sum()}")
# 2.1.1.4 replacing all null values for Categorical value by mode of table1
for i in [1,6,7]:
table1[str(i)].fillna(table1[str(i)].mode()[0],inplace=True)
print(f"number of cells of {table1_labels[str(i)]} with null values = {table1[str(i)].isnull().sum()}")
# 2.1.2 Table2
table2_labels={'0':'customer_id', '1':'annual_premium_INR', '2':'sales_channel_code', '3':'vintage',
'4':'response'}
# 2.1.2.1 counting the null values of each column of table2
for i in range(table2.shape[1]):
print(f"number of cells of {table2_labels[str(i)]} with null values is {table2[str(i)].isnull().sum()}")
table2.info()
# 2.1.2.2 dropping rows with null customer_id of table2
table2.dropna(subset=['0'],inplace=True)
print(f"number of cells of {table1_labels[str(0)]} with null values = {table2[str(0)].isnull().sum()}")
# 2.1.2.3 replacing all null values for numeric columns by mean of table2
for i in range(1,5):
table2[str(i)].fillna(table2[str(i)].mean(),inplace=True)
print(f"number of cells of {table2_labels[str(i)]} with null values = {table2[str(i)].isnull().sum()}")
number of cells of customer_id with null values = 386
<class 'pandas.core.frame.DataFrame'>
RangeIndex: 381109 entries, 0 to 381108
Data columns (total 8 columns):
 #   Column  Non-Null Count   Dtype
---  ------  --------------   -----
 0   0       380723 non-null  float64
 1   1       380741 non-null  object
 2   2       380741 non-null  float64
 3   3       380716 non-null  float64
 4   4       380717 non-null  float64
 5   5       380728 non-null  float64
 6   6       380728 non-null  object
 7   7       380702 non-null  object
dtypes: float64(5), object(3)
memory usage: 23.3+ MB
number of cells of gender with null values = 368
<class 'pandas.core.frame.DataFrame'>
RangeIndex: 381109 entries, 0 to 381108
Data columns (total 8 columns):
 #   Column  Non-Null Count   Dtype
---  ------  --------------   -----
 0   0       380723 non-null  float64
 1   1       380741 non-null  object
 2   2       380741 non-null  float64
 3   3       380716 non-null  float64
 4   4       380717 non-null  float64
 5   5       380728 non-null  float64
 6   6       380728 non-null  object
 7   7       380702 non-null  object
dtypes: float64(5), object(3)
memory usage: 23.3+ MB
number of cells of age with null values = 368
<class 'pandas.core.frame.DataFrame'>
RangeIndex: 381109 entries, 0 to 381108
Data columns (total 8 columns):
 #   Column  Non-Null Count   Dtype
---  ------  --------------   -----
 0   0       380723 non-null  float64
 1   1       380741 non-null  object
 2   2       380741 non-null  float64
 3   3       380716 non-null  float64
 4   4       380717 non-null  float64
 5   5       380728 non-null  float64
 6   6       380728 non-null  object
 7   7       380702 non-null  object
dtypes: float64(5), object(3)
memory usage: 23.3+ MB
number of cells of driving_licence_presence with null values = 393
<class 'pandas.core.frame.DataFrame'>
RangeIndex: 381109 entries, 0 to 381108
Data columns (total 8 columns):
 #   Column  Non-Null Count   Dtype
---  ------  --------------   -----
 0   0       380723 non-null  float64
 1   1       380741 non-null  object
 2   2       380741 non-null  float64
 3   3       380716 non-null  float64
 4   4       380717 non-null  float64
 5   5       380728 non-null  float64
 6   6       380728 non-null  object
 7   7       380702 non-null  object
dtypes: float64(5), object(3)
memory usage: 23.3+ MB
number of cells of region_code with null values = 392
<class 'pandas.core.frame.DataFrame'>
RangeIndex: 381109 entries, 0 to 381108
Data columns (total 8 columns):
 #   Column  Non-Null Count   Dtype
---  ------  --------------   -----
 0   0       380723 non-null  float64
 1   1       380741 non-null  object
 2   2       380741 non-null  float64
 3   3       380716 non-null  float64
 4   4       380717 non-null  float64
 5   5       380728 non-null  float64
 6   6       380728 non-null  object
 7   7       380702 non-null  object
dtypes: float64(5), object(3)
memory usage: 23.3+ MB
number of cells of previously_insured with null values = 381
<class 'pandas.core.frame.DataFrame'>
RangeIndex: 381109 entries, 0 to 381108
Data columns (total 8 columns):
 #   Column  Non-Null Count   Dtype
---  ------  --------------   -----
 0   0       380723 non-null  float64
 1   1       380741 non-null  object
 2   2       380741 non-null  float64
 3   3       380716 non-null  float64
 4   4       380717 non-null  float64
 5   5       380728 non-null  float64
 6   6       380728 non-null  object
 7   7       380702 non-null  object
dtypes: float64(5), object(3)
memory usage: 23.3+ MB
number of cells of vehicle_age with null values = 381
<class 'pandas.core.frame.DataFrame'>
RangeIndex: 381109 entries, 0 to 381108
Data columns (total 8 columns):
 #   Column  Non-Null Count   Dtype
---  ------  --------------   -----
 0   0       380723 non-null  float64
 1   1       380741 non-null  object
 2   2       380741 non-null  float64
 3   3       380716 non-null  float64
 4   4       380717 non-null  float64
 5   5       380728 non-null  float64
 6   6       380728 non-null  object
 7   7       380702 non-null  object
dtypes: float64(5), object(3)
memory usage: 23.3+ MB
number of cells of vehicle_damage with null values = 407
<class 'pandas.core.frame.DataFrame'>
RangeIndex: 381109 entries, 0 to 381108
Data columns (total 8 columns):
 #   Column  Non-Null Count   Dtype
---  ------  --------------   -----
 0   0       380723 non-null  float64
 1   1       380741 non-null  object
 2   2       380741 non-null  float64
 3   3       380716 non-null  float64
 4   4       380717 non-null  float64
 5   5       380728 non-null  float64
 6   6       380728 non-null  object
 7   7       380702 non-null  object
dtypes: float64(5), object(3)
memory usage: 23.3+ MB
number of cells of customer_id with null values = 0
number of cells of age with null values = 0
number of cells of driving_licence_presence with null values = 0
number of cells of region_code with null values = 0
number of cells of previously_insured with null values = 0
number of cells of gender with null values = 0
number of cells of vehicle_age with null values = 0
number of cells of vehicle_damage with null values = 0
number of cells of customer_id with null values is 387
<class 'pandas.core.frame.DataFrame'>
RangeIndex: 381109 entries, 0 to 381108
Data columns (total 5 columns):
 #   Column  Non-Null Count   Dtype
---  ------  --------------   -----
 0   0       380722 non-null  float64
 1   1       380763 non-null  float64
 2   2       380709 non-null  float64
 3   3       380721 non-null  float64
 4   4       380748 non-null  float64
dtypes: float64(5)
memory usage: 14.5 MB
number of cells of annual_premium_INR with null values is 346
<class 'pandas.core.frame.DataFrame'>
RangeIndex: 381109 entries, 0 to 381108
Data columns (total 5 columns):
 #   Column  Non-Null Count   Dtype
---  ------  --------------   -----
 0   0       380722 non-null  float64
 1   1       380763 non-null  float64
 2   2       380709 non-null  float64
 3   3       380721 non-null  float64
 4   4       380748 non-null  float64
dtypes: float64(5)
memory usage: 14.5 MB
number of cells of sales_channel_code with null values is 400
<class 'pandas.core.frame.DataFrame'>
RangeIndex: 381109 entries, 0 to 381108
Data columns (total 5 columns):
 #   Column  Non-Null Count   Dtype
---  ------  --------------   -----
 0   0       380722 non-null  float64
 1   1       380763 non-null  float64
 2   2       380709 non-null  float64
 3   3       380721 non-null  float64
 4   4       380748 non-null  float64
dtypes: float64(5)
memory usage: 14.5 MB
number of cells of vintage with null values is 388
<class 'pandas.core.frame.DataFrame'>
RangeIndex: 381109 entries, 0 to 381108
Data columns (total 5 columns):
 #   Column  Non-Null Count   Dtype
---  ------  --------------   -----
 0   0       380722 non-null  float64
 1   1       380763 non-null  float64
 2   2       380709 non-null  float64
 3   3       380721 non-null  float64
 4   4       380748 non-null  float64
dtypes: float64(5)
memory usage: 14.5 MB
number of cells of response with null values is 361
<class 'pandas.core.frame.DataFrame'>
RangeIndex: 381109 entries, 0 to 381108
Data columns (total 5 columns):
 #   Column  Non-Null Count   Dtype
---  ------  --------------   -----
 0   0       380722 non-null  float64
 1   1       380763 non-null  float64
 2   2       380709 non-null  float64
 3   3       380721 non-null  float64
 4   4       380748 non-null  float64
dtypes: float64(5)
memory usage: 14.5 MB
number of cells of customer_id with null values = 0
number of cells of annual_premium_INR with null values = 0
number of cells of sales_channel_code with null values = 0
number of cells of vintage with null values = 0
number of cells of response with null values = 0
{'2': (-11.0, 85.0), '3': (1.0, 1.0), '4': (-15.0, 65.0), '5': (-1.5, 2.5)}
---------------------------------------------------------------------------
KeyboardInterrupt                         Traceback (most recent call last)
~\AppData\Local\Temp/ipykernel_38940/2671604735.py in <module>
     67 for j in table1.index:
     68     for i in range(2,6):
---> 69         if (table1_limits[str(i)][0]!=table1_limits[str(i)][1]) and (table1.loc[j, str(i)]>table1_limits[str(i)][1] or table1.loc[j, str(i)]<table1_limits[str(i)][0]):
     70             table1_outliers[str(i)]+=1
     71

~\anaconda3\lib\site-packages\pandas\core\indexing.py in __getitem__(self, key)
    922             if self._is_scalar_access(key):
    923                 with suppress(KeyError, IndexError):
--> 924                     return self.obj._get_value(*key, takeable=self._takeable)
    925             return self._getitem_tuple(key)
    926         else:

~\anaconda3\lib\site-packages\pandas\core\frame.py in _get_value(self, index, col, takeable)
   3578         try:
   3579             loc = engine.get_loc(index)
-> 3580             return series._values[loc]
   3581         except AttributeError:
   3582             # IntervalTree has no get_loc

~\anaconda3\lib\site-packages\pandas\core\series.py in _values(self)
    672         return self._mgr.external_values()
    673
--> 674     @property
    675     def _values(self):
    676         """

KeyboardInterrupt:
# 2.2 Outliers
# 2.2.1 Table1
table1_limits = {}
for i in range(2,6):
computations = table1[str(i)].describe(percentiles=[.25, .75])
mean = computations.values[1]
Q1 = computations.values[4] # 25%
Q3 = computations.values[6] # 75%
IQR = Q3-Q1
ll = Q1 - 1.5*IQR # lower limit
hl = Q3 + 1.5*IQR # higher limit
table1_limits[str(i)] = (ll,hl)
table1_limits
print(table1_limits)
{'2': (-11.0, 85.0), '3': (1.0, 1.0), '4': (-15.0, 65.0), '5': (-1.5, 2.5)}
# 2.2.1.1 generating a summary of count of all the outliers column wise of table1 (only for numeric columns)
table1_outliers = {'2':0, '3':0, '4':0, '5':0}
for j in table1.index:
for i in range(2,6):
if (table1_limits[str(i)][0]!=table1_limits[str(i)][1]) and (table1.loc[j, str(i)]>table1_limits[str(i)][1] or table1.loc[j, str(i)]<table1_limits[str(i)][0]):
table1_outliers[str(i)]+=1
table1_outliers
# 2.2.1.2 replacing all outlier values for numeric columns by mean for table 1
# though as can be seen above, there are no outliers at all!, anyways the code is following
for j in table1.index:
for i in range(2,6):
if table1.loc[j, str(i)]<table1_limits[str(i)][0]:
table1.loc[j, str(i)]=table1[str(i)].mean()
if table1.loc[j, str(i)]>table1_limits[str(i)][1]:
table1.loc[j, str(i)]=table1[str(i)].mean()
# 2.2.2 Table2
table2_limits = {}
for i in range(1,5):
computations = table2[str(i)].describe(percentiles=[.25, .75])
mean = computations.values[1]
Q1 = computations.values[4] # 25%
Q3 = computations.values[6] # 75%
IQR = Q3-Q1
ll = Q1 - 1.5*IQR # lower limit
hl = Q3 + 1.5*IQR # higher limit
table2_limits[str(i)] = (ll,hl)
table2_limits
# 2.2.2.1 generating a summary of count of all the outliers column wise of table2 (only for numeric columns)
table2_outliers = {'1':0, '2':0, '3':0, '4':0, '5':0}
for j in table2.index:
for i in range(1,5):
if (table2_limits[str(i)][0]!=table2_limits[str(i)][1]) and (table2.loc[j, str(i)]>table2_limits[str(i)][1] or table2.loc[j, str(i)]<table2_limits[str(i)][0]):
table2_outliers[str(i)]+=1
table2_outliers
# 2.2.2.2 replacing all outlier values for numeric columns by mean for table 2
for j in table2.index:
for i in range(1,5):
if table2.loc[j, str(i)]<table2_limits[str(i)][0]:
table2.loc[j, str(i)]=table2[str(i)].mean()
if table2.loc[j, str(i)]>table2_limits[str(i)][1]:
table2.loc[j, str(i)]=table2[str(i)].mean()
# 2.3.1 Remove Whitespaces for table1
table1.apply(lambda x: x.str.strip() if x.dtype == "object" else x)
# 2.3.2 Remove Whitespaces for table2
table2.apply(lambda x: x.str.strip() if x.dtype == "object" else x)
# 2.4.1 case correction for table1
table1.apply(lambda x: x.str.lower() if x.dtype == "object" else x)
# 2.4.2 case correction for table2
table2.apply(lambda x: x.str.lower() if x.dtype == "object" else x)
# 2.5.1 converting categorical data into dummy variables for table1
# 2.5.2 converting categorical data into dummy variables for table2
# 2.6.1 dropping duplicate rows for table1
table1.drop_duplicates(inplace=True)
# 2.6.2 dropping duplicate rows for table2
table2.drop_duplicates(inplace=True)
# STEP3: Creating a master table
data = pandas.merge(table1, table2, on='0',)
labels={'0':'customer_id', '1_x':'gender', '2_x':'age', '3_x':'driving_licence_presence',
'4_x':'region_code', '5':'previously_insured', '6':'vehicle_age', '7':'vehicle_damage',
'1_y':'annual_premium_INR', '2_y':'sales_channel_code', '3_y':'vintage', '4_y':'response'}
data.rename(columns=labels, inplace=True)
data
| customer_id | gender | age | driving_licence_presence | region_code | previously_insured | vehicle_age | vehicle_damage | annual_premium_INR | sales_channel_code | vintage | response | |
|---|---|---|---|---|---|---|---|---|---|---|---|---|
| 0 | 1.0 | Male | 44.0 | 1.0 | 28.0 | 0.0 | > 2 Years | Yes | 40454.0 | 26.0 | 217.0 | 1.0 |
| 1 | 2.0 | Male | 76.0 | 1.0 | 3.0 | 0.0 | 1-2 Year | No | 33536.0 | 26.0 | 183.0 | 0.0 |
| 2 | 3.0 | Male | 47.0 | 1.0 | 28.0 | 0.0 | > 2 Years | Yes | 38294.0 | 26.0 | 27.0 | 1.0 |
| 3 | 4.0 | Male | 21.0 | 1.0 | 11.0 | 1.0 | < 1 Year | No | 28619.0 | 152.0 | 203.0 | 0.0 |
| 4 | 5.0 | Female | 29.0 | 1.0 | 41.0 | 1.0 | < 1 Year | No | 27496.0 | 152.0 | 39.0 | 0.0 |
| ... | ... | ... | ... | ... | ... | ... | ... | ... | ... | ... | ... | ... |
| 380331 | 381105.0 | Male | 74.0 | 1.0 | 26.0 | 1.0 | 1-2 Year | No | 30170.0 | 26.0 | 88.0 | 0.0 |
| 380332 | 381106.0 | Male | 30.0 | 1.0 | 37.0 | 1.0 | < 1 Year | No | 40016.0 | 152.0 | 131.0 | 0.0 |
| 380333 | 381107.0 | Male | 21.0 | 1.0 | 30.0 | 1.0 | < 1 Year | No | 35118.0 | 160.0 | 161.0 | 0.0 |
| 380334 | 381108.0 | Female | 68.0 | 1.0 | 14.0 | 0.0 | > 2 Years | Yes | 44617.0 | 124.0 | 74.0 | 0.0 |
| 380335 | 381109.0 | Male | 46.0 | 1.0 | 29.0 | 0.0 | 1-2 Year | No | 41777.0 | 26.0 | 237.0 | 0.0 |
380336 rows × 12 columns
# STEP4: getting information
# 4.1 Gender wise average annual premium
data.groupby('gender')['annual_premium_INR'].mean()
# 4.2 Age wise average annual premium
result4_2 = data.groupby('age')['annual_premium_INR'].mean()
import matplotlib.pyplot as pyplot
result4_2.plot()
pyplot.show()
# 4.3 Is your data balanced between the genders?
print(f"male to female ration is {round(data['gender'].value_counts()[0]/data['gender'].value_counts()[1],2)}")
print(f"generally, the standard is: \n balanced data ratio: {50/50}\n slightly balanced data ratio: {round(55/45,2)}-{60/40} \n imbalanced data ratio: {80/20}-{90/10}")
# 4.4 Vehicle age wise average annual premium.
result4_4 = data.groupby('vehicle_age')['annual_premium_INR'].mean()
import matplotlib.pyplot as pyplot
result4_4.plot()
pyplot.show()
male to female ration is 1.18
generally, the standard is:
 balanced data ratio: 1.0
 slightly balanced data ratio: 1.22-1.5
 imbalanced data ratio: 4.0-9.0
# STEP5: Is there any relation between Person Age and annual premium?
n = data['age'].corr(data['annual_premium_INR'])
if n<-0.5:
print("Strong negative relationship")
if n>0.5:
print("Strong positive relationship")
if n>-0.5 and n<0.5:
print("There is no relationship!")
There is no relationship!