Project 2 - Design and Development of Pulse Oximeter (Medical Technology)
Task-1>
The global pulse oximeter market size was valued at USD 2.3 billion in 2020 and is expected to expand at a compound annual growth rate (CAGR) of 6.4% from 2021 to 2028. Rising awareness regarding applications of pulse oximeters in COVID-19 management and the increasing prevalence of target diseases is expected to drive the growth of the market.Figure-1.
Availability of new products and high unmet needs in developing and least-developed economies are expected to boost market growth over the forecast period. Around 43 states in the U.S. have made pulse oximetry mandatory for newborn screening and is gaining popularity in other countries due to applications in the detection of Congenital Heart Defects (CHD) and other heart and respiratory conditions.
The growing prevalence of target diseases such as asthma, hyperlipidemia, hypertension, diabetes, ischemic conditions, cardiac arrhythmia, sleep apnea, and COPD is expected to be a major market driver over the forecast period. According to the WHO, around 64 million patients are currently living with COPD worldwide with approximately 90% of deaths due to COPD occurring in low- and middle-income countries.
High-quality pulse oximeters are critical for the early diagnosis and treatment of patients with COVID-19. The manufacturing and supply chains of pulse oximeters are expected to witness challenges during this period, as most of the companies are working at half their production capacities. Furthermore, trade restrictions across highly impacted countries are expected to limit the timely distribution of products. However, manufacturers are working to ensure an adequate supply of fingertip and handheld pulse oximeters to countries in dire need, as cases of COVID-19 continue to increase at an exponential rate.
Type Insights
The handheld segment dominated the market for the pulse oximeter and accounted for the largest revenue share of 38.9% in 2020. The market is primarily driven by the fact that these oximeters are easy to use in case of emergencies. The oxygen saturation level of a patient can strongly influence the course of treatment. A rise in the number of stroke cases and surgeries is anticipated to boost market growth over the forecast period.
Technological advancements in oximeters are expected to drive the segment. Added features such as easy transfer of data, extensive memory, alarm system, and Bluetooth increase the efficiency of products. Industry players introduce new products with additional features to sustain in the competitive market. For instance, in August 2015, Nonin Medical, Inc. launched a wireless fingertip oximeter operated via Bluetooth-NoninConnect Model 3230.
The COVID-19 pandemic has restricted the visits to medical facilities hindering medical care services, and manufacturers are innovating products to provide alternative telehealth solutions. In January 2021, Tyto Care, a telehealth company launched a fingertip pulse oximeter that connects to the TytoCare device via a cable to logging test results to patients EHR enabling its remote monitoring by clinicians.
Report Coverage & Deliverables
Figure-2.
End-use Insights
The hospitals and other healthcare facilities segment dominated the pulse oximeter market and accounted for the largest revenue share of 82.0% in 2020 due to an increase in the number of surgeries and emergency room visits. Long-term care facilities are at high risk of COVID-19 infections, and residents are being continuously monitored for symptoms by checking vital respiratory parameters. Thus, demand for pulse oximeters from home healthcare centers and long-term care facilities is expected to increase during the COVID-19 pandemic.
The homecare segment is expected to witness lucrative growth during the forecast period due to factors such as increasing awareness regarding the importance of monitoring oxygen levels. Fingertip pulse oximeters are considered affordable and effective in homecare, as they can help track and store a patient’s oxygen level readings, which can help reduce the risk of readmission to a hospital. In addition, spot-checking is an effective way for patients suffering from COPD and CHD. Moreover, self-monitoring helps patients actively participate in the management of their health. With an increase in the aging population, the incidence of chronic pulmonary and cardiac conditions is expected to rise. This is anticipated to augment the need for monitoring devices, such as pulse oximeters, in home settings.
Regional Insights
North America dominated the market for the pulse oximeter and held the largest revenue share of 49.1% in 2020, owing to increasing awareness regarding the importance of monitoring respiratory vitals among the common population. Current Procedural Terminology (CPT) recognizes three codes for reimbursement of pulse oximeters: 94760, 94761, and 94762. As the use of pulse oximeter is considered supplementary by Medicare, it is typically reimbursed along with a primary service.
Moreover, for outpatients and patients opting for home settings, a pulse oximeter is considered a reasonable necessity and reimbursed after proper documentation. Thus, a favorable reimbursement infrastructure is expected to contribute to market growth. Moreover, the health organizations are updating medical practitioners with research related to COVID-19 to assist in better management of the pandemic situation. In interim clinical guidance published in February 2021, CDC reported the probability of pulse oximeters having sub-optimal accuracy in dark skin patients.Figure-3.
Recent changes in regulatory norms in Europe are expected to affect all medical device manufacturers. Although factors such as modifications in labeling requirements and changes in rules and regulations pertaining to the distribution of medical devices may slow down the approval process, in the long run, they may result in benefits to approved products, such as improvement in quality and reduction in the number of product recalls.
In Asia Pacific, market players are recognizing the potential and introducing new products suited for developing economies of the region. In January 2017, Masimo launched Rad-97 Pulse-CO Oximeter in India. The product was intended to improve CHD screening in neonates. Although Asia Pacific has a slightly declining birth rate, the number of infants born every day is considerably large. This results in a large target population for CHD.
Key Companies & Market Share Insights
The market is fragmented with the presence of various global and regional manufacturers. The market is expected to adopt various strategies such as product launches and acquisitions by key players to expand their market share. For instance, in January 2020, Vyaire Medical made its MX40-a reusable telemetry adapter-commercially available in the U.S. This product features a SpO2 port, which is compatible with Philips 9 pin pulse oximeter sensor and Masimo LNCS pulse oximeter.
Key industry players are undertaking other major initiatives, such as licensing agreements and strategic partnerships, to strengthen their market presence. In November 2016, the company entered into a partnership with Masimo and withdrew all pending lawsuits against the company. It was also relieved by Masimo from paying the USD 467 million jury verdict. Some of the prominent players in the pulse oximeter market include:
-
Medtronic (Covidien)
-
Carefusion Corp.
-
GE Healthcare
-
Philips Healthcare
-
Masimo
-
CAS Medical Systems, Inc.
-
Opto Circuits India Ltd.
-
Nonin Medical, Inc.
-
Smiths Medical
-
Welch Allyn
-
Spacelabs Healthcare
-
Meditech Equipment Co.
-
Nihon Kohden Corporation
Pulse Oximeter Market Report Scope
|
Report Attribute |
Details |
|
Market size value in 2021 |
USD 2.2 billion |
|
Revenue forecast in 2028 |
USD 3.4 billion |
|
Growth Rate |
CAGR of 6.4% from 2021 to 2028 |
|
Base year for estimation |
2020 |
|
Historical data |
2016 - 2019 |
|
Forecast period |
2021 - 2028 |
|
Quantitative units |
Revenue in USD Million and CAGR from 2021 to 2028 |
|
Report coverage |
Revenue forecast, company ranking, competitive landscape, growth factors, and trends |
|
Segments covered |
Type, end-use, region |
|
Regional scope |
North America; Europe; Asia Pacific; Latin America; Middle East & Africa |
|
Country scope |
U.S.; Canada; U.K.; Germany; France; Italy; Spain; China; Japan; India; Brazil; Mexico; South Africa |
|
Key companies profiled |
Medtronic (Covidien); Carefusion Corp.; GE Healthcare; Philips Healthcare; Masimo; CAS Medical Systems, Inc.; Opto Circuits India Ltd.; Nonin Medical, Inc.; Smiths Medical; Welch Allyn; Spacelabs Healthcare; Meditech Equipment Co., and Nihon Kohden Corporation |
|
Customization scope |
Free report customization (equivalent to up to 8 analyst’s working days) with purchase. Addition or alteration to country, regional & segment scope. |
|
Pricing and purchase options |
Avail customized purchase options to meet your exact research needs. Explore purchase options |
Segments Covered in the Report
This report forecasts revenue growth at the global, regional, and country levels and provides an analysis of the latest industry trends in each of the sub-segments from 2016 to 2028. For the purpose of this study, Grand View Research has segmented the global pulse oximeter market report on the basis of type, end-use, and region:
-
Type Outlook (Revenue, USD Million, 2016 - 2028)
-
Fingertip
-
Handheld
-
Others
-
-
End-use Outlook (Revenue, USD Million, 2016 - 2028)
-
Hospitals & Other Healthcare Facilities
-
Homecare
-
-
Regional Outlook (Revenue, USD Million, 2016 - 2028)
-
North America
-
U.S.
-
Canada
-
-
Europe
-
U.K.
-
Germany
-
France
-
Italy
-
Spain
-
-
Asia Pacific
-
China
-
Japan
-
India
-
Latin America
-
Brazil
-
Mexico
-
-
Middle East & Africa (MEA)
-
South Africa
-
-
Task-2>
Traditionally, peripheral blood oxygen saturation (SpO2) is a measurement taken at the peripherals of the body on the finger or ear, most commonly with a clip device to determine the ratio of oxygen saturated hemoglobin to total hemoglobin. This measurement is used to tell how well red blood cells are transporting oxygen from the lungs to other parts of the body. Normal SpO2 levels vary from 95% to 100% in a healthy adult. Levels below this range indicate a condition known as hypoxemia. This means that the body is not transporting enough oxygen to maintain healthy organs and cognitive function.
A person suffering from hypoxemia may experience dizziness, confusion, shortness of breath, and headaches. Several medical conditions can cause poor blood oxygenation and may require continuous or intermittent monitoring at home or in a clinical setting.
SpO2 is one of the most common vital signs recorded within a clinical setting. Some conditions that require continuous SpO2 monitoring include asthma, heart disease, COPD, lung disease, pneumonia, and COVID-19 induced hypoxia.
One of the ways to determine whether symptomatic COVID-19 patients need hos-pitalization is by monitoring their SpO2 levels. If those levels fall below the baseline number (usually under 92%), they need to be checked into an emergency room.
The Recent Link Between COVID-19 and Hypoxia
Very recently, COVID-19 patients have been diagnosed with a particularly insidious condition known as silent hypoxia. Silent hypoxia can do severe damage to the body before any of the typical COVID-19 respiratory symptoms, like shortness of breath, occur. An article on the National Center for Biotechnology Information website1 states “the ability to detect this silent form of hypoxia in COVID-19 patients before they begin to experience shortness of breath is critical for preventing the pneumonia from progressing to a dangerous level.”
SpO2 monitoring is also a key indicator in diagnosing sleep apnea. Obstructive sleep apnea causes the airways to become partially or fully blocked during sleep. This can be observed as long pauses in breathing or periods of shallow breathing causing temporary hypoxia. If untreated over time, sleep apnea can increase the likelihood of heart attack, stroke, and obesity. It is estimated that sleep apnea affects between 1% to 6% of the total adult population.
The Urgent Need for a Better Pulse Oximeter Now and in the Future
As patient care trends toward ambulatory and in-home monitoring, there is a need to develop vital sign monitoring devices that will not impede users from completing daily tasks. In the case of SpO2, monitoring areas other than the finger and ear will present a host of design challenges. The recent emergence of silent hypoxia makes the case for development of more portable clinical-grade pulse oximeter units even more compelling.
This article will explain some of the fundamental principles of SpO2 measurement and introduce ADI’s latest generation of optical AFEs, the ADPD4100 and ADPD4101, which reduce design complexities for medical grade SpO2 devices. Built-in high performance automatic ambient light rejection reduces the burden on mechanical and electronic design. The high dynamic range in the ADPD4100 at lower power consumption reduces the number of photodiodes or LED current in a design to determine slight variations in patient SpO2 level efficiently. Finally, digital integrator options allow users to enter an extremely efficient power consumption mode to enable longer run times in portable PPG solutions by disabling analog blocks in the optical signal path.
What Is Oxygen Saturation?
Oxygen saturation is the percentage of oxygen saturated hemoglobin within the blood with respect to the total available hemoglobin. The gold standard for measuring oxygen saturation is the atrial blood oxygenation measurement, SaO2. However, this method requires laboratory-based blood gas analysis of a blood sample. The calibration section covers this in greater depth.
SpO2 is an estimate of the oxygen saturation levels measured at the peripherals of the body, using a pulse oximeter. Until recently, the most common way to measure oxygen saturation has been to use a pulse oximeter positioned on the finger.
How Does a Pulse Oximeter Work?
A pulse oximeter works on the principal that absorption of light in oxygenated hemoglobin (HbO2) and deoxygenated hemoglobin (RHb) differ significantly at specific light wavelengths. Figure 1 shows the extinction coefficient of HbO2, Hb, and methemoglobin (MetHb) across the visible and infrared light spectrum. The extinction coefficient is a measurement of how strongly a chemical substance absorbs light at a given wavelength. From Figure 1, it can be seen that HbO2 absorbs more red light (600 nm) and allows more infrared light (940 nm) to pass through. RHb absorbs more light at infrared wavelengths, which allows more red light to pass through than in HbO2.
The most basic pulse oximeter consists of two LED (one red 660 nm LED and one infrared (IR) 940 nm LED) and a single photodiode (PD) in a reflective or transmissive configuration (see Figure 4). The pulse oximeter will pulse the red LED and measure the resulting signal on the PD. Repeat this for the IR LED and finally with both LEDs off to get a baseline for any ambient external light sources. This generates a photoplethysmography (PPG) signal for both wavelengths.
Figure-4.
Extinction factor of light through hemoglobin.
Figure-5.Basic pulse oximeter circuit.
The signal contains DC and AC components. The DC component is due to constant reflective matter such as skin, muscle and bone, and venous blood. When a body is at rest and motion is less of a factor, the AC component comprises mainly of reflected light from the pulsation of artery blood. The AC component depends on heart rate and artery thickness, with more reflected or transmitted light in systolic (pump) than the dystopic (relaxation). During the systolic phase, blood is pumped from the heart, which increases atrial blood pressure. The increase in blood pressure expands the arteries and leads to an increase in atrial blood volume. This increase in blood causes an increase in light absorption. Blood pressure drops during the diastolic phase and therefore so does the absorption of light. Figure 3 shows the diastolic trough and systolic peaks caused by the beating heart.


The Beer-Lambert law explains that light decays exponentially when travelling though absorptive material. This can be used to determine the level of oxygenated hemoglobin to total hemoglobin.
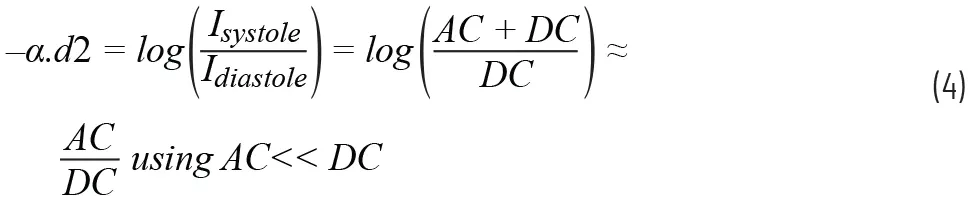
The intensity of light absorbed at the diastole and systole are related by:

Where α measures the absorption rate of light in atrial blood and d2 is the AC amplitude of the PPG signal (see Figure 3). Idiastole is equal to the DC component labelled d1.
Light attenuation through tissue. Figure-6.
By computing AC and DC from a PPG signal, we are able to determine the change in absorption of light in atrial blood –α.d2 caused by blood pumping from the heart, with no contribution from other tissue.
The ratio of the AC component to the DC component is known as the perfusion index, which is the ratio of the pulsating blood flow to the nonpulsatile static blood flow. The goal of a PPG-based heart rate or SpO2 measurement system is to increase the AC to DC signal ratio.
PI = AC/DC
The perfusion index for infrared and red wavelengths can be used to calculate the ratio of ratios (RoR), which is the ratio of PIred to PLir. As the absorption of the light at a given wavelength is proportional to the

In theory, the RoR can be substituted into the following formula to compute SpO2:

Where: EHbO2,red = extinction coefficient of HbO2 at 600 nm, EHbO2,ired = extinction coefficient of HbO2 at 940 nm
ERHb,ired = extinction coefficient of RHb at 940 nm, ERHb,red = extinction coefficient of RHb at 600 nm
However, the Beer-Lambert law cannot be used directly as there are a number of variable factors in every optical design that cause variations to the RoR to SpO2 relationship. These include mechanical baffle design, LED to PD spacing, electronic and mechanical ambient light rejection, PD gain errors, and many more.
To obtain clinical grade accuracy from a PPG-based SpO2 pulse oximeter, a lookup table or algorithm must be developed for the correlation between RoR and SpO2.
Calibration
Calibration of the measurement system is required to develop a high accuracy SpO2 algorithm. To calibrate an SpO2 system, a study must be completed where a participant’s blood oxygen levels are medically reduced, monitored, and overseen by a medical professional. This is known as a hypoxia study.
The SpO2 measurement system can only be as accurate as the reference. Reference options include medical grade finger clip pulse oximeters and the gold standard co-oximeter. The co-oximeter is an invasive method of measuring the oxygen saturation of blood that yields high accuracy, but in most cases is not convenient to administer.
The calibration process is used to generate a best fit curve of RoR value calculated from the optical SpO2 device to the co-oximeter SaO2 measurement. This curve is used to generate a lookup table or equation for calculating SpO2.
Calibration will be required for all SpO2 designs as RoR is dependent on a number of variables such as LED wavelength and intensity, PD response, body placement, and ambient light rejection, which will differ with each design.
An increased perfusion index and, in turn, a high AC dynamic range on the red and IR wavelengths will increase the sensitivity of the RoR calculation and, in turn, return a more accurate SpO2 measurement.
During a hypoxia study, 200 measurements equally spaced between 100% and 70% blood oxygen saturation need to be recorded. Subjects are chosen with a variety of colored skin tone, and an equal spread of age and gender. This variation in skin tone, age, and gender accounts for differing perfusion index results from a spread of individuals.
The overall error for transmissive pulse oximeters must be ≤3.0% and ≤3.5% for reflective configuration.
Design Considerations:
Transmissive vs. Reflective
A PPG signal can be obtained using a transmissive or reflective LED and PD configuration. A transmissive configuration measures the nonabsorbed light passed through a part of the body. This configuration is best suited to areas such as the finger and earlobe where measurement benefits from the capillary density of these body locations, which make the measurements more stable, repetitive, and less sensitive to variations in placement. Transmissive configurations achieve a 40 dB to 60 dB increase in the perfusion index.
Reflective PPG configurations are chosen when the PD and LED must be placed next to each other for practicality, such as with wrist- or chest-worn devices.
Figure-7.
LED-PD configuration.
Sensor Positioning and Perfusion Index
Positioning on the wrist and chest require greater dynamic range in the PPG AFE as the DC signal is greatly increased due to the depth of the arteries below static reflective components such as skin, fat, and bone.
Greater resolution in the PPG measurements will reduce the uncertainty in the SpO2 algorithm. With a typical PI of 1% to 2% for wrist-worn SpO2 sensors, the goal of pulse oximeter design is to increase the PI through mechanical design or to increase the dynamic range.
The spacing of the LED to PD will have a major effect on the PI. Too little spacing will increase LED to PD crosstalk or backscatter. This will appear as a DC signal and saturate the AFE.
Increasing this spacing reduces the effect of both backscatter and crosstalk but also reduces the current transformer ratio (CTR), which is the LED output to PD return current. This will affect the efficiency of the PPG system and require greater LED power to maximize the AFE dynamic range.
Rapidly pulsing one or multiple LEDs has the benefit of reducing the 1/f noise contribution to the overall signal. Pulsing the LEDs also makes it possible to use synchronized modulation at the receive side to cancel out ambient light interferers. Integrating multiple pulses increases the PD signal amplitude and lowers the average current consumption. Increasing the total PD area also increases CTR as more of the reflective light is captured.
For heart rate PPG measurement, a combination of a single large PD and multiple power efficient green LEDs has been adopted by many HR device manufacturers to be used on places where there is limited blood flow. Green LEDs are chosen due to their high rejection of motion artifacts.2 However, this comes at the cost of power. Green LEDs have a higher forward voltage than red and IR and high absorbance in human tissue, meaning a higher LED power is required to return meaningful cardiac information.
As SpO2 requires multiple wavelengths and most systems still incorporate high efficiency green LEDs for the HR PPG, the most common configuration for HR and SpO2 PPG systems is a single green, red, and IR LED array surrounded by multiple PDs, as seen on the ADI VSM watch in Figure 5. PD to LED spacing has been opti-mized to reduce backscatter and the baffle design reduces LED to PD crosstalk.
Multiple prototypes of the ADI VSM watch were trialed to verify the most efficient PD to LED spacing for our HR PPG and SpO2 measurement.
Figure-8.
ADI VSM watch V4, baffle, and LED DP array
Motion Artifacts
Motion artifacts provide one of the greatest design challenges to a PPG measurement system. When motion is present, the width of the arteries and veins change due to pressure. The amount of light absorbed by the photodiode changes and this is present on the PPG signal because photons are absorbed or reflected differently than when a body is at rest.
For an infinitely wide photodiode area covering an infinitely long deep tissue sample, all photons will eventually be reflected to the photodiode. In this case, no artifact due to motion will be detected. This, however, cannot be achieved; the solution is to increase the photodiode area while taking capacitance into account—lowering AFE and providing filtering for motion artifacts.
The normal frequency for a PPG signal is between 0.5 Hz to 5 Hz while motion artefacts are typically between 0.01 Hz to 10 Hz. Simple band-pass filtering techniques cannot be used to remove motion artifacts from the PPG signal. To achieve high accuracy motion cancellation, an adaptive filter needs to be supplied with highly accurate motion data. For this purpose, Analog Devices has developed the ADXL362 3-axis accelerometer. This accelerometer provides 1 mg resolution with up to 8 g of range while consuming only 3.6 μW at 100 Hz and is available in a 3 mm × 3 mm package.
ADI Solution: ADPD4100
The positioning of the pulse oximeter generates several challenges. Wrist-worn SpO2 devices provide additional design challenges as the AC signal of interest is only 1% to 2% of the total received light on the PD. To achieve medical grade certification and distinguish between slight variations in oxyhemoglobin levels, a higher dynamic range on the AC signal is required. This can be achieved by reducing ambient light interference and decreasing LED driver and AFE noise. ADI has addressed this problem with the ADPD4100.
The ADPD4100 and ADPD41001 achieve up to 100 dB SNR. This increased dynamic range is essential to measure SpO2 under low perfusion scenarios. This integrated optical AFE has eight onboard low noise current sources and eight separate PD inputs. The digital timing controller has 12 programmable timing slots that enable the user to define an array of PD and LED sequences with specific LED current, analog and digital filtering, integration options, and timing constraints.
A key benefit of the ADPD4100 is the increase in SNR/μW, which is an important parameter for battery-powered continuous monitoring. This key metric has been addressed by increasing the AFE dynamic range while also lowering the AFE current consumption. The ADPD4100 now boasts a total power consumption of only 30 μW for a 75 dB, 25 Hz continuous PPG measurement including the LED supply. Increasing the number of pulses per sample (n) will result in a (√n) increase in SNR while increasing the LED drive current will have a proportional increase in SNR. 1 μW total system consumption will return 93 dB SNR for a continuous PPG measurement using a 4 V LED supply.
Automatic ambient light rejection reduces the burden on the host microprocessor while achieving 60 dB of light rejection. This is achieved using LED pulses as fast as 1 μs in conjunction with a band-pass filter to reject interference. In certain operating modes, the ADPD4100 automatically calculates the photodiode dark current or LED off state. This result is subtracted from the LED on state before conversion in the ADC to remove ambient light as well as gain errors and drift within the photodiode.
The ADPD4100 is supported with the EVAL-ADPD4100-4101 wearable evaluation kit along with the ADI Vital Signs Monitoring Study Watch. This hardware seamlessly connects to the ADI Wavetool application to enable bioimpedance, ECG, PPG heart rate, and multiwavelength PPG measurements for SpO2 development.
Embedded in the study watch is an automatic gain control (AGC) algorithm for the ADPD4100 that tunes the TIA gain and LED current to deliver optimum AC signal dynamic range for all LED wavelengths selected.
ADPD410X block diagram.Figure-9.
ADPD4100 simultaneous red (right) and IR (left) PPG measurement. Figure-10.
Alternative ADI Solutions
Finger- and earlobe-based SpO2 readings are the easiest to design for as the signal-to-noise ratio is higher than wrist- or chest-based positioning due to the reduction in bone and tissue, which also reduces the DC component contribution.
For such applications, the ADPD144RI module and the ADPD1080 are suitable devices.
The ADPD144RI is a complete module with an integrated red 660 nm LED and 880 nm IR LED and four PDs in a 2.8 mm × 5 mm package. The spacing between the LEDs and PD have been optimized to give the best signal-to-noise ratio for SpO2 high accuracy PPG measurements. This module allows users to quickly skip the design challenges associated with LED and PD placement and spacing to achieve optimal power to noise ratios. The ADPD144RI mechanically has been optimized to reduce optical crosstalk as much as possible. This provides a solid solution, even when the sensor is placed under a single glass window.
The ADPD1080 is an integrated optical AFE with three LED drive channels and two PD current input channels in a 17-ball, 2.5 mm × 1.4 mm WLLCSP. This AFE is ideal for custom design low channel count PPG products where board space is critical.
Task-3>
1>
Figure-1.
2>
Figure-2.
Modular versus Integral Product Architecture: the arrangement where functions of the product are done by an array of parts that need not be organized or arranged in assemblies are described by the integral design whereas in the modular design particular functions necessary for achieving the overall purpose
3>
Pulse oximeter.
Task-4>
Figure-3.
Failure Mode And Effects Analysis
FMEA is mostly used by upper management or stakeholders. In practice, the testers get little insight into this technique. But now the trend is changing and I feel if the testers understand this concept properly, they can drive their thought process of writing test cases to one level up by utilizing this technique to:
- Understand the stakeholder’s goals of testing the application.
- Understand the business.
- Derive the high-level test scenarios based on business and management interest.
- Derive effective test cases that provide better coverage to the risk-prone areas.
- Prioritize the test cases.
- Decide what to test and what to defer at any phase.
Background
RISK ANALYSIS is a crucial aspect of Test Management. The question then arises – What is Risk Analysis? And why is it important? To understand this, it is vital to understand – what is RISK?
See Also => Types of Risks in Software Projects.
RISK as its literal meaning is a possibility of a negative or undesirable outcome or event. Risks if not handled or managed properly may lead to poor quality, unsatisfied customers and sometimes loss of business.
Risk has 2 attributes:
- Probability
- Impact
Probability means the chances of a particular risk to occur and impact means the extent of the effect of the risk.
What Is Risk Analysis?
Risk Analysis is a mechanism by which the identified potential risks are analyzed & studied thoroughly in order to find the probability and impact. It is advisable to measure the two attributes and based on the result we identify:
- What to test first?
- What to test more?
- What not to test(This time)?
There are many methods of doing the Risk Analysis and they are broadly classified into two types:
- Informal Techniques: These are based on experience, judgment, and intuition.
- Formal Techniques: Identifying and weighing risk attributes.
Failure Mode And Effects Analysis (FMEA): This is a formal method of doing a Risk Analysis. In the following sections, I will be discussing more on FMEA and try to elaborate it with the example.
FMEA is a formal technique of doing Risk Analysis. It is a systematic and quantitative tool in the form of a Spread Sheet that assists the members to analyze what might get wrong. To do the FMEA we require the right people on the table. It requires a representative from all walks of the industry including customers.
Description
FMEA starts and continues with Brainstorming sessions. Participants need to identify all the components, modules, dependencies, limitations that could fail in a production environment and eventually lead to poor quality, reliability and may result in loss of business.
During FMEA we not only identify the extent of the loss but also try to identify the cause of those failures. To measure FMEA, we require 3 attributes:
- Severity of the Failure (S)
- Priority of the Failure (P)
- Likelihood of the Failure (L)
We put each of these attributes in a scale shown below:
Severity Scale:
| Description | Class | Scale |
| Loss of data, hardware or safety issues | Urgent | 1 |
| Loss of functionality without a workaround | High | 2 |
| Loss of functionality with a workaround | Medium | 3 |
| Partial loss of functionality | Low | 4 |
| Cosmetic or trivial | None | 5 |
Priority scale:
| Description | Class | Scale |
| Complete loss of system value | Urgent | 1 |
| Unacceptable loss of system value | High | 2 |
| Possibly reduction in the system value | Medium | 3 |
| Acceptable reduction of system value | Low | 4 |
| A negligible reduction in the system value | None | 5 |
Likelihood scale:
| Description | Class | Scale |
| Certain to effect all users | Urgent | 1 |
| Likely to impact some users | Very High | 2 |
| Possible impact on some users | High | 3 |
| Limited impact to a few users | Low | 4 |
| Unimaginable in actual usage | None | 5 |
All these three attributes (Severity, Priority, and Likelihood) are individually measured in scale and then multiplied to get a Risk Priority Number (RPN).
i.e. Risk Priority Number (RPN) = S*P*L
Based on this RPN value, we determine the extent of testing. Lesser is the RPN, higher is the Risk.
Let’s try to understand it with an example:
Failure Mode Effect Analysis Example
(This is a hypothetical example only for an understanding purpose. Actual implementation and features may vary)
Let’s consider a simple example of a banking application that has 4 features.
- Feature 1: Withdraw
- Feature 2: Deposit
- Feature 3: Home Loan
- Feature 4: Fixed Deposits.
A Risk Analysis team is formed which consists of the Bank manager, UAT Test Manager ( representing end-user), Technical Architect, Test Architect, Network Administrator, DBA, and a Project Manager.
After a series of brainstorming sessions the team came up with the following Risks:
- Complex Business logic in case of calculating interest rate of the home loan.
- The system fails at 200 concurrent users.
- The system fails to handle documents which are more than 6 MB.
Now let’s try to calculate the Severity, Priority, and Likelihood of these identified risks.
Severity:
| Feature | Class | Scale |
| Complex business logic in case of calculating interest rate of home loan | Very High | 2 |
| System fails at 200 concurrent users | High | 3 |
| System fails to handle documents which are more than 6 MB | Very High | 2 |
Priority:
| Feature | Class | Scale |
| Complex business logic in case of calculating interest rate of home loan | Very High | 2 |
| System fails at 200 concurrent users | High | 3 |
| System fails to handle documents which are more than 6 MB | High | 3 |
Likelihood:
| Feature | Class | Scale |
| Complex business logic in case of calculating interest rate of home loan | High | 3 |
| System fails at 200 concurrent users | High | 3 |
| The system fails to handle documents which are more than 6 MB | Low | 4 |
Now let’s put all these attributes together:
|
Feature |
Severity |
Priority |
Likelihood |
| Complex business logic in case of calculating interest rate of home loan | 2 | 2 | 3 |
| The system fails at 200 concurrent users | 3 | 3 | 3 |
| System fails to handle documents which are more than 6 MB | 2 | 3 | 4 |
Now let’s calculate the Risk Priority Number (RPN = Severity * Priority * Likelihood)
|
Feature |
Severity |
Priority |
Likelihood |
RPN |
| Complex business logic in case of calculating interest rate of home loan | 2 | 2 | 3 | 12 |
| System fails at 200 concurrent users | 3 | 3 | 3 | 27 |
| The system fails to handle documents which are more than 6 MB | 2 | 3 | 4 | 24 |
Now the key is: Lower is the RPN – Higher is the risk.
So here for this particular example, Feature 1 (Complex business logic in case of calculating the interest rate of the home loan) has the highest risk and feature 2 (System fails at 200 concurrent users) has the lowest risk.
How to use this to derive test cases?
Since Feature 1 is the riskiest feature, the test cases should be rigorous and more in-depth. Write the test cases to cover complete functionality and affecting modules by the feature. Use all sorts of test case writing techniques (Equivalence Partitioning and BVA, Cause and effect graph, State Transition diagram) to derive the test cases.
The test cases should not only be functional but also non-functional (Load test, Stress, and Volume test, etc.). Basically, we need to do exhaustive testing of this particular feature, so base your test cases accordingly. Also, consider all the dependent modules on this important feature.
Feature 2 is the LEAST RISKY feature, so base your test cases on the major functionality. Just high-level test cases to validate that the feature works as expected should be sufficient.
Feature 3 is a MODERATE RISK feature, so base your test cases to cover all the major and dependent functionality. Write some BVA test cases to validate a few negative scenarios as well. The extent of the test cases should be between High risk and Low-risk factor. If required, include few non-functional test cases as well.
FMEA And Degree Of Testing
Based on the RPN value, we determine the extent or degree of testing to be done.
Normally if:
- RPN is between 1-10, we do Extensive Testing (Covering in and out of the feature/module)
- RPN is between 11-30, we do Balanced Testing ( Covering all the major functionality of the feature/module)
- RPN is between 31-70, we do Opportunity testing (Covering the basic functionality of the feature/module)
- RPN is more than 70 – No testing or when time permits, only anomaly reporting.
These ranges or numbers are not restricted to the ones I mentioned above. They may vary as per the nature of the project.
Resources: Download FMEA Software and FMEA Template.
Conclusion
Risk Analysis using FMEA requires time and experience. Desired results can be achieved only by equal participation from all the responsible team members. Though this technique is formal, it requires a series of brainstorming sessions and it is equally important to document all the identified risks.
Since most of the applications are exclusive, the scale to measure the parameters of FMEA (i.e. Priority, Severity, and Likelihood) also dependents on the application. If done appropriately, there are many advantages to the FMEA technique. It can be used for identifying potential risks and based on this team can plan an effective mitigation strategy.
The current study was conducted at Assiut University Hospital. Enrolment criteria included all patients diagnosed with heart failure and admitted to the Intermediate Cardiology Care Unit (ICCU), Internal Medicine Department, from July 1st, 2018 to 31st December 2019. Exclusion criteria included: i) patients with core body temperature <36°C; ii) patients with metabolic acidosis (serum lactate level >2 mmol/L); iii) those who developed cardiogenic shock; and iv) patients with diseases or conditions known to affect pulse oximeter accuracy, e.g., sickle cell disease, methemoglobinemia, carboxyhemoglobinemia. Enrolled subjects were subjected to full clinical evaluation including smoking history and medical comorbidities. Age and gender-matched control groups were enrolled.
The pulse oximeter used was a Philips M1020A pulse oximetry module (Philips Medical Systems, Eindhoven, Netherlands). An appropriate-sized pulse oximeter sensor (Phillips M1020A/ M1192A/ M1194A/ M1195A) was applied to the finger, on the toe, and the ear lobe.
Patients were continuously monitored by pulse oximetry during their stay in the ICCU. The target SpO2 was ‘morning baseline SpO2’, which was registered by nurses in awake patients on the morning round, usually after chest radiography, and taking the most stable value on room air. For patients receiving oxygen therapy, it was recorded when a steady value was reached, after several minutes of oxygen discontinuation.
At the same time, an arterial blood sample was drawn. A single reading of SpO2 was taken in individual sensor locations after the pulse oximeters had achieved optimal plethysmography signals and heart rates matching with the electrocardiogram (ECG) monitor (CMS; Philips Medical Systems). In those patients with variable heart rate(s), readings of SPO2 were taken after control of their abnormal heart rates. Simultaneously, an arterial blood gas (ABG) analysis was done for co-oximetric measurement of SaO2 using an ABL 800 FLEX ABG machine (Radiometer America Inc., Cleveland, OH, USA). The core temperature, arterial pressure, heart rate, and ABG value of hemoglobin were recorded simultaneously.
Comparison of pulse oximetry reading (SpO2) with arterial oxygen saturation (SaO2) was reported in terms of bias and precision as described by Bland and Altman [7]. Bias is the difference between the specific body location SpO2 (finger, toe, ear) and SaO2 (i.e., SpO2-SaO2) and precision is the ±1 standard deviation of the difference [7]. A low bias in a sensor site implies that the pulse oximeter sensor gives a more accurate reading at that site and vice versa. Precision implies the reproducibility of the measurement.
Echocardiography
Echocardiographic examination was carried out using commercially available cardiac ultrasound machines (4500 echocardiography machine with a 3.5 MHz electronic probe; Hewlett- Packard, Palo Alto, CA, USA). All patients and control subjects underwent a two-dimensional, pulse-waved, color-flow Doppler echocardiography (ATL 9) of the right side of the heart (right atrium, tricuspid valve, right ventricle, pulmonary valve, and artery) in parasternal long-axis, short-axis, short-axis cross-section of the base of the heart, and apical four-chamber view, to evaluate the right heart performance and to calculate the mean PPA. When tricuspid regurgitation was recorded with color-flow Doppler, the maximum velocity (V) of tricuspid incompetence was calculated with a continuous Doppler study of at least four consecutive beats. Right ventricle pressure (RVP) was derived using the equation RVP = 4 V2 + RAP (V= the maximum velocity of tricuspid incompetence, RAP = right atrial pressure). The estimated RVP is considered to represent the PPA if there is no evidence of pulmonary valvular dysfunction.
The patients were divided into three groups: i) those with ejection fraction (EF) more than 40% (group A); ii) those with EF less than 40% (group B); and iii) those with acute HF with ST and non- ST segment elevation acute myocardial infarction (STEMI and non-STEMI) (group C). The study was approved by the Ethical Committee of the Faculty of Medicine (Approval number 5441), Assiut University, and written informed consent was provided by all patients.
Statistical analysis
Data were described as mean ± standard deviation (SD) and frequencies if they are quantitative or qualitative, respectively. Mann-Whitney test and Wilcoxon Signed Ranks test were used for comparison of quantitative variables among two independent and dependent groups, respectively. Chi-Square test was used for comparison of the distribution of qualitative variables among different groups. Correlation between continuous variables was performed using Spearman’s correlation coefficient. Kruskal-Wallis test was used to compare the bias of two sensor sites statistically. A p<0.05 was interpreted as significant. The SPSS (Statistical Package for Social Science) software v. 20 was used for statistical analysis.
Definition of “detection”
The Oxford English dictionary defines “detection” as “the action or process of identifying the presence of something concealed.”
What is the definition of “Detection” in an FMEA?
“Detection” is a ranking number associated with the best control from the list of detection-type controls, based on the criteria from the detection scale. The detection ranking considers the likelihood of detection of the failure mode/cause, according to defined criteria. Detection is a relative ranking within the scope of the specific FMEA and is determined without regard to the severity or likelihood of occurrence.
How is “Detection” assessed in FMEAs?
For each cause, The FMEA team assesses the detection ranking. This is the likelihood that the current detection-type controls will be able to detect the cause of the failure mode.
For Design FMEAs, detection is the ranking number corresponding to the likelihood that the current detection-type Design Controls will detect the failure mode/cause, typically in a timeframe before the product design is released for production. For Process FMEAs, detection is the ranking number corresponding to the likelihood that the current detection-type Process Controls will detect the failure mode/cause, typically in a timeframe before the part or assembly leaves the manufacturing or assembly plant.
A suggested approach is assuming the failure has occurred and then assessing the capability of the detection-type design or process control to detect the failure mode or cause. If there is no detection-type control for a given failure mode/cause, the detection ranking should be set to the highest level.
Chapter 6 of Effective FMEAs discusses an exception to this definition of detection for application in industries where the emphasis needs to be on detecting failures once the customer takes ownership (or the system is in operation).
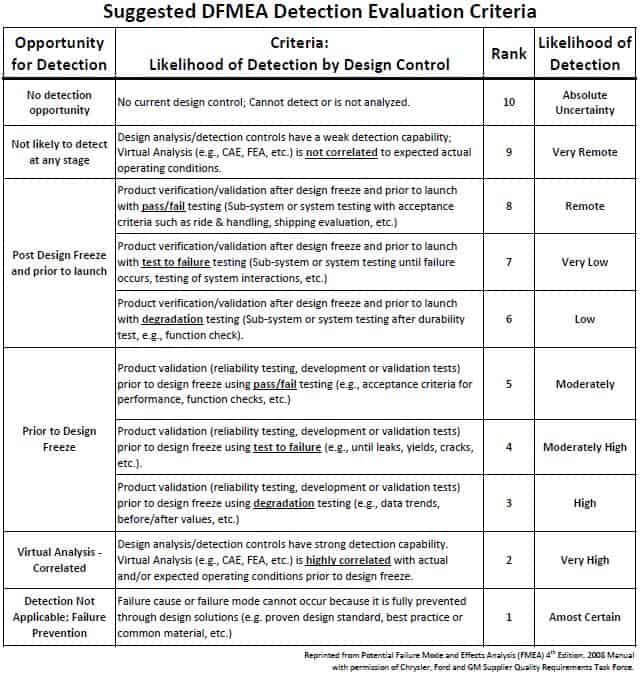
What does a Detection Scale look like for Design FMEAs?
The following is an example of a detection scale for Design FMEAs. It is based on “Potential Failure Mode and Effects Analysis (FMEA) 4th Edition, 2008 Manual.”
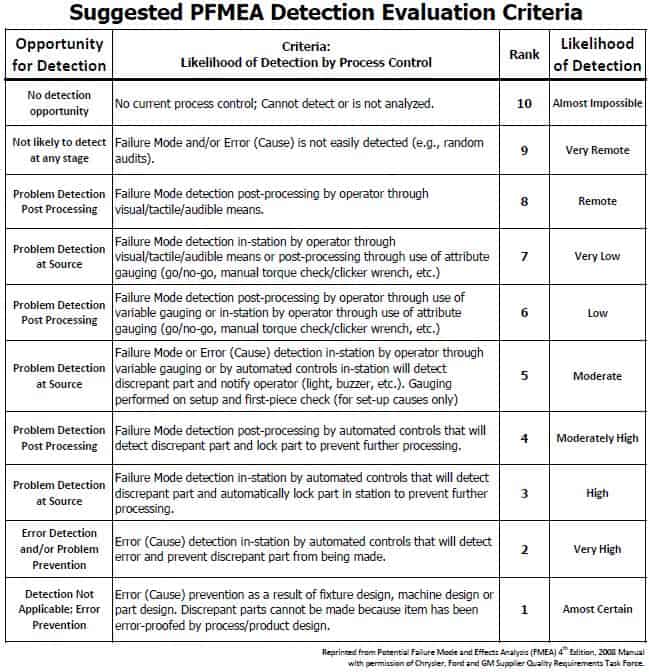
What does a Detection Scale look like for Process FMEAs?
The following is an example of a detection scale for Process FMEAs. It is based on “Potential Failure Mode and Effects Analysis (FMEA) 4th Edition, 2008 Manual.”
What is an example of Detection in a Design FMEA?
[In this fictitious example, the detection ranking is assessed based on considering the criteria in the AIAG 4 scale and an estimate of a “moderately high” likelihood that the detection-type controls in the Design FMEA will detect the failure mode / cause.]
Item: Power steering pump
Function: Delivers hydraulic power for steering by transforming oil pressure at inlet ([xx] psi) into higher oil pressure at outlet [yy] psi during engine idle speed
Failure Mode: Inadequate outlet pressure (less than [yy] psi)
Effect (Local: Pump): Low pressure fluid goes to steering gear
Effect (Next level: Steering Subsystem): Increased friction at steering gear
Effect (End user): Increased steering effort with potential accident during steering maneuvers
Severity: 10
Cause: Fluid incorrectly specified (viscosity too low)
Occurrence: 5
Prevention Control: Design guidelines for hydraulic fluid selection
Detection Control: Vehicle durability testing #123
Detection: 4
What is an example of a Detection in a Process FMEA?
[In this fictitious example, the detection ranking is assessed based on considering the criteria in the AIAG 4 scale and an estimate of a “very low” likelihood that the detection-type controls in the Process FMEA will detect the failure mode / cause.]
Process Step: Induction harden shafts using induction hardening machine
Function: Induction harden shafts using induction-hardening machine ABC, with minimum hardness Brinell Hardness Number (BHN) “X”, according to specification #123.
Failure Mode: Shaft hardness less than BHN “X”
Effect (In plant): 100% scrap
Effect (End user): Shaft fractures with complete loss of performance
Effect (Assembly): Not noticeable during assembly
Severity: (Customer Effect): 8 (loss of primary function)
Severity: (Mfg/Assy Effect): 8 (major disruption)
Cause: Induction machine electrical voltage/current settings incorrect for part number
Occurrence: 3
Prevention Control: Shaft hardening setup instructions
Detection Control: audit of shaft hardness
Detection: 7
Application Tip
The most common misunderstanding or misapplication of the detection scale is to confuse or co-mingle the three types of detection risk:
1. Likelihood of detection by the identified controls – specifically, what is the likelihood that the current detection-type control will be able to discover the failure mode or its cause (remote, low, moderate, high, etc.)
2. Timing of the opportunity for detection – specifically, what is the timing of the current detection-type control (prior to design freeze, post design freeze, in service, etc.)
3. Type of test used to detect the cause of the problem – what is the quality of test method used to detect the failure mode or its cause (degradation test, test to failure, pass/fail test, etc.)
The detection scale must clearly identify which of the three types of detection risk is being assessed by the individual criteria of the scale.
Next Article
Can you find the error in detection ranking in the example problem for next week? It is a common error, highlighted in the intermediate problem. In the advanced problem, the topic of an in-service detection scale will challenge the most experienced readers.