Project 2 - Create a report using PowerQuery, Macro VBA, List Functions and Data Validation functions for Data Reporting of Supply Chain Management companies
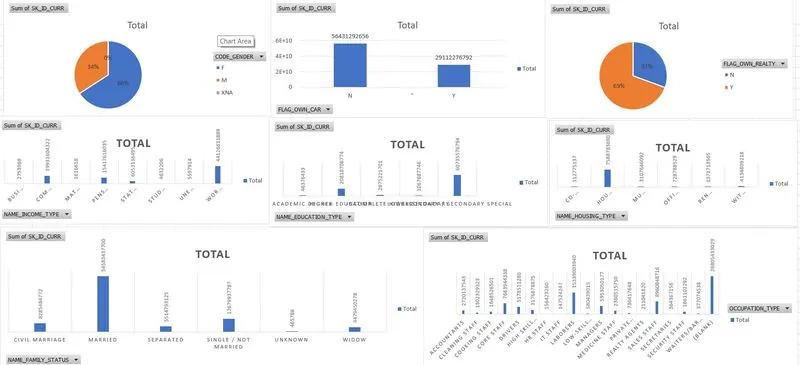
Features of Dashboard - create pivot charts for all below mentioned questions & make an attractive dashboard out of it.
- Gender Ratio of Applicants
- Car Owner/ Non-Owner Ratio
- House Owner/ Non-Owner Ratio
- Client Income Type
- Client’s Level of Education
- Client’s Housing Type
- Client’s Family Status
- Client’s Occupation Type
Separate Worksheet Required for
- Data Summary of All Female Client’s for Income and Loan Amount using New Functions (hint: use unique,sort,filter functions) if These functions are not supporting in your software please give a theoritical answer.
- Data Summary of All male Client’s for Income and Loan Amount using list Functions (hint:use dsum,daverage,..)
- Data Summary for all Flag Columns like (FLAG_DOCUMENT_2, FLAG_DOCUMENT_3 etc.) using all variants of DCOUNT function.
Answers in sheet 3
Other Deliverables
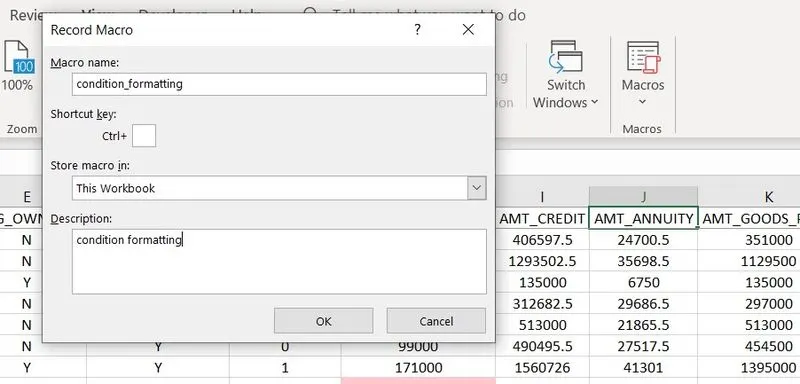
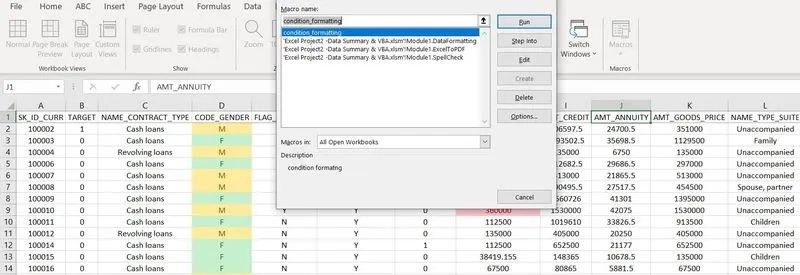
- Create a macro for conditional formatting & freezing panes
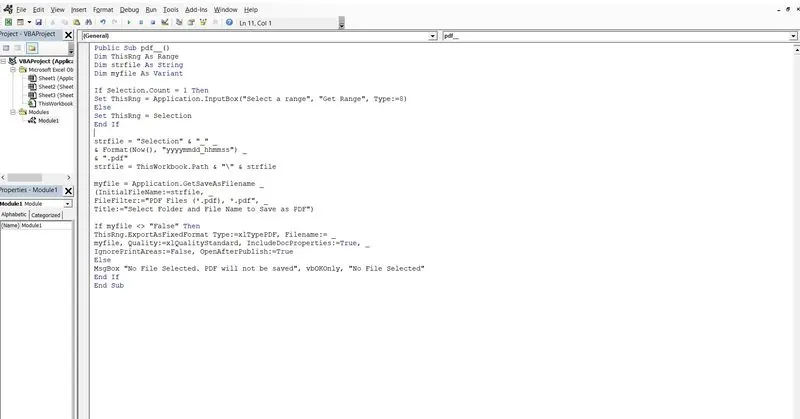
- Create VBA Code to convert selected data into pdf from applicant data
- Check Spelling mistakes in the workbook using VBA Code

https://drive.google.com/file/d/10mmcAI7bjXxA7sTMaq7sHjeuVOFAr3ij/view?usp=drive_link