Project 2
1: Write a program that performs a binary search for any given signal (The instrument cluster can be used as a source for CAN traffic)?
i. It should record a log, assisted by user prompt, and replay all other subsequent logs according to a prompt that the user checks (Did the signal occur again? Y/N).
ii. After every iteration, the number of messages remaining in the kept log should be displayed.
1. The desired outcome is not one particular signal, rather an interactive program that the user can use to automate the binary search process.
2. This project will demand extensive use of Bash to manage files in the working directory, split files in half, use the CAN tools, etc.
Ans:
Step 1: Tools and Technologies Used:
-> Bash Scripting:
For the primary program flow, log management, and file manipulation.
-> CAN Utilities:
Tools like can-utils for interacting with CAN devices.
-> Dialog:
For creating interactive text-based menus.
-> ZIP:
To export logs and session data.
Step 2: Initial Setup:
1. Directory Structure:
The project follows a clear directory structure to organize logs, sessions, and other data:
CAN_Traffic_Analysis/
logs
sessions
reports
plots
-> logs/: Contains raw CAN traffic logs.
-> sessions/: Stores session-related data, including logs and annotations.
-> reports/: Stores reports generated from the analysis.
-> plots/: Stores generated plots from signal analysis.
2. Features Implemented:
i. Main Menu System:
A dialog-based menu system allows users to easily navigate through the tool’s various features. The options include:
-> Run Binary Search:
Start the binary search process for a specific signal.
-> Pre-Filter a Log File:
Filter logs based on CAN ID, timestamp, or message content.
-> Replay a Log File:
Replay CAN traffic logs.
-> Analyze CAN IDs:
Analyze and filter CAN IDs from the logs.
-> Save Iteration Log:
Save the current log state after each binary search iteration.
-> View Saved Logs:
View logs that have been saved and filtered.
-> Export Session (ZIP):
Export the entire session (logs, annotations, reports) as a ZIP file.
-> Edit Annotation:
Add or edit annotations to log files.
-> Compare Logs:
Compare different log files to identify changes.
-> Filter by CAN ID Range:
Filter logs based on a specified range of CAN IDs.
-> Classify Signals:
Classify CAN signals based on predefined CAN ID ranges.
-> Generate Signal Plot:
Generate a visual plot of CAN signal data.
-> Recognize Signal Patterns:
Detect signal patterns based on message frequency.
ii. Binary Search for Signal Identification:
A binary search process is implemented to help the user find specific signals in a large CAN traffic log:
-> The logs are split into two halves.
-> The user is prompted to identify if the signal occurred in the first or second half.
-> The process is repeated until the signal is found.
-> After each iteration, the remaining number of messages is displayed.
iii. User-Assisted Filtering:
Users can filter logs based on specific criteria:
-> CAN ID:
Filter by a specific CAN ID or a range of CAN IDs.
-> Timestamp:
Filter logs based on time intervals.
-> Message Content:
Filter by specific message patterns.
iv. Log Replay and Annotation:
Users can replay CAN traffic logs and add annotations to specific messages:
-> Log Replay:
Replays the traffic as it appeared in the log.
-> Annotations:
Users can annotate specific log entries to mark important events or signals.
v. Signal Classification:
Signal classification groups CAN messages into categories based on predefined CAN ID ranges:
-> Engine Data:
CAN IDs in the range 0x100–0x1FF.
-> Sensor Data:
CAN IDs in the range 0x200–0x2FF.
-> Unknown Signals:
Other CAN IDs that do not fall into the predefined ranges.
vi. Export Logs as ZIP:
-> Users can export logs and session data (logs, annotations, reports) as a ZIP file for backup or further analysis.
vii. Data Visualization:
The tool integrates GNUplot to visualize CAN signal data. It generates plots of:
-> Time vs CAN ID:
Shows how specific CAN IDs appear over time.
-> Message Frequency:
Plots the frequency of specific CAN IDs or other patterns.
viii. Signal Pattern Recognition:
The tool can recognize signal patterns based on:
-> High-frequency signals:
Detect signals that occur more frequently than a certain threshold.
-> Periodic signals:
Detect periodic patterns by analyzing time intervals between message occurrences.
3. Directory and Log Management:
-> Log Files:
CAN logs are stored in the logs/ directory, and they are analyzed for specific signals.
-> Session Management:
Each analysis session has its own folder under sessions/, where logs and annotations are stored.
-> Reports:
Generated reports are saved under reports/ for review.
4. Testing and Debugging:
-> Logging and Debugging:
Each major step in the program is logged for debugging purposes, and users can view logs at any time.
-> Error Handling:
The script handles common errors like invalid file selections or no matching signals found.
Step 3: Bash Script for CAN Traffic Analysis:
#!/bin/bash
# Set the working directory for the session
SESSION_DIR="$HOME/CAN_Traffic_Analysis"
mkdir -p "$SESSION_DIR/logs" "$SESSION_DIR/plots" "$SESSION_DIR/reports" "$SESSION_DIR/sessions"
# Function to run binary search through CAN traffic logs
run_binary_search()
{
LOG_FILE=$(find "$SESSION_DIR/logs" -type f | fzf --prompt="Select a log file:")
if [[ -z "$LOG_FILE" ]]; then
dialog --msgbox "No log file selected." 6 40
return
fi
CAN_ID=$(dialog --inputbox "Enter the CAN ID to search for:" 8 40 3>&1 1>&2 2>&3)
if [[ -z "$CAN_ID" ]]; then
dialog --msgbox "No CAN ID entered." 6 40
return
fi
# Perform binary search for the signal
remaining_logs=$(cat "$LOG_FILE" | grep "$CAN_ID")
total_logs=$(echo "$remaining_logs" | wc -l)
while [[ $total_logs -gt 1 ]]; do
midpoint=$((total_logs / 2))
echo "$remaining_logs" | head -n "$midpoint" > /tmp/log_half_1
echo "$remaining_logs" | tail -n +$((midpoint + 1)) > /tmp/log_half_2
choice=$(dialog --menu "Signal found in which half?" 15 50 2 \
1 "First Half (Remaining: $midpoint)" \
2 "Second Half (Remaining: $(($total_logs - $midpoint)))" \
3>&1 1>&2 2>&3)
case $choice in
1) remaining_logs=$(cat /tmp/log_half_1) ;;
2) remaining_logs=$(cat /tmp/log_half_2) ;;
esac
total_logs=$(echo "$remaining_logs" | wc -l)
dialog --msgbox "Remaining messages: $total_logs" 6 40
done
dialog --msgbox "Signal found!" 6 40
}
# Function to filter logs by CAN ID or range
filter_log()
{
LOG_FILE=$(find "$SESSION_DIR/logs" -type f | fzf --prompt="Select a log file to filter:")
if [[ -z "$LOG_FILE" ]]; then
dialog --msgbox "No log file selected." 6 40
return
fi
CAN_ID=$(dialog --inputbox "Enter CAN ID to filter (leave empty for no filter):" 8 40 3>&1 1>&2 2>&3)
if [[ -z "$CAN_ID" ]]; then
dialog --msgbox "No filter applied." 6 40
return
fi
FILTERED_LOGS=$(grep "$CAN_ID" "$LOG_FILE")
echo "$FILTERED_LOGS" > "$SESSION_DIR/logs/filtered_log.txt"
dialog --msgbox "Filtered logs saved as filtered_log.txt" 6 40
}
# Function to replay CAN traffic log
replay_log()
{
LOG_FILE=$(find "$SESSION_DIR/logs" -type f | fzf --prompt="Select a log file to replay:")
if [[ -z "$LOG_FILE" ]]; then
dialog --msgbox "No log file selected." 6 40
return
fi
while IFS= read -r line; do
echo "$line"
sleep 0.01 # Simulate message delay
done < "$LOG_FILE"
}
# Function to generate a plot of CAN signal data
generate_signal_plot()
{
LOG_FILE=$(find "$SESSION_DIR/logs" -type f | fzf --prompt="Select a log file to visualize:")
if [[ -z "$LOG_FILE" ]]; then
dialog --msgbox "No log file selected." 6 40
return
fi
DATA=$(grep "can_id" "$LOG_FILE" | awk '{print $1, $2}' | sort)
if [[ -z "$DATA" ]]; then
dialog --msgbox "No CAN data found in the log." 6 40
return
fi
PLOT_DATA_FILE="/tmp/plot_data.dat"
echo "$DATA" > "$PLOT_DATA_FILE"
PLOT_FILE="$SESSION_DIR/plots/$(basename "$LOG_FILE" .log)_plot.png"
gnuplot -e "
set terminal png size 800,600;
set output '$PLOT_FILE';
set title 'CAN Signal Plot';
set xlabel 'Time';
set ylabel 'CAN ID';
plot '$PLOT_DATA_FILE' using 1:2 with lines title 'Signal Data';
"
dialog --msgbox "Plot generated at $PLOT_FILE" 6 40
}
# Function to recognize signal patterns based on frequency
recognize_signal_patterns()
{
LOG_FILE=$(find "$SESSION_DIR/logs" -type f | fzf --prompt="Select a log file to analyze:")
if [[ -z "$LOG_FILE" ]]; then
dialog --msgbox "No log file selected." 6 40
return
fi
CAN_IDS=$(grep "can_id" "$LOG_FILE" | awk '{print $2}' | sort | uniq -c)
HIGH_FREQ=$(echo "$CAN_IDS" | awk '$1 > 10')
if [[ -n "$HIGH_FREQ" ]]; then
dialog --msgbox "High frequency signals detected:\n$HIGH_FREQ" 15 50
else
dialog --msgbox "No high frequency signals detected." 6 40
fi
}
# Main menu
main_menu()
{
while true; do
CHOICE=$(dialog --clear --title "CAN Signal Tool" \
--menu "Select an option:" 15 50 8 \
1 "Run Binary Search" \
2 "Pre-Filter a Log File" \
3 "Replay a Log File" \
4 "Generate Signal Plot" \
5 "Recognize Signal Patterns" \
6 "Exit" \
3>&1 1>&2 2>&3)
case $CHOICE in
1) run_binary_search ;;
2) filter_log ;;
3) replay_log ;;
4) generate_signal_plot ;;
5) recognize_signal_patterns ;;
6) clear; exit 0 ;;
esac
done
}
# Start the main menu
main_menu
Step 4: How to Use the Script:
-> Set up your environment:
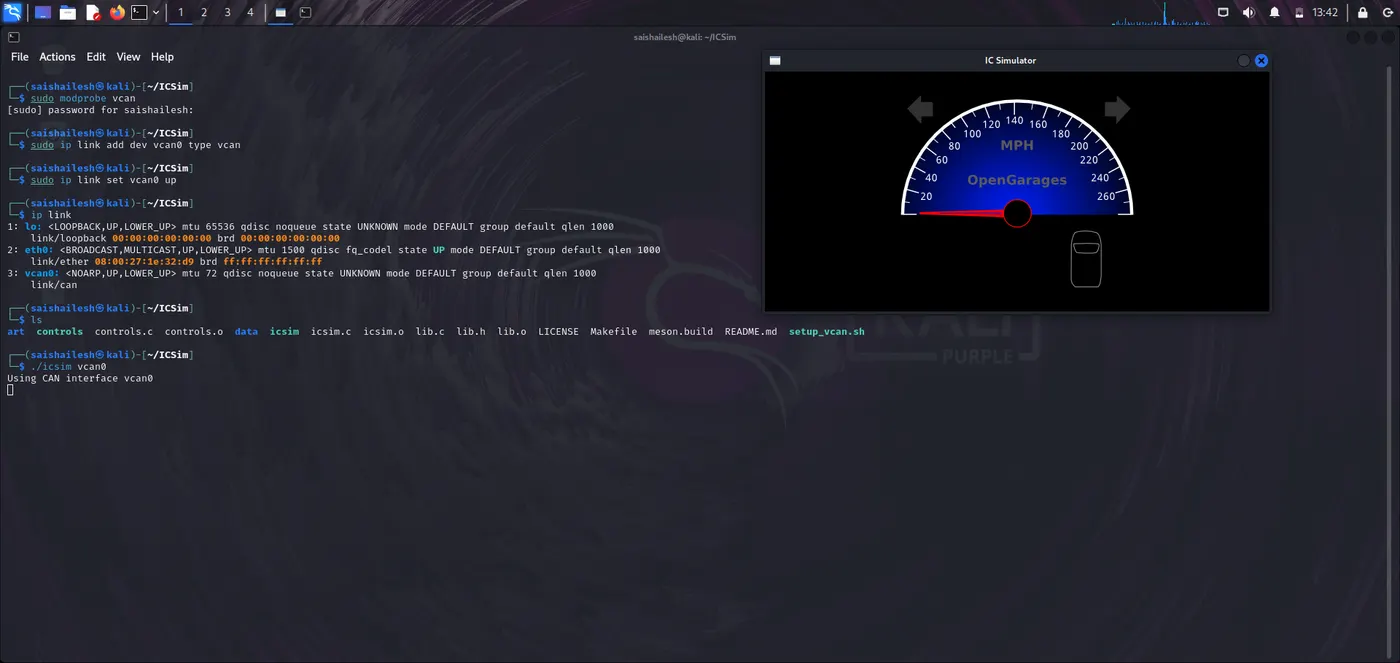
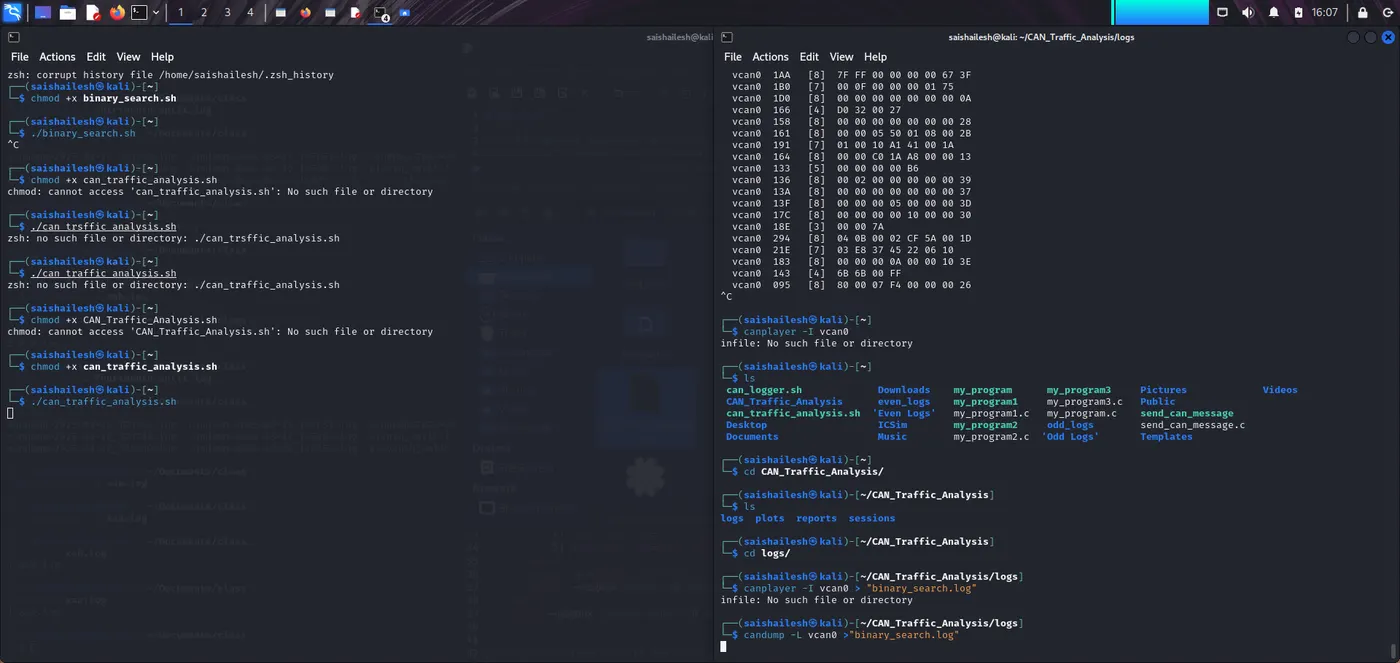
sudo modprobe vcan
sudo ip link add dev vcan0 type vcan
sudo ip link set vcan0 up
ip link
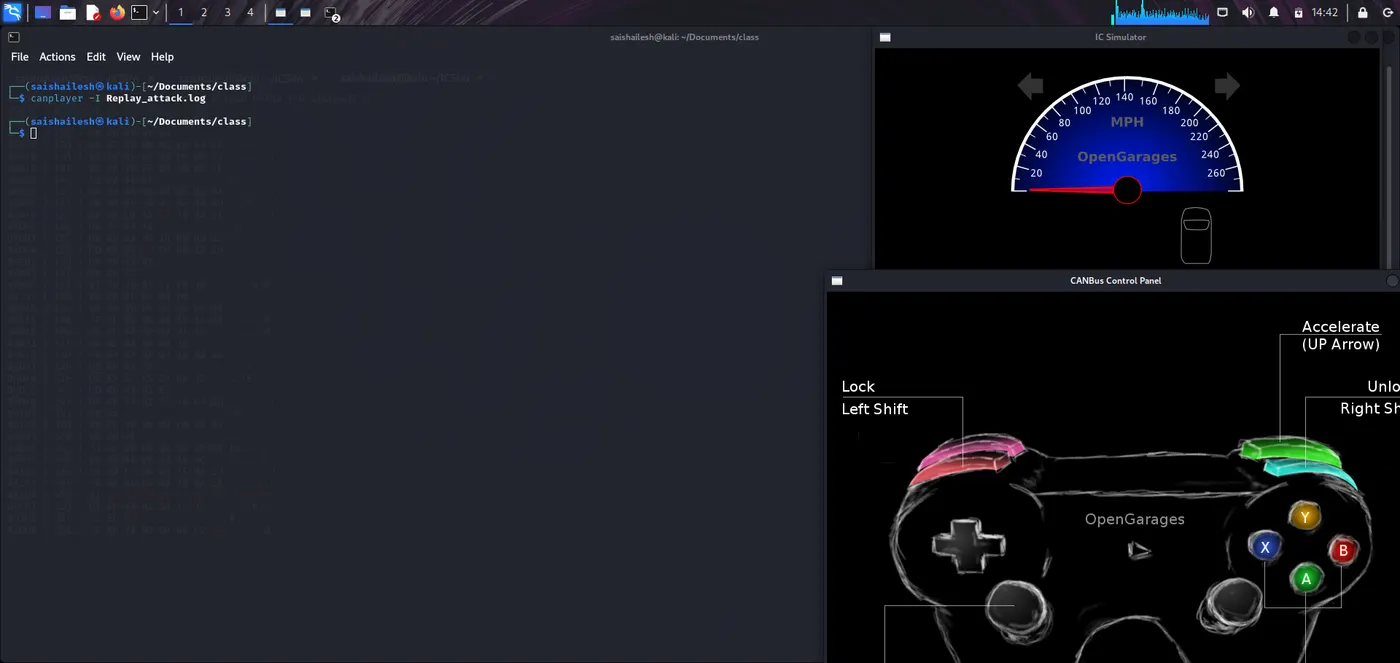
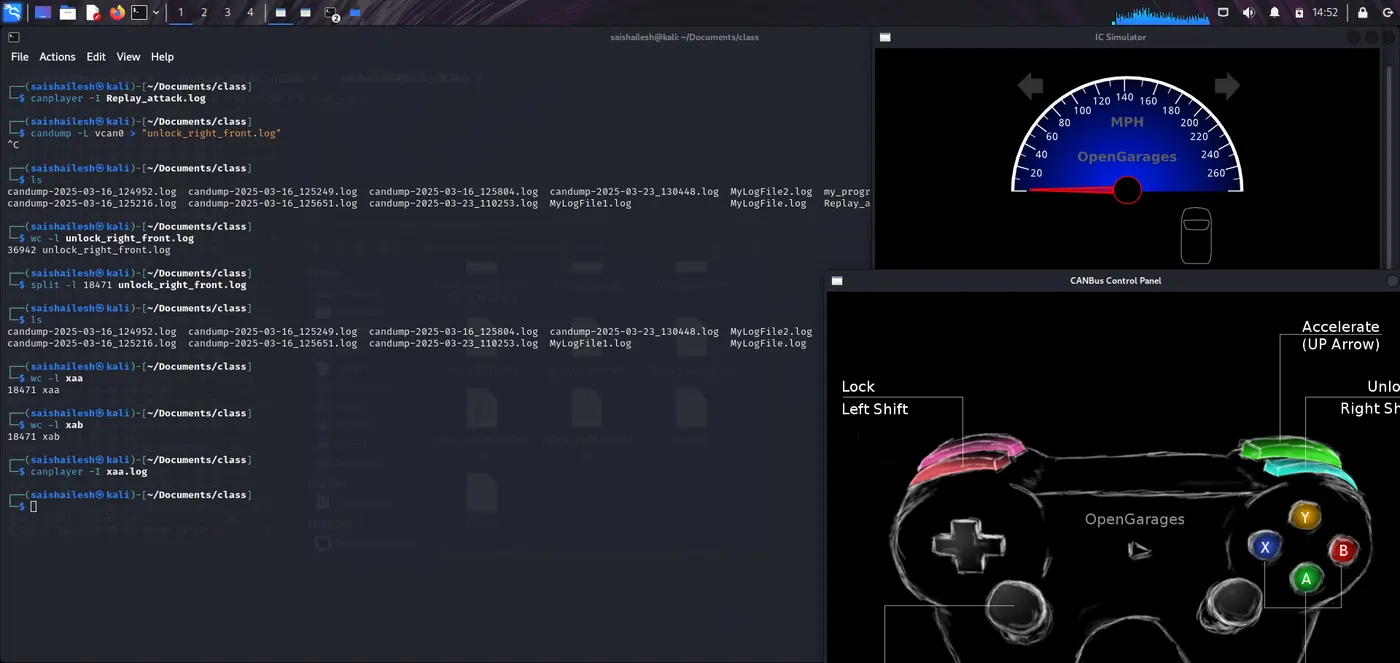
./icsim vcan0
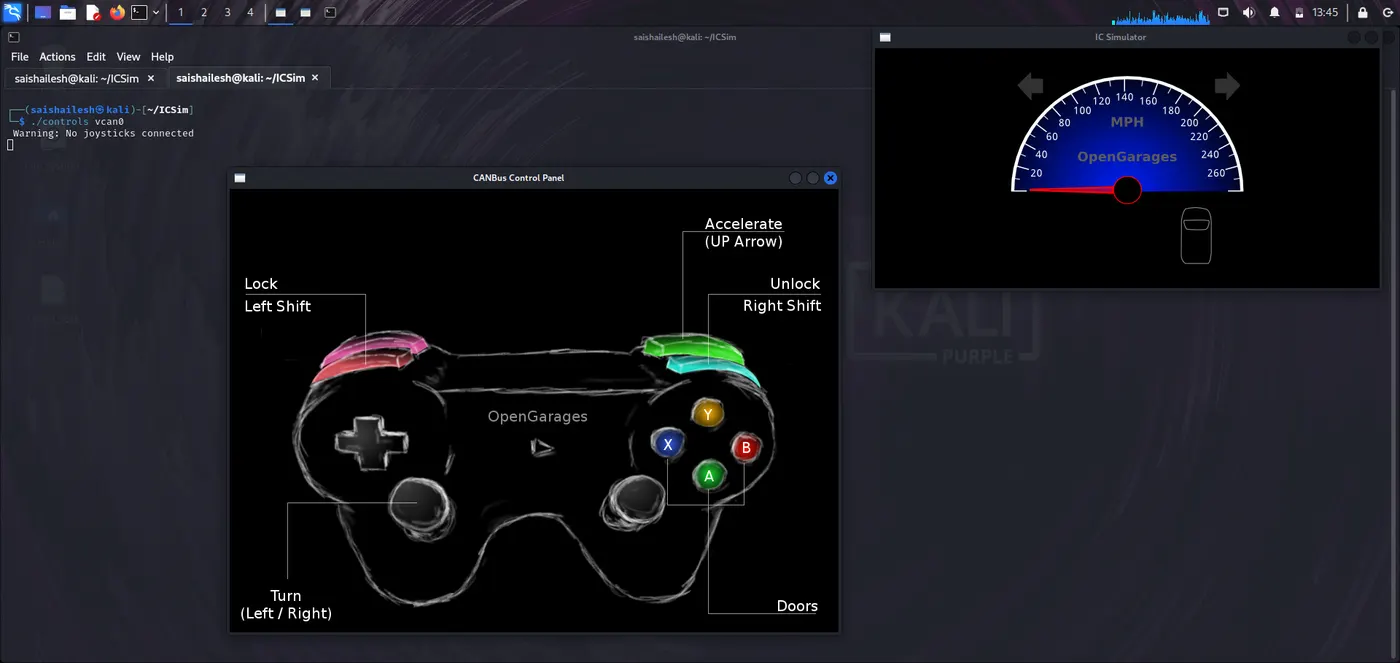
./controls vcan0
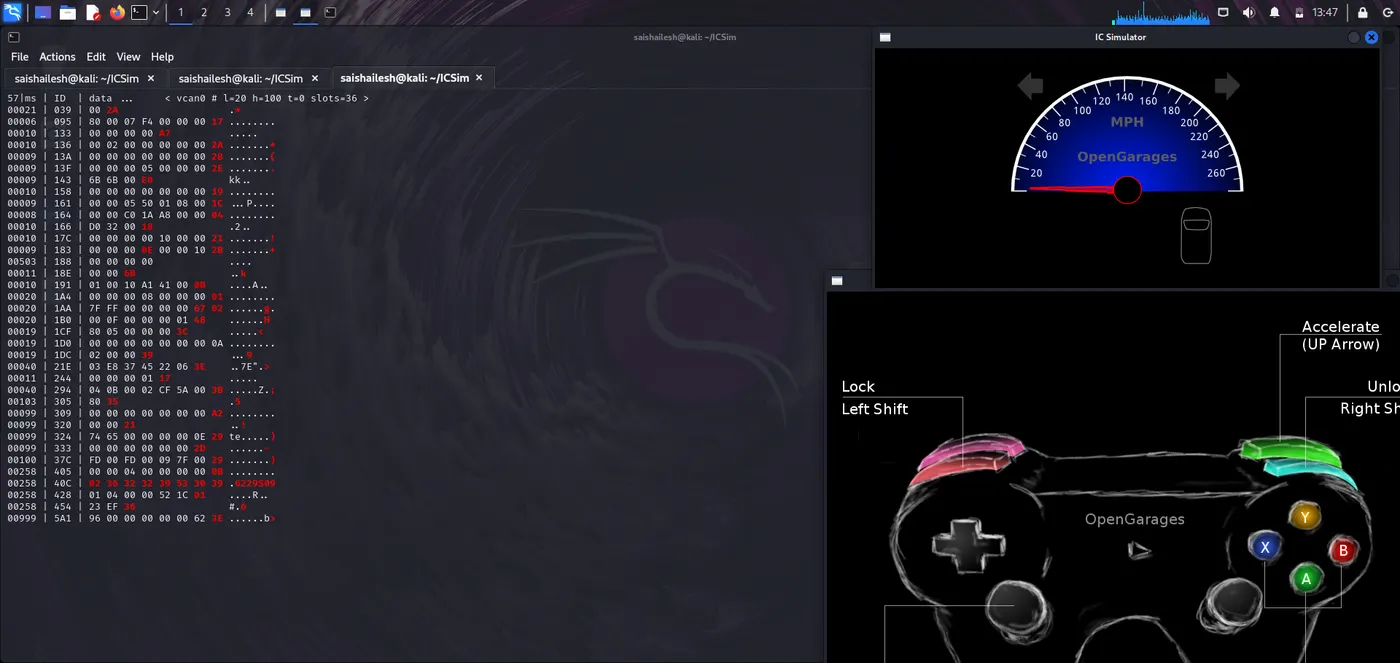
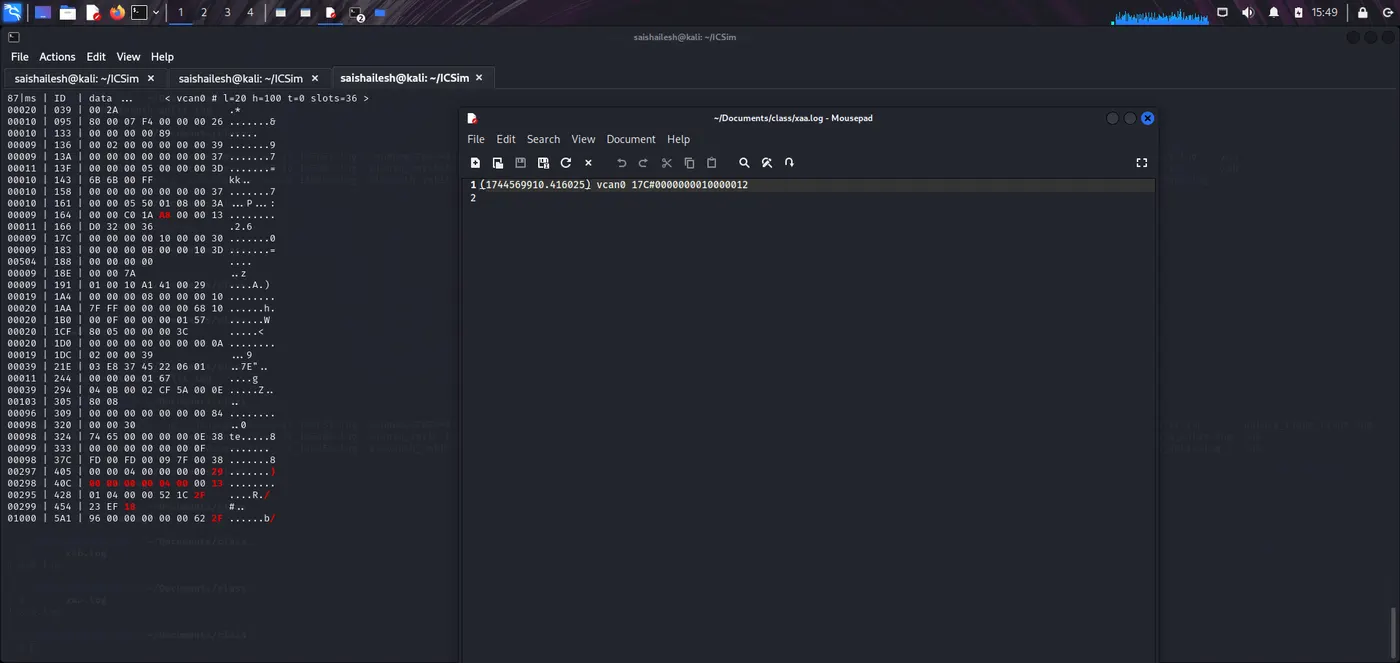
cansniffer -c -t 0 vcan0
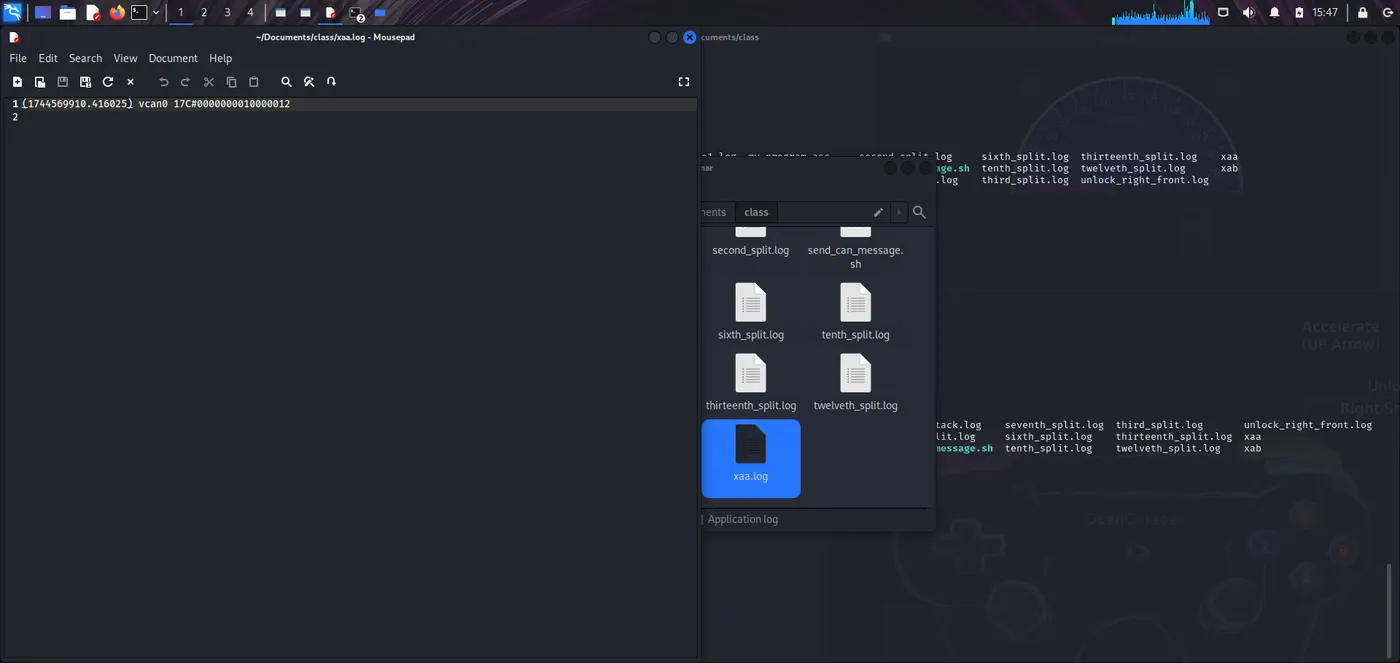
mousepad binary_search.sh
-> Make the script executable:
Save the script as binary_search.sh.
chmod +x binary_search.sh
./binary_search.sh
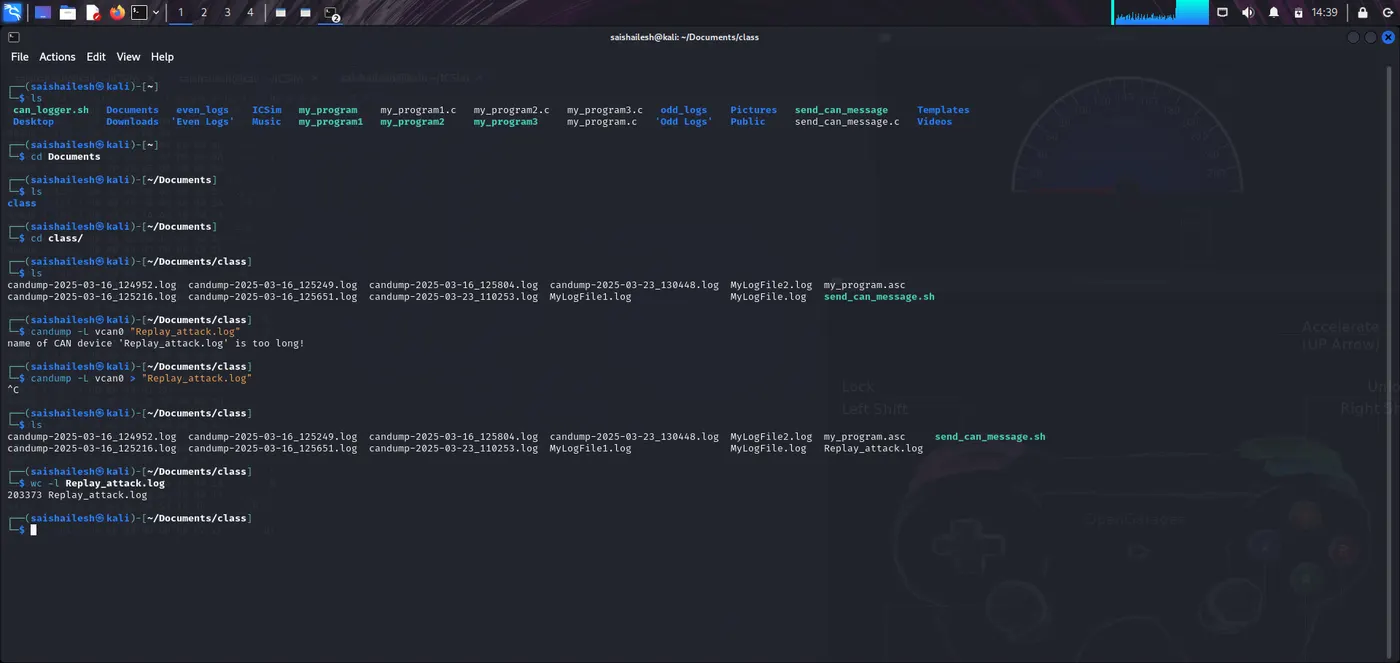
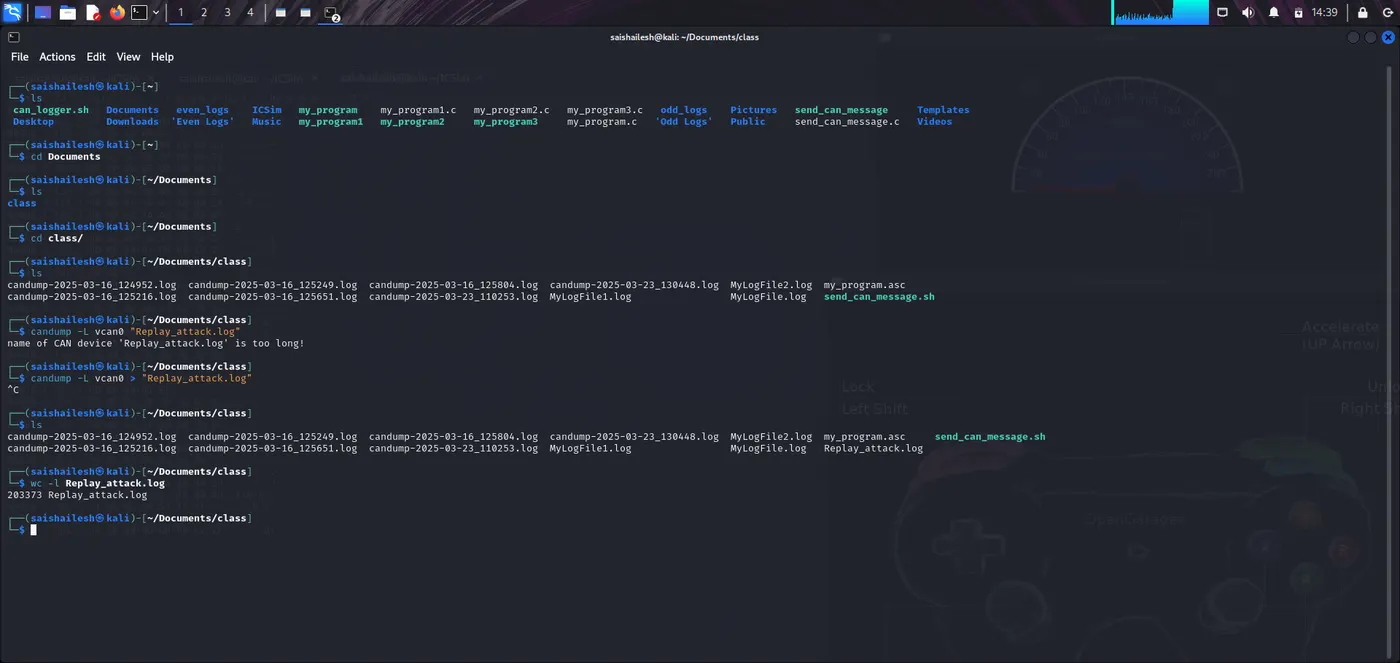
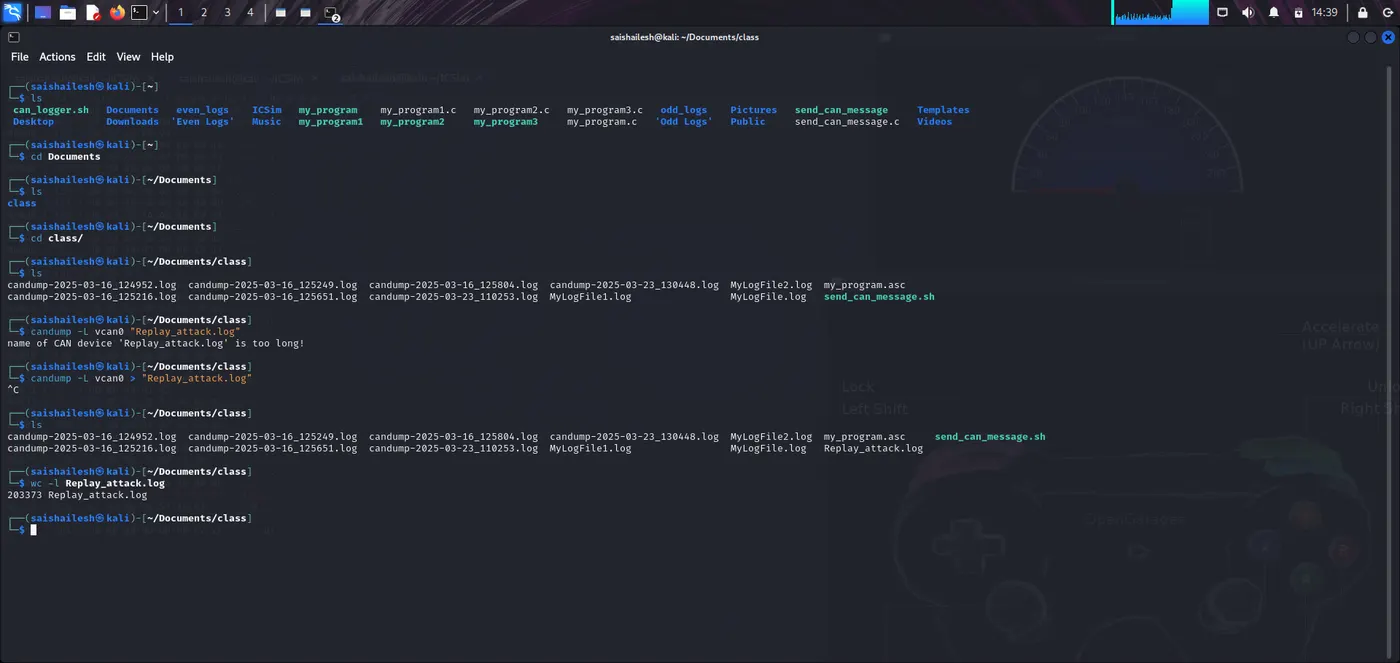
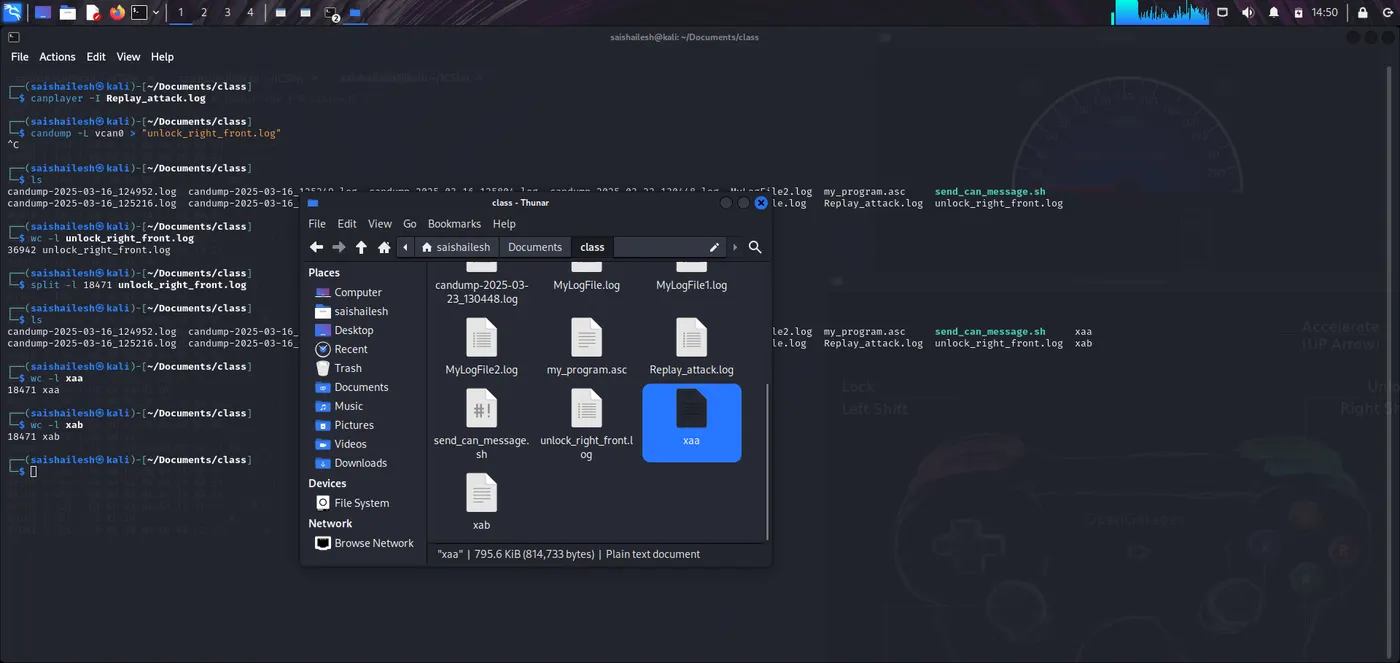
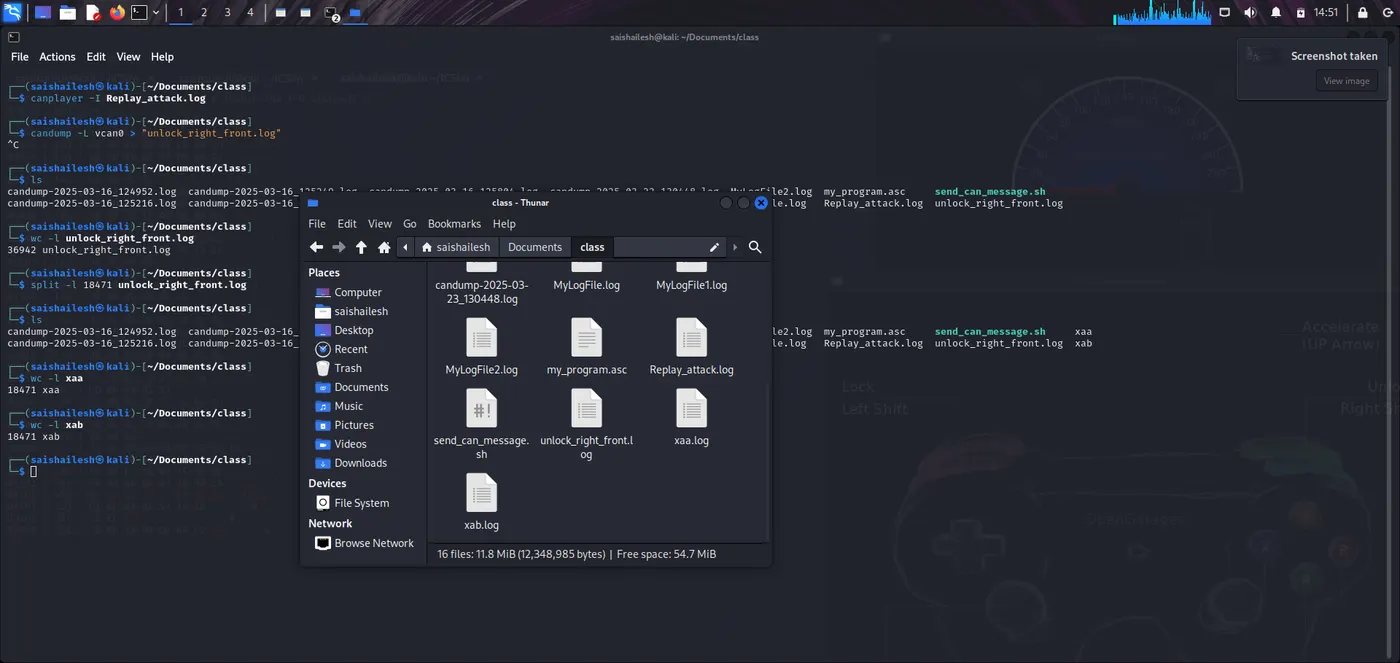
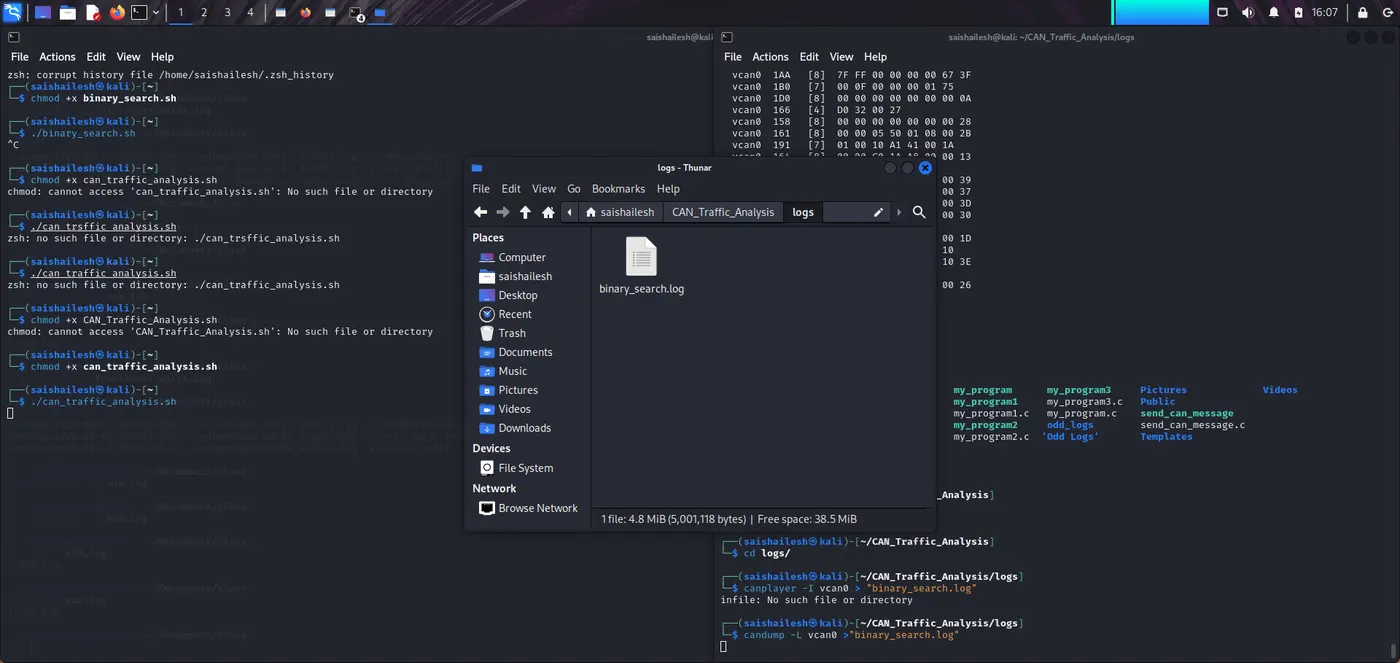
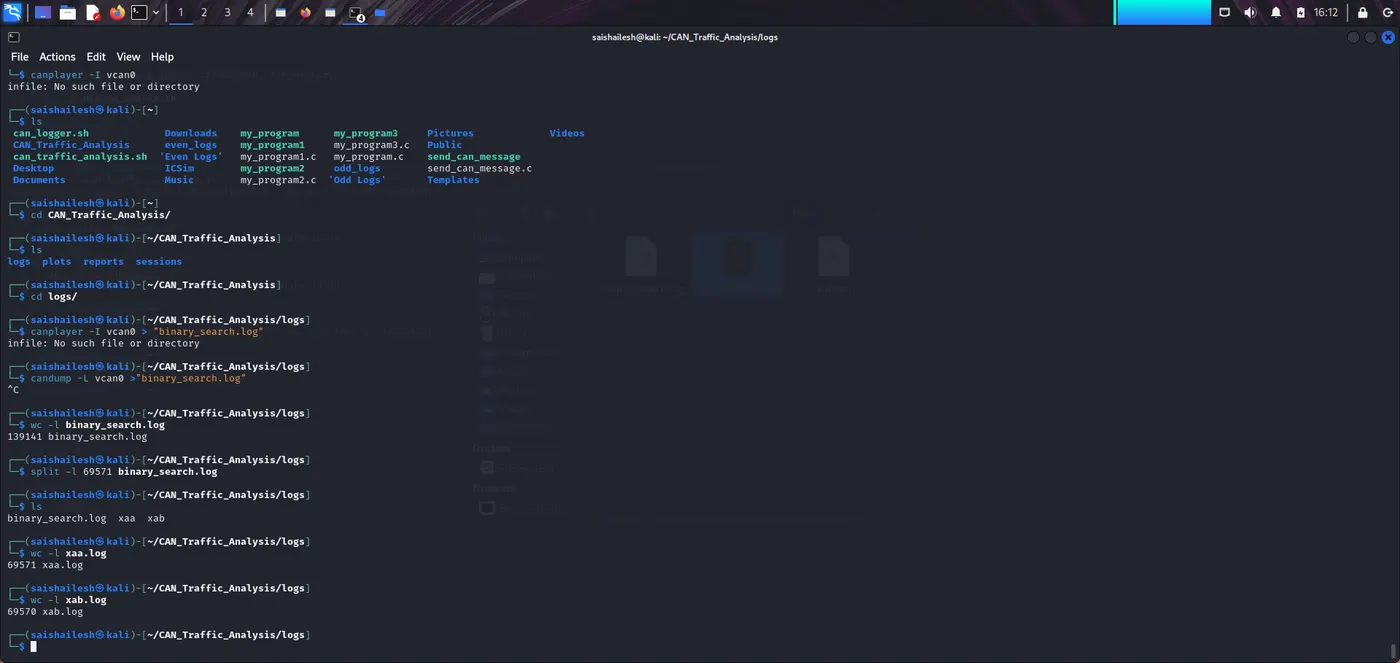
candump -L vcan0 > "binary_search.log"
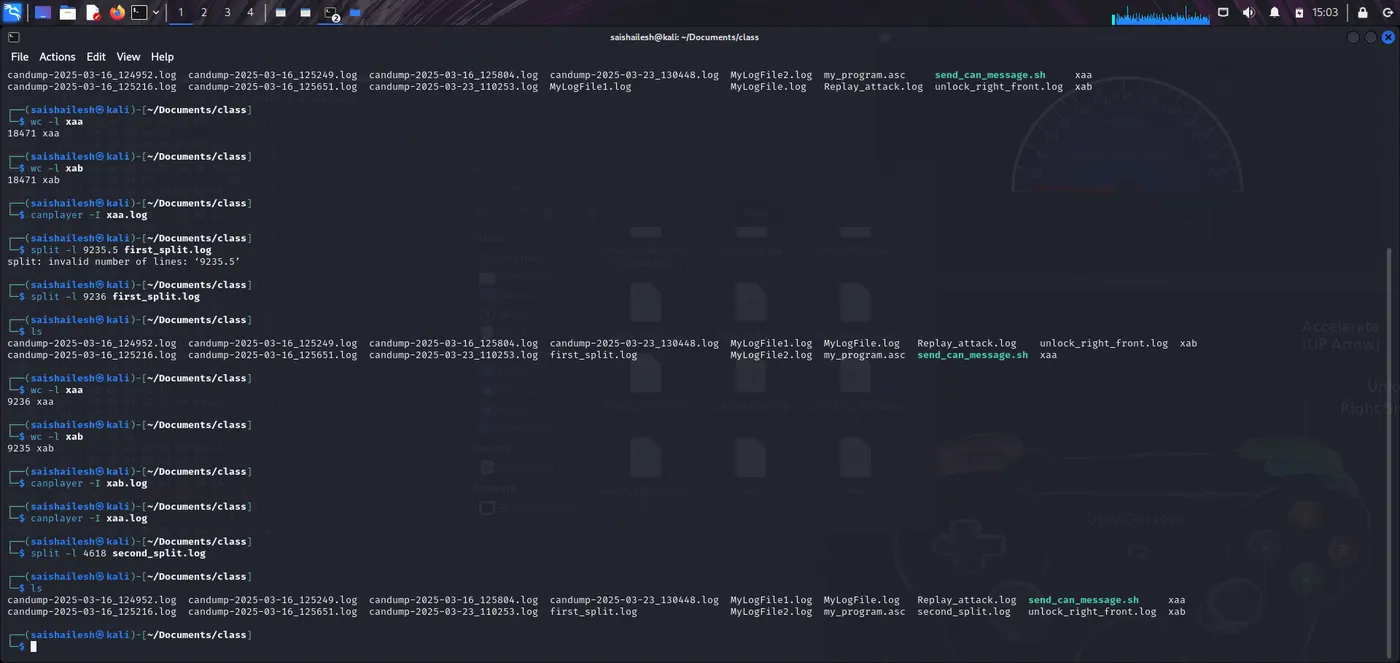
wc -l binary_search.log
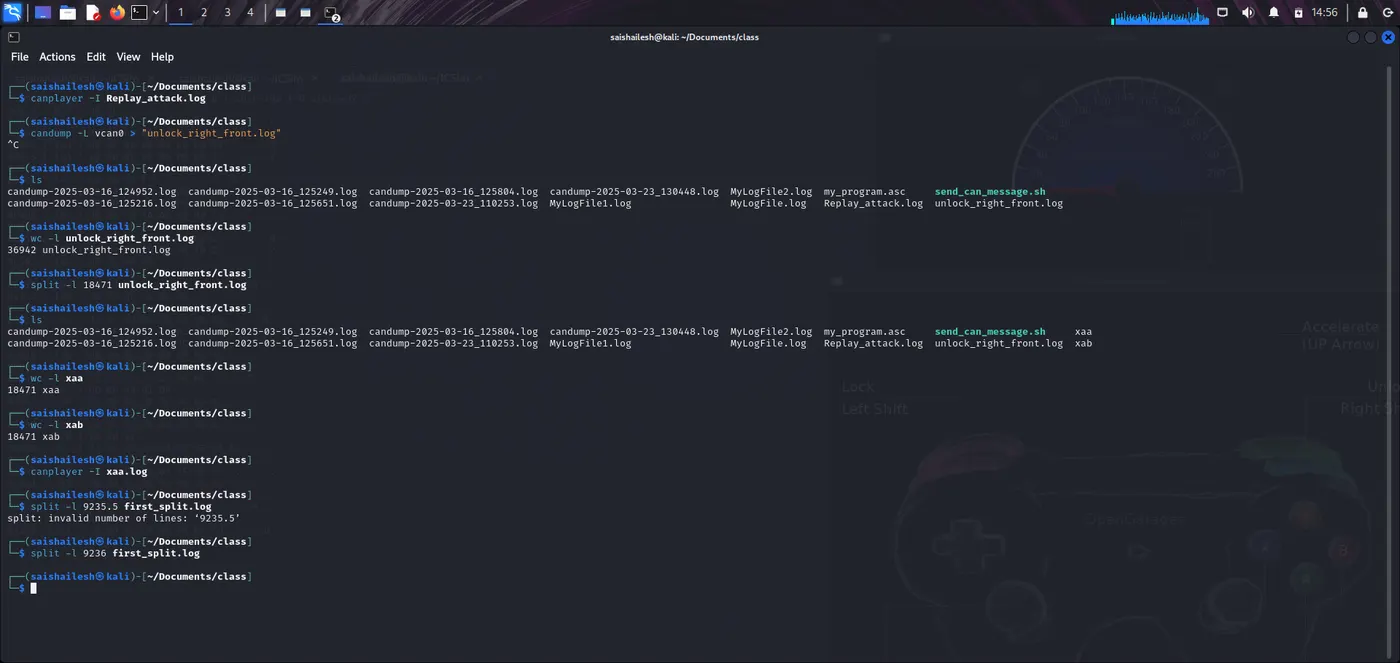
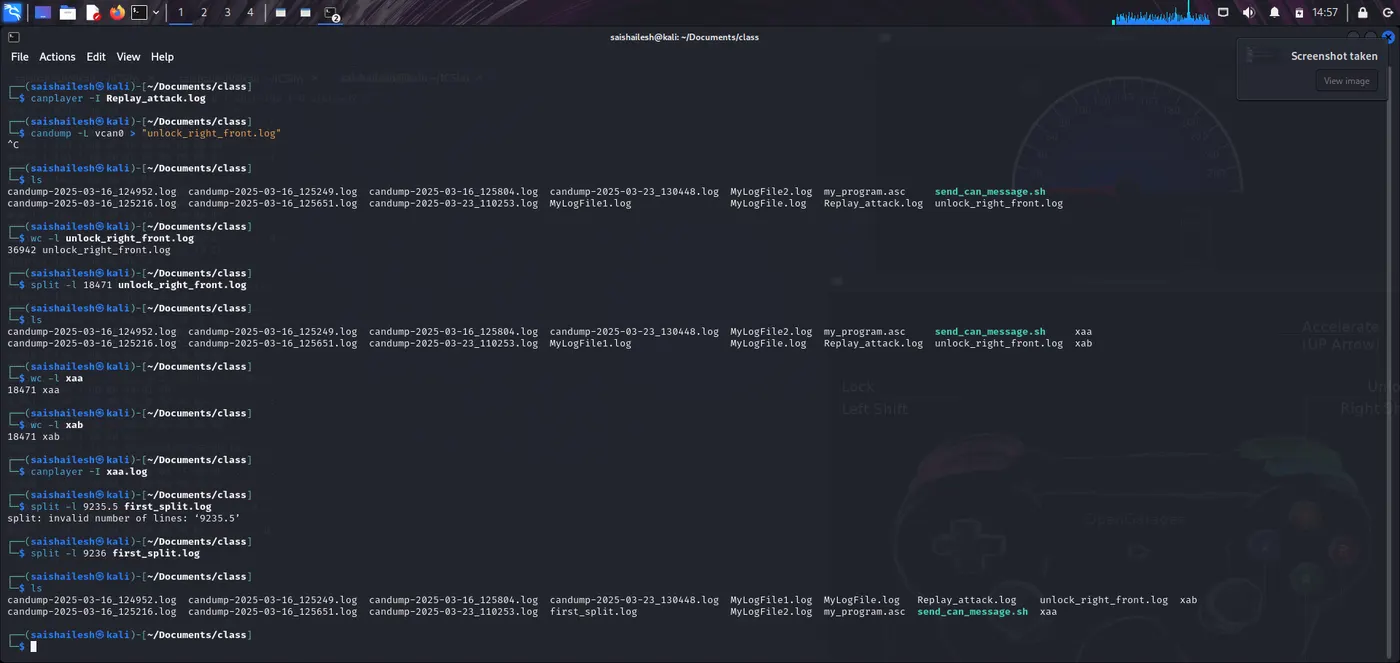
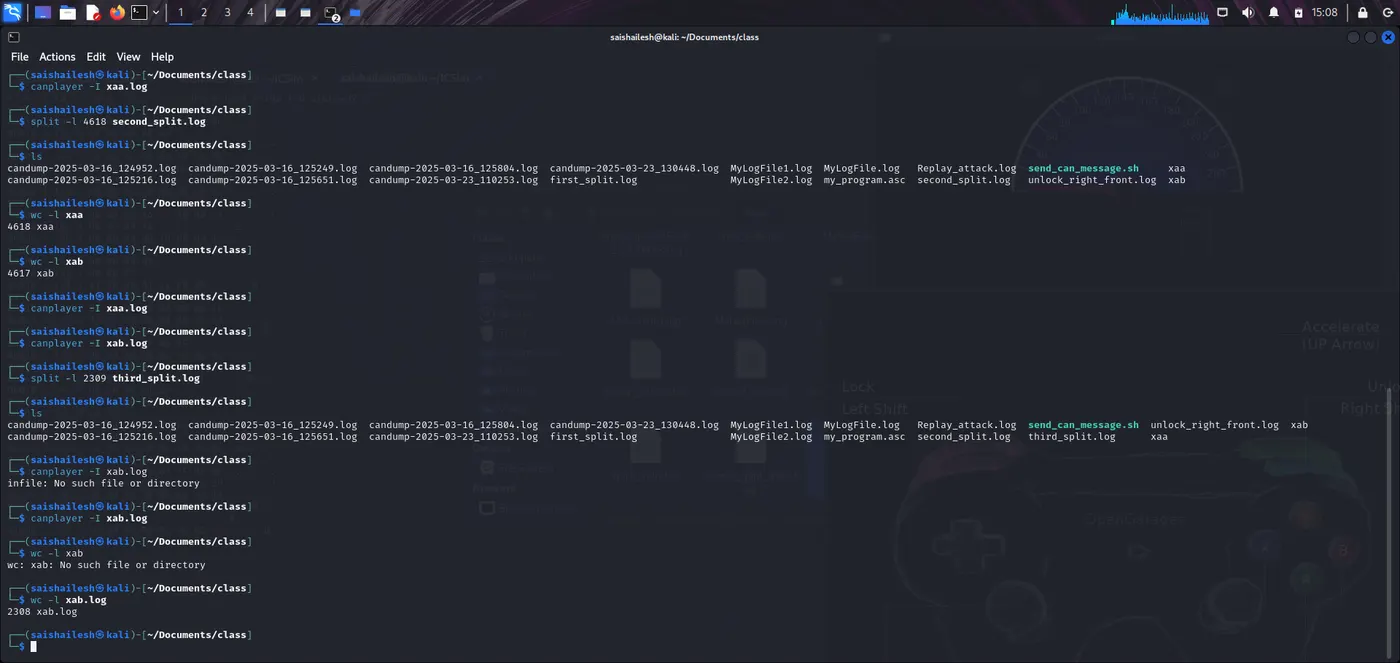
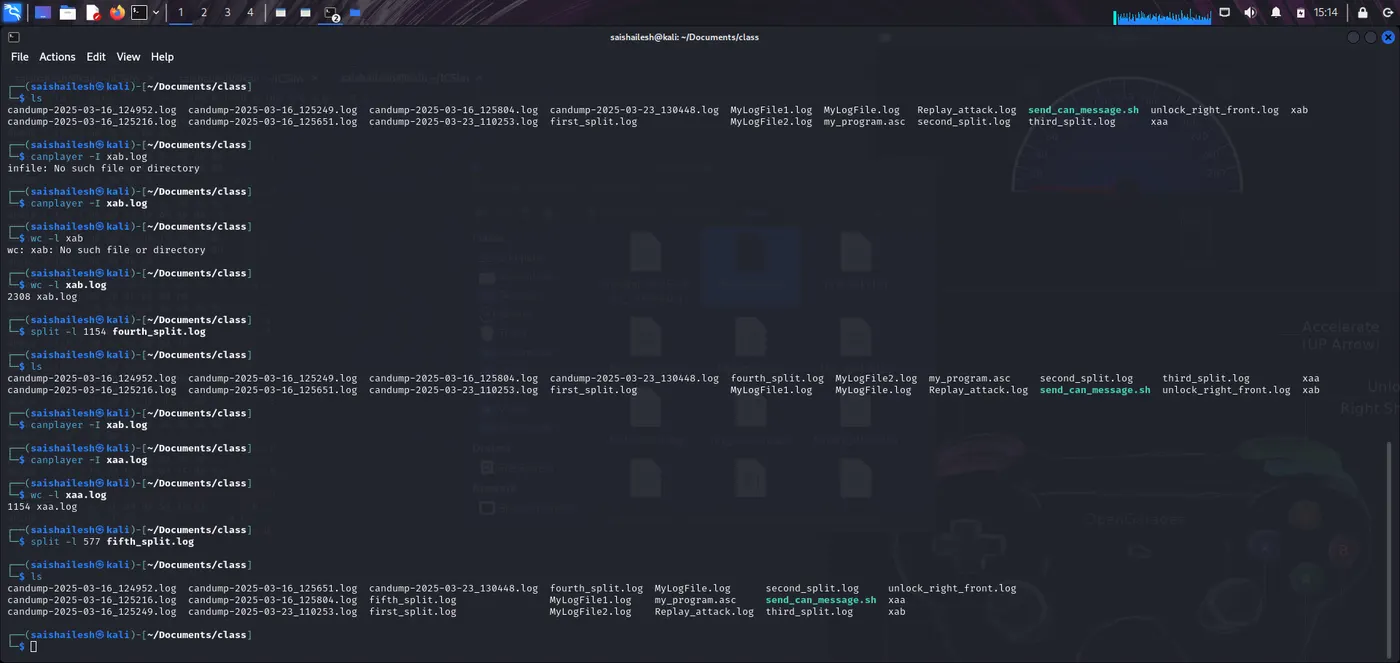
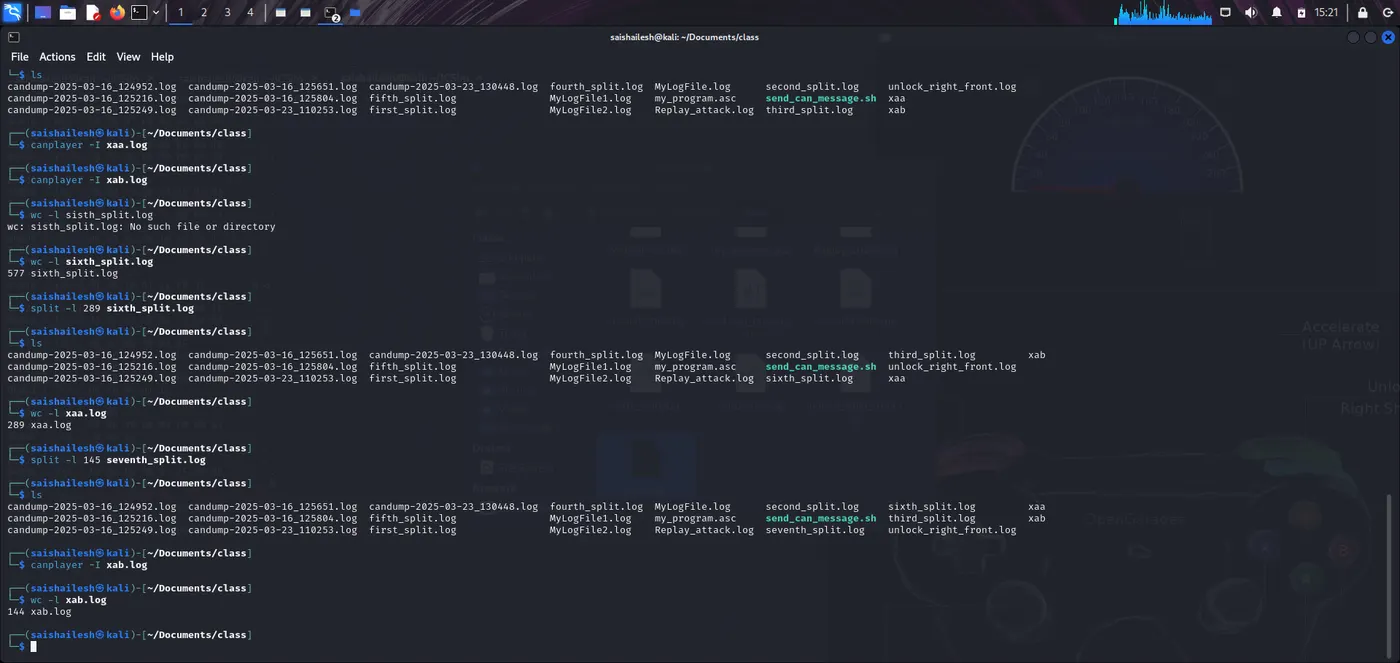
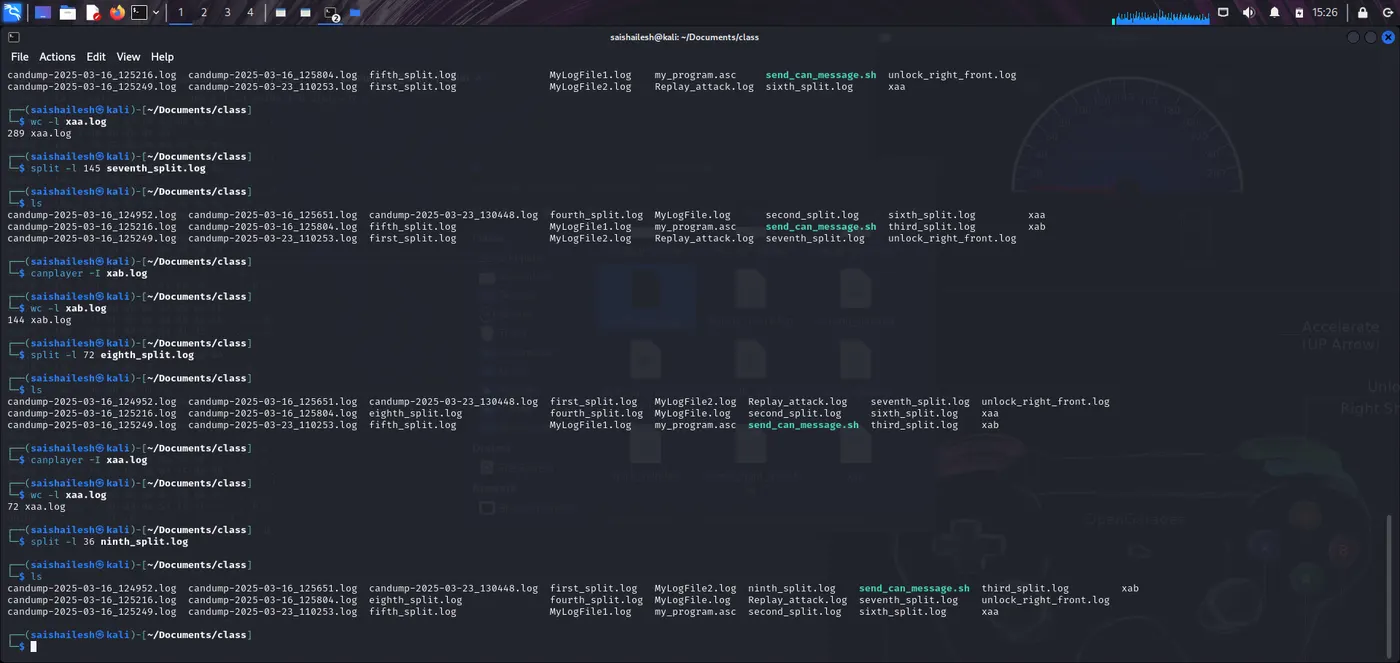
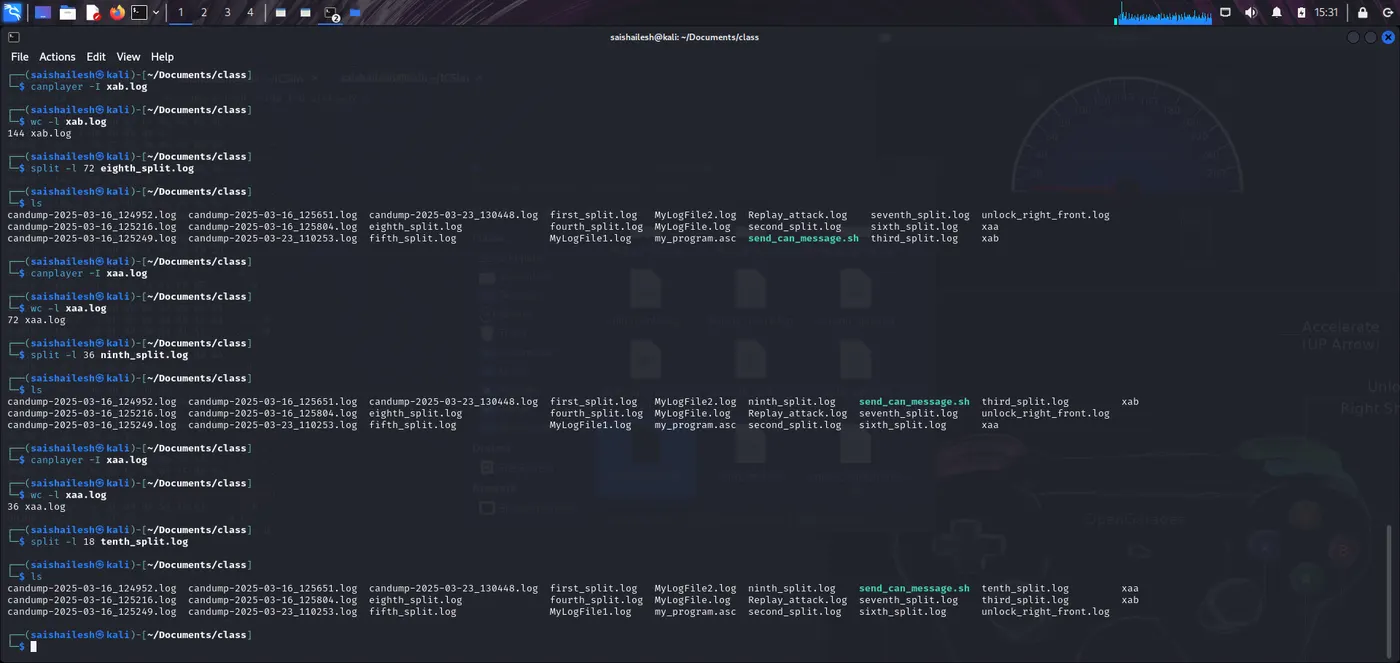
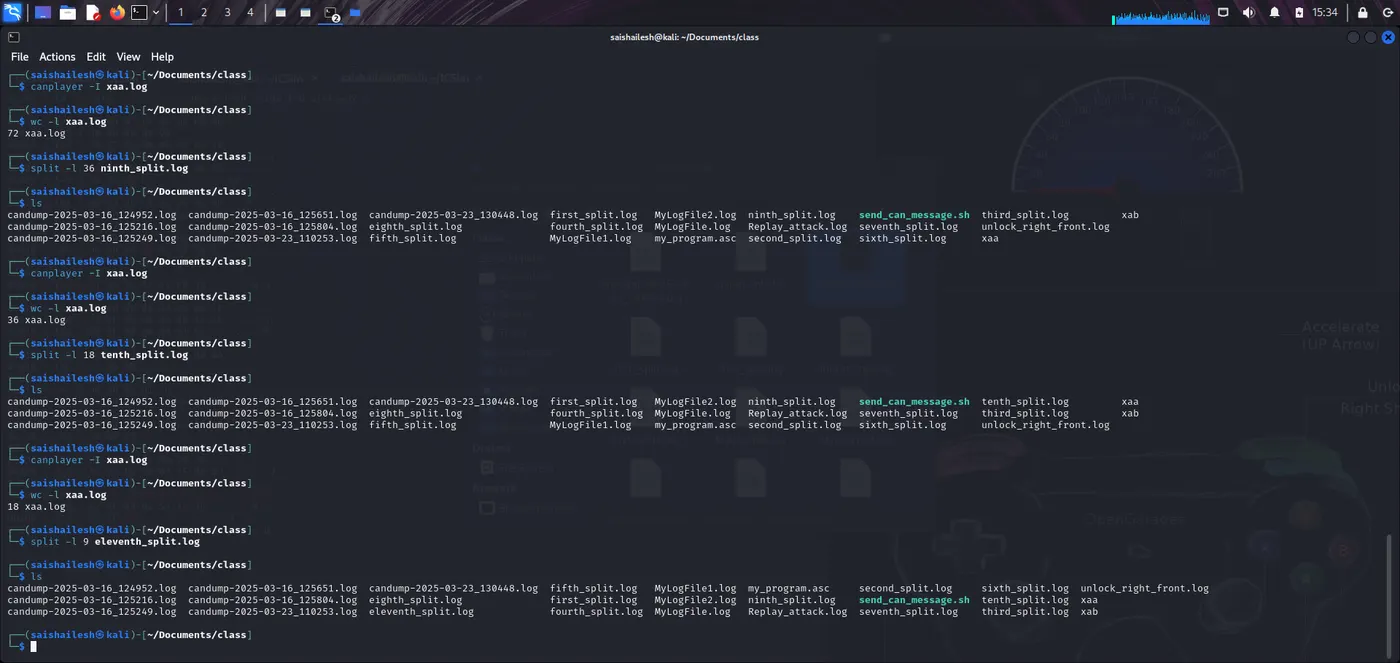
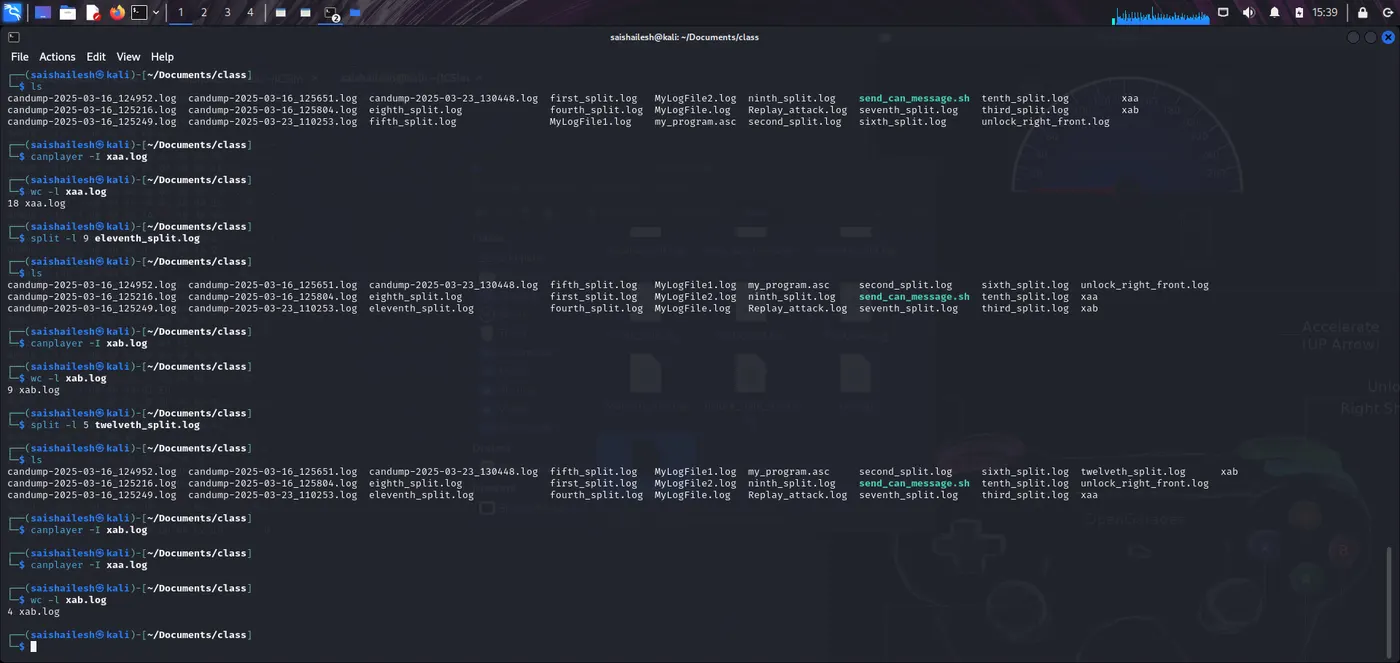
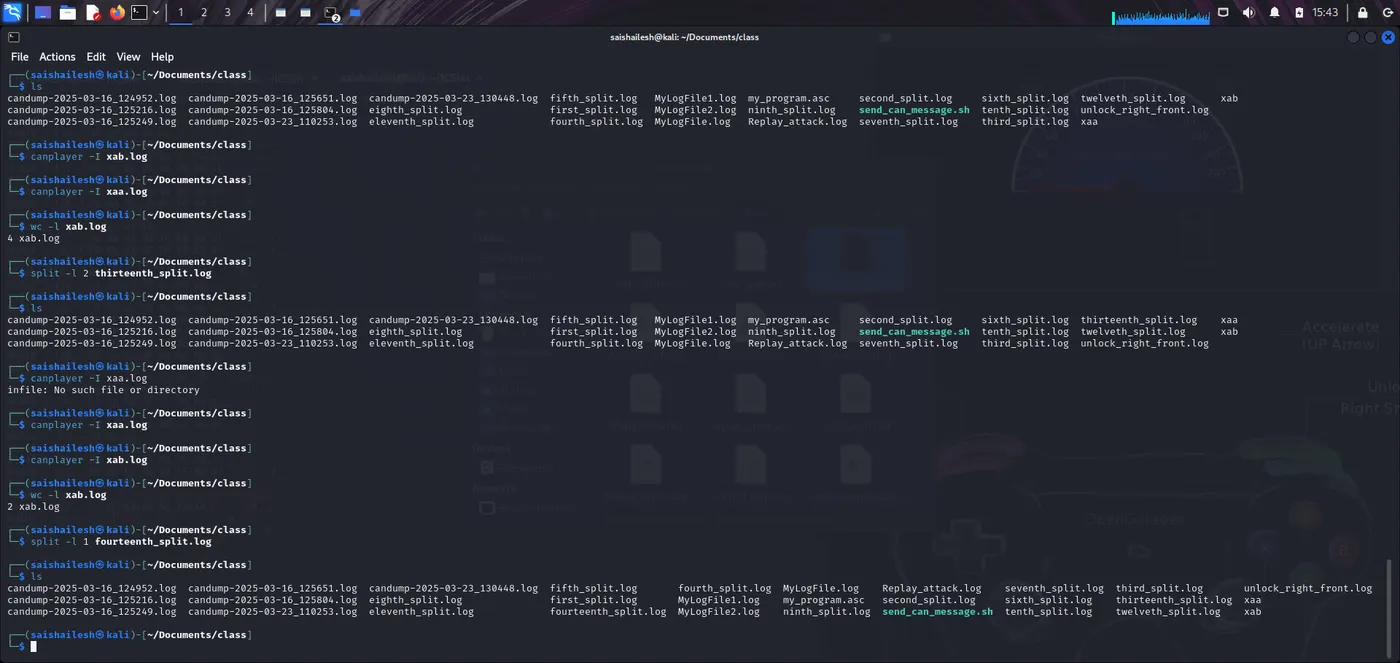
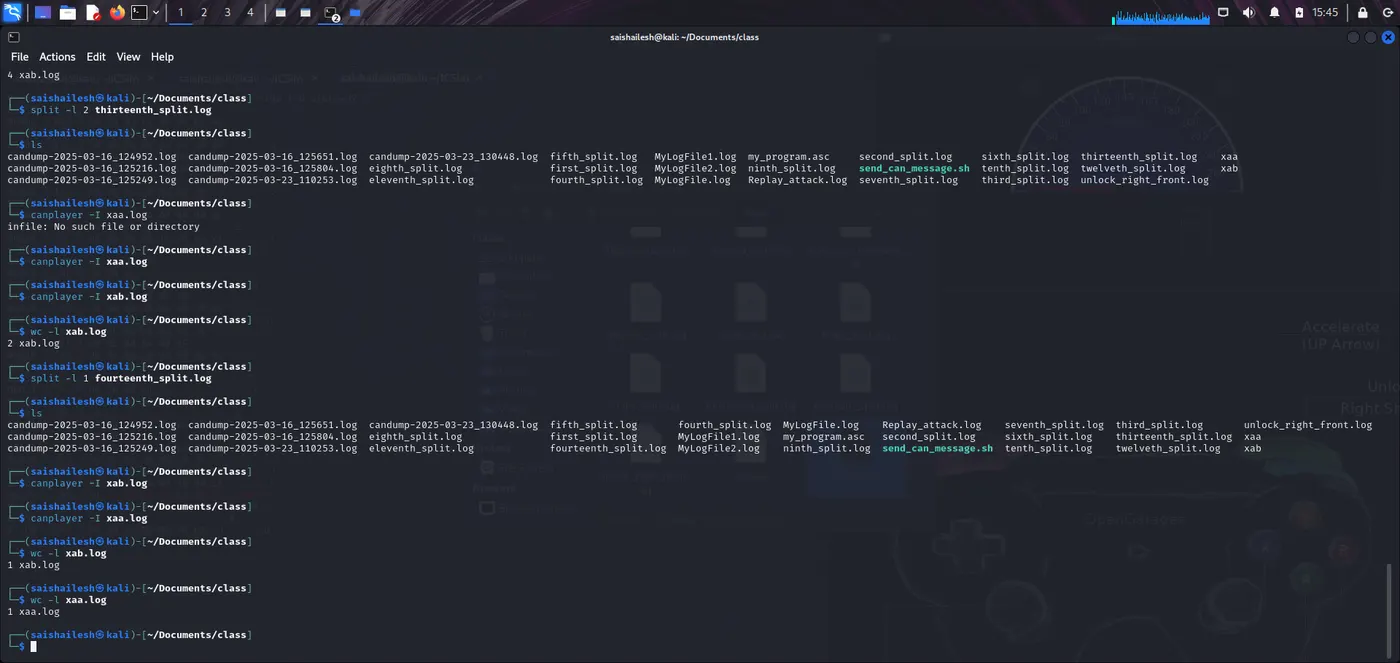
split -l (half of the word count) (name).log
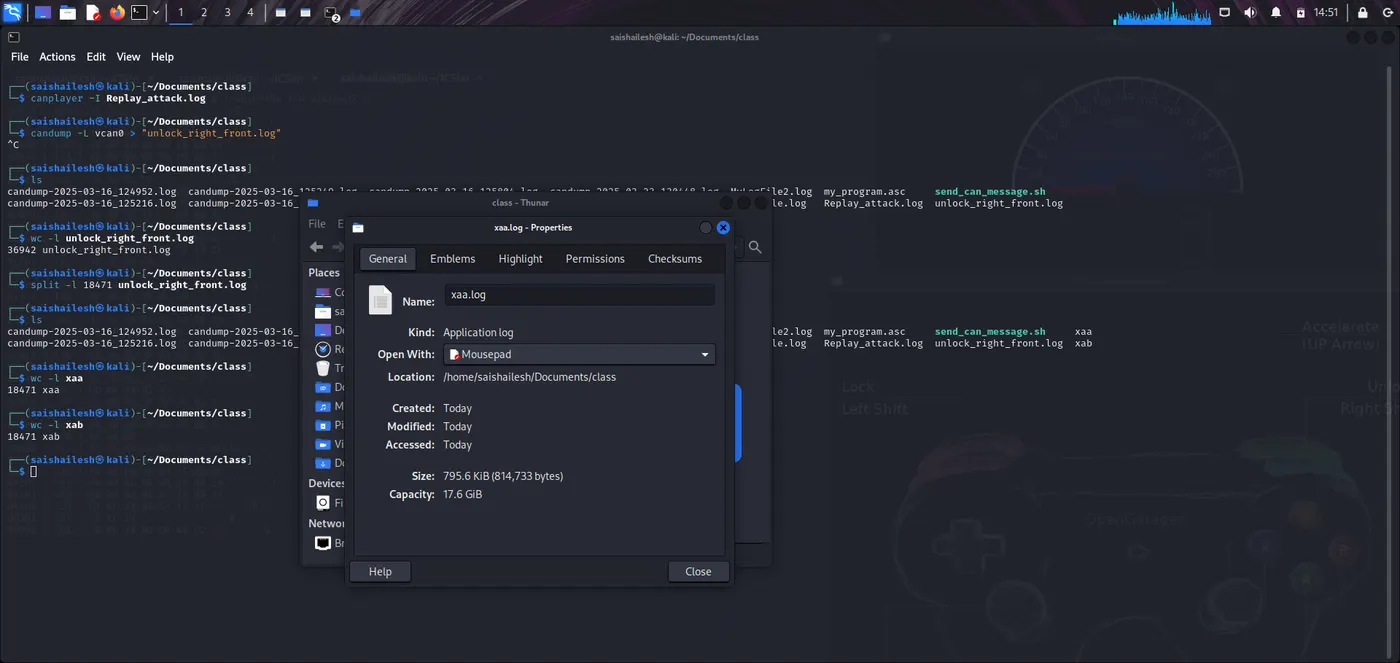
wc -l xaa.log
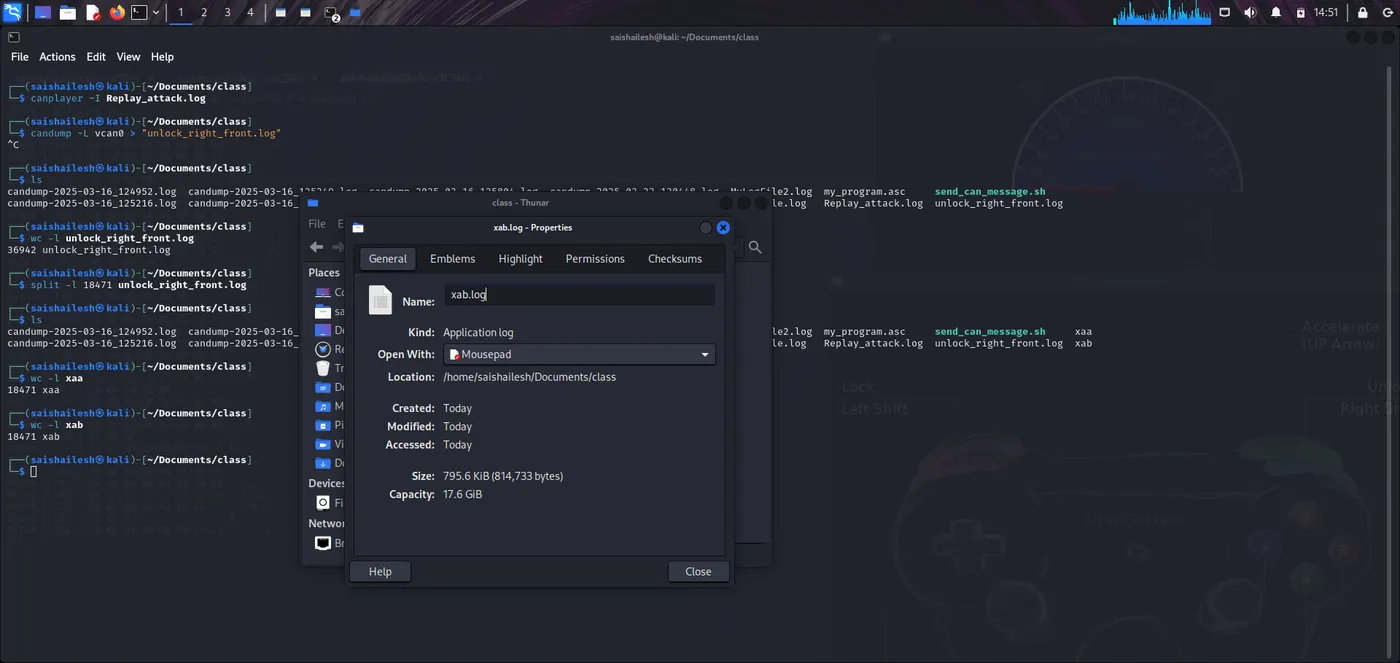
wc -l xab.log
-> Script Flow:
1. Asks for the path to log file.
2. Copies it to working file: current.log.
3. Splits it into part1.log and part2.log.
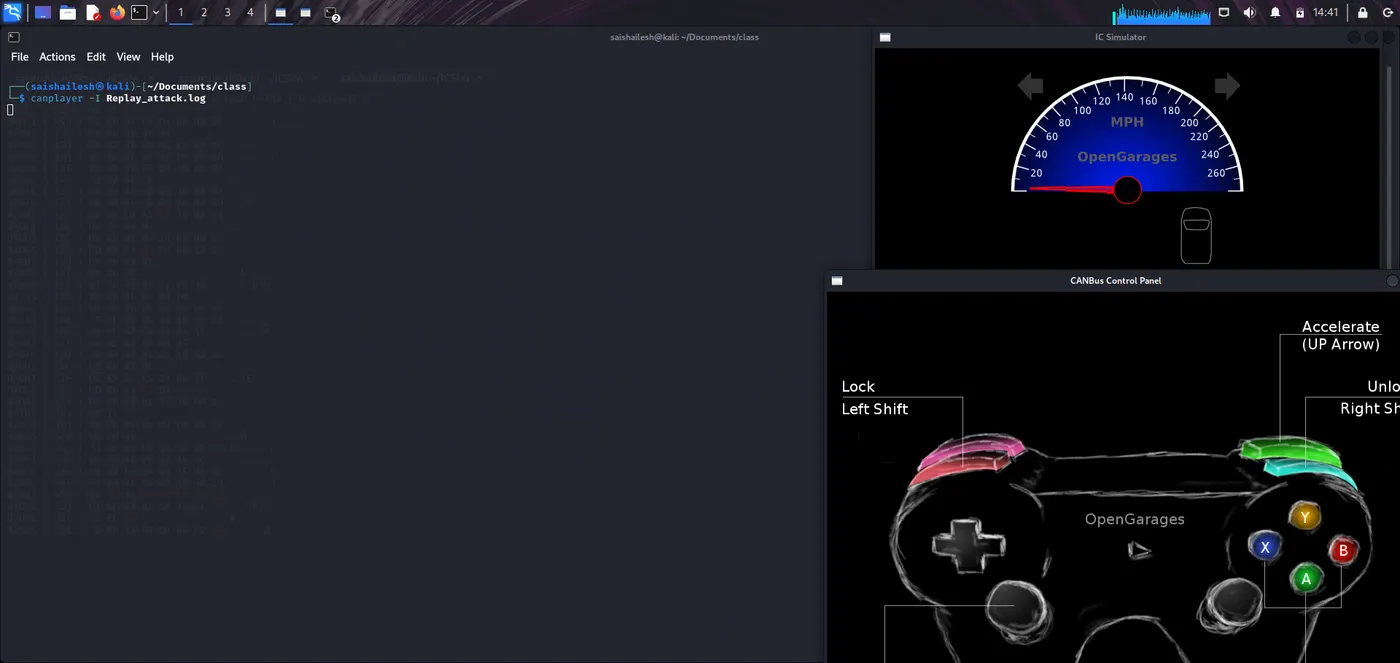
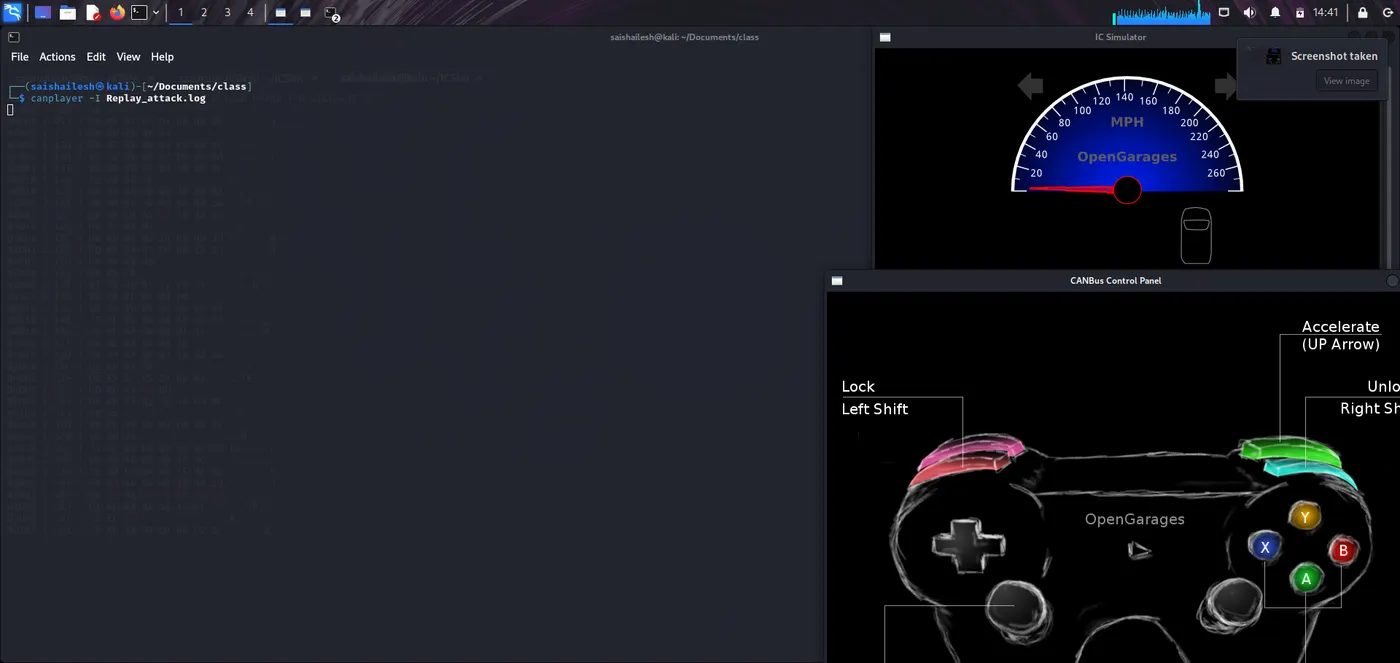
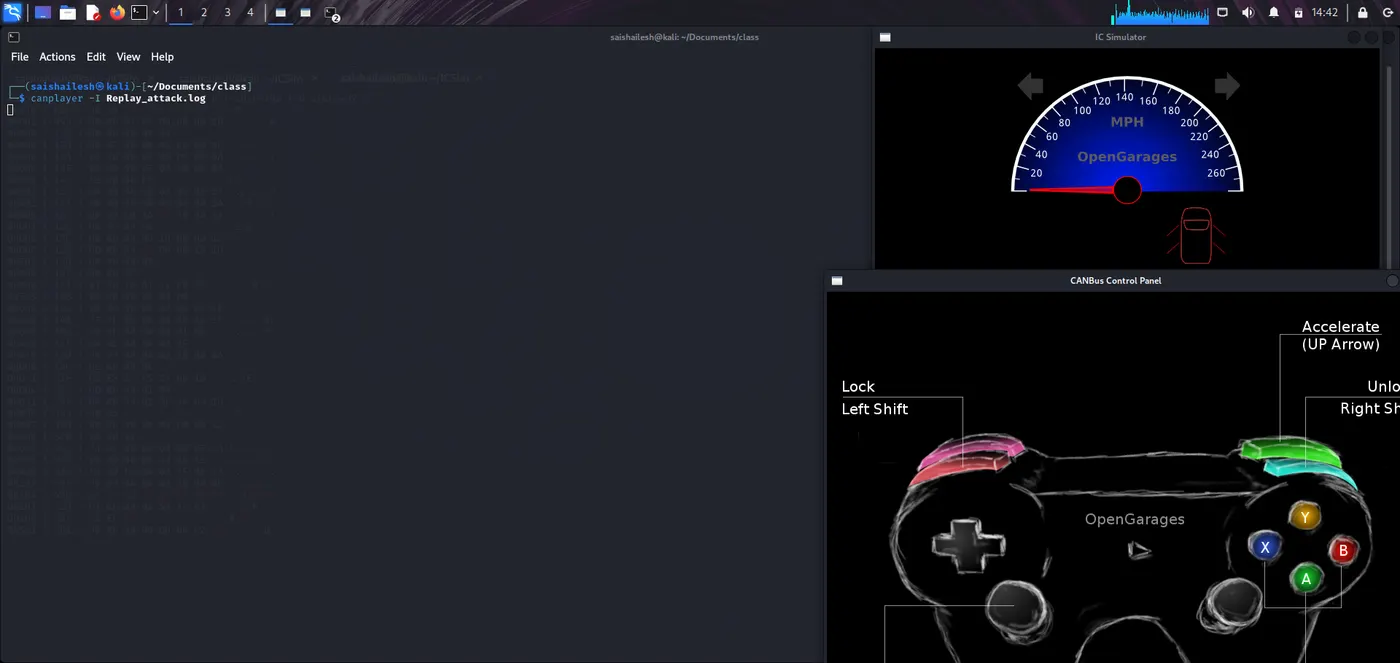
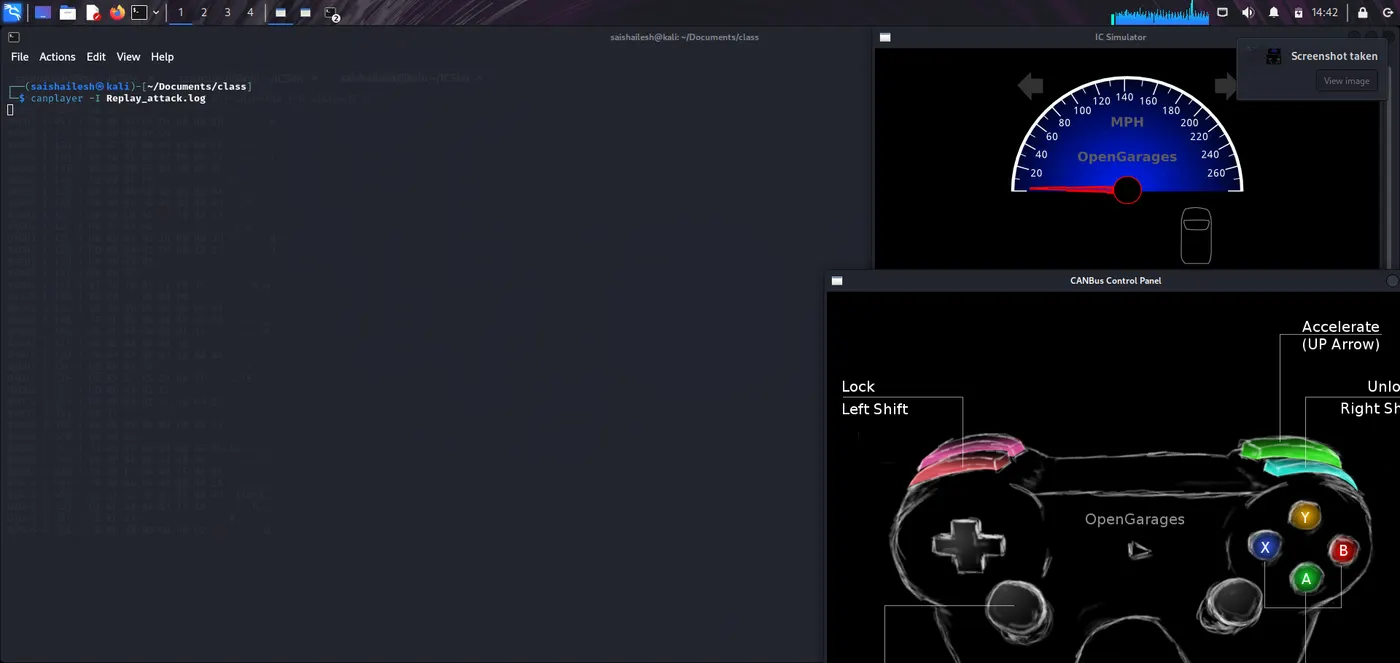
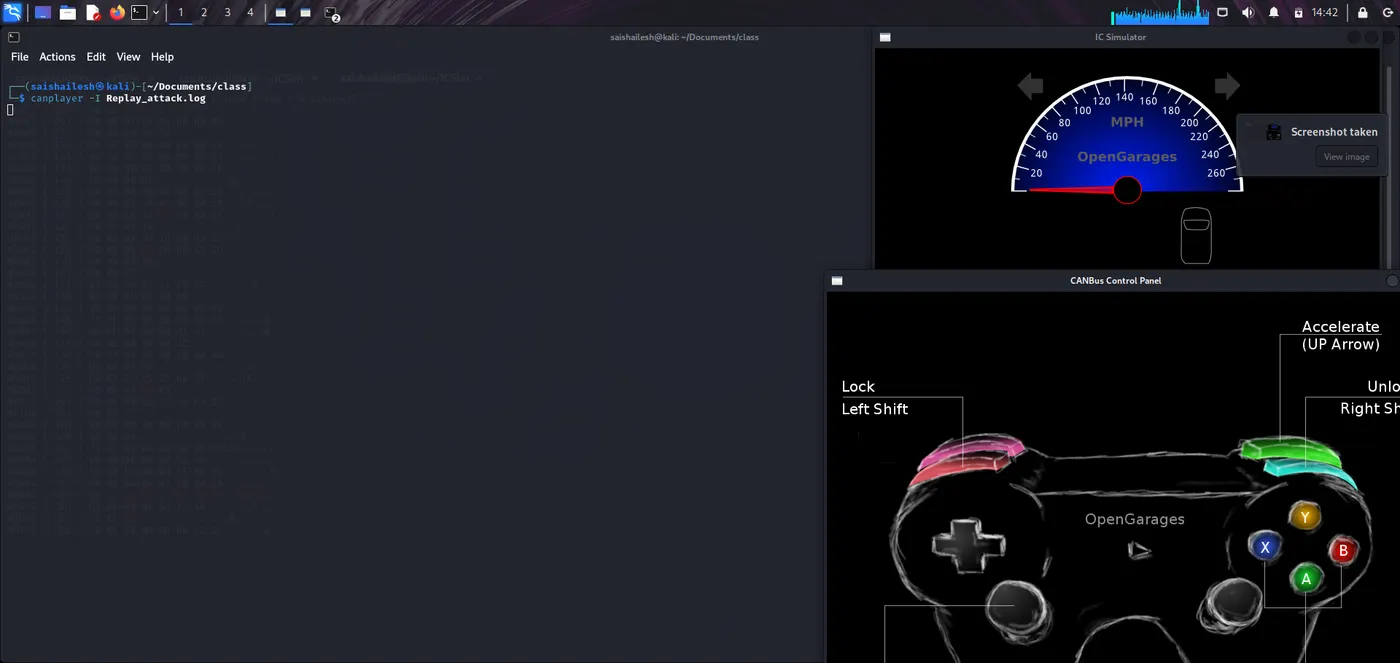
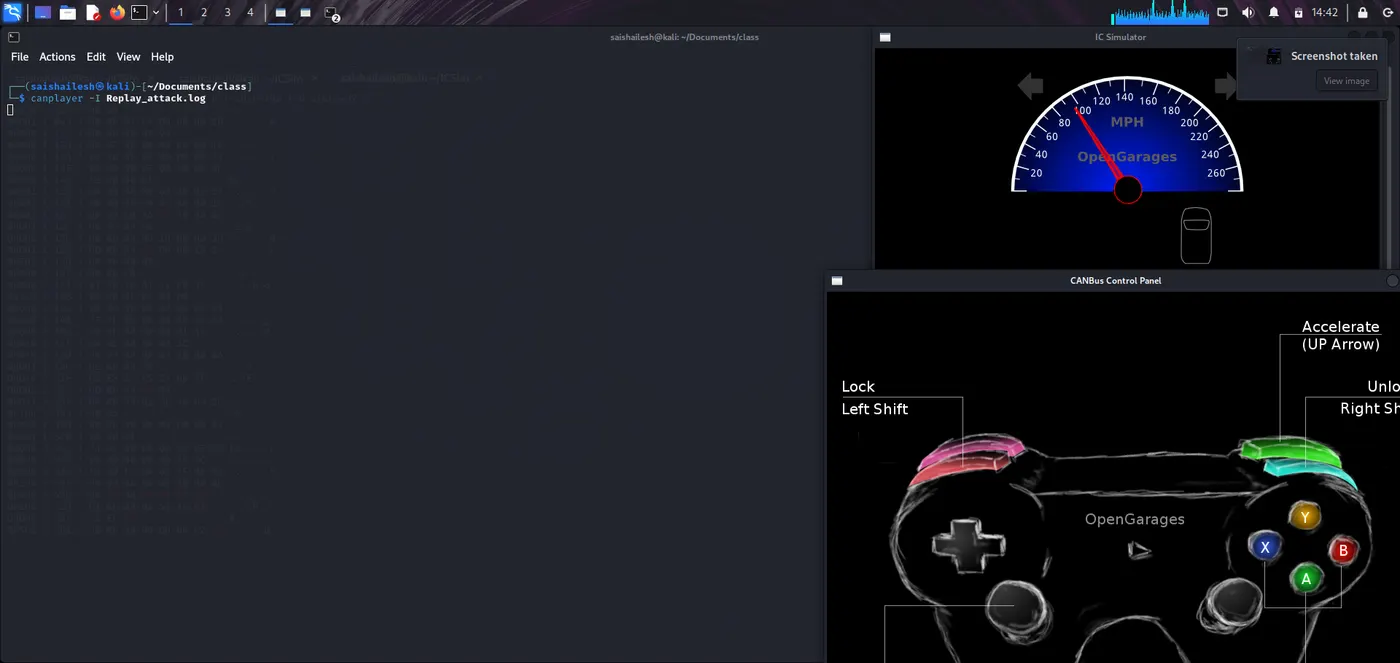
4. Replays part1 with canplayer.
5. Asks: “Did the signal occur again?”.
6. Keeps only the correct half.
7. Repeats until only 1 or 0 messages left.
Step 5: Output: