Project 2
Aim of the Project-
Design and Develop a simulink model to understand Energy analysis of EVs on different driving cycles
Theory-
Tractive force-
MASS:-
Mass is a measure of the amount of matter in an object Mass is usually measured in grams (g) or kilograms (kg). Mass measures the quantity of matter regardless of both its location in the universe and the gravitational force applied to it. An object's mass is constant in all circumstances: contrast this with its weight, a force that depends on gravity.
ROLLING RESISTANCE FORCE:-
Rolling resistance sometimes called rolling friction or rolling drag is the force resisting the motion when a body (such as a ball, bearing, or wheel) rolls on a surface. It is mainly caused by non-elastic effects: that is not all the energy needed for deformation (or movement) of the wheel. roadbed, etc.
A formula for rolling resistance force is given below.
Frr= μrr x m x g
Where
μrr= coefficient of rolling resistance varies with speed,
m=total mass
g=gravity.
AERODYNAMIC DRAG FORCE:-
The force on an object that resists its motion through a fluid is called drag. When the fluid is a gas like air, it is called aerodynamic drag air resistance
Fad=1/2*p*A*Cd*v^2
Where
p=Air density kg/m3
A=Frontal area m2
Cd=Drag coefficient
V=Velocity m/s.
The drag coefficient is a function of several parameters like the shape of the body. Reynolds number for the flow, Froude number. Mach number and Roughness of the surface
GRADEABILITY:- Hill climbing force
The steepness of grade that a motor vehicle is capable of the cabin at an efficient speed
TOTAL TRACTIVE FORCE:-
The term tractive effort is often used synonymously with tractive force to describe the pulling or pushing capability of a locomotive. In automotive engineering, the terms are distinctive: tractive effort is generally higher than tractive force by the amount of rolling resistance present. and both terms are higher than the amount of drawbar full by the total resistance present (including air resistance and grade).
Fte=TxG/R
Where
T=Motor Torque
G=Gear ratio
T=Tire radius
Fte = Frr+Fad+Fh
POWER:-
Power is a rate at which work is done, or energy is used. It is equal to the amount of work done divided by the time it takes to do the work. The unit of power is the Watt (W), which is equal to a joule per second (/s).
Total power = Total force x speed
FORMULA USED:-
Frr= μrr x m x g
Fd=1/2 *p*A*Cd*v^2
Fte=Frr+Fad
Total power = Total force * speed
Driving cycles:-
The term "driving cycle" refers to a test that measures vehicle speed over time. It is used to evaluate a car's fuel consumption and pollutants emissions in a standardized way to compare similar vehicles. The driving cycle is carried out on a chassis dynamometer, where tailpipes automobile emissions are collected and analyzed to assess emission.
Different Driving Cycles:
There are two kinds of driving cycles, the modal cycles as the European standard NEDC, or Japanese 10-15 Mode, and the transient cycles as the FTP-75 or Artemis cycle. The main difference is that modal cycles are a compilation of straight acceleration and constant speed periods and are not representative of real driver behavior, whereas transient cycles involve many speed variations, typical of on-road driving conditions.
European Driving Cycle
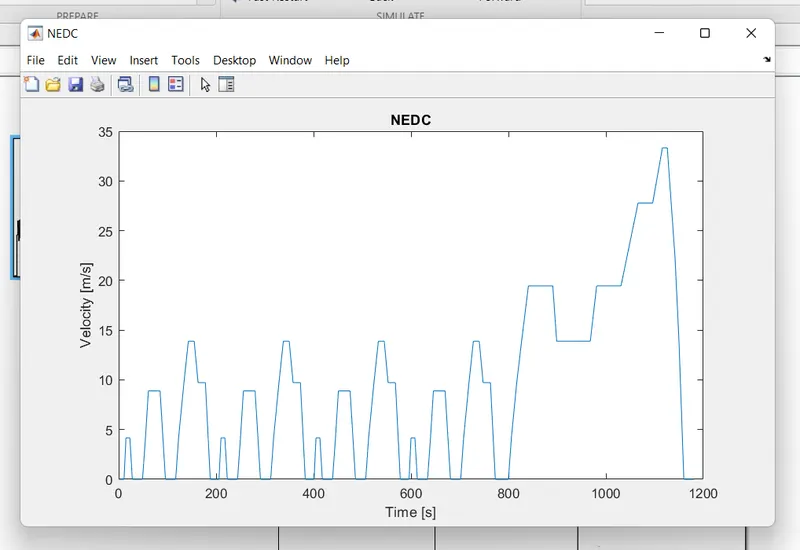
the NEDC graph:
NEDC
The NEDC is used as a reference cycle for homologating vehicles until the Euro6 norm in Europe and some other countries. It is made of an urban part called ECE, which is repeated four times, and an extra-urban part, the EUDC.
The Artemis driving cycle
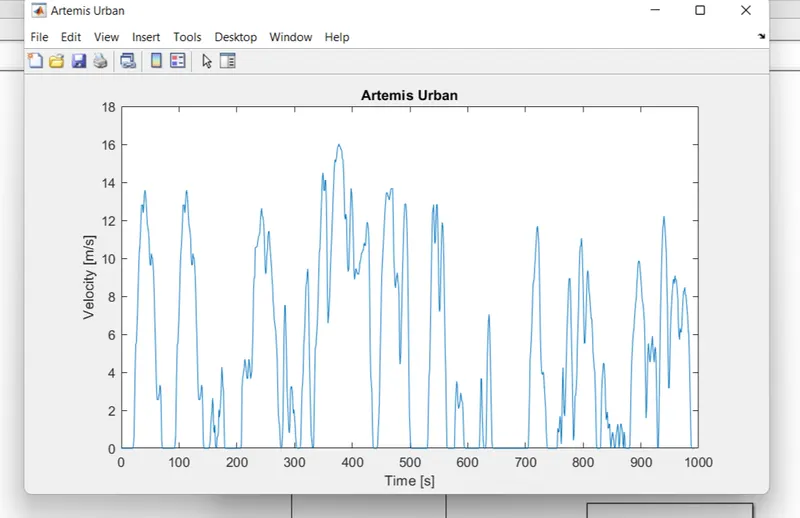
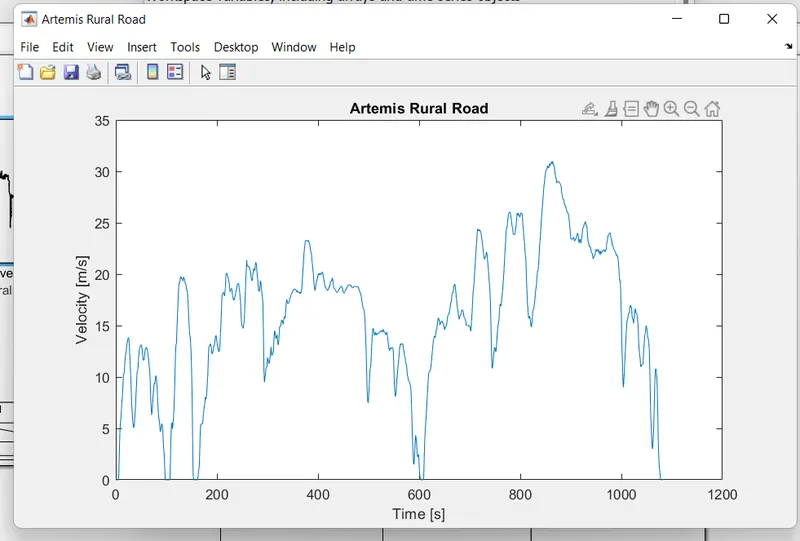
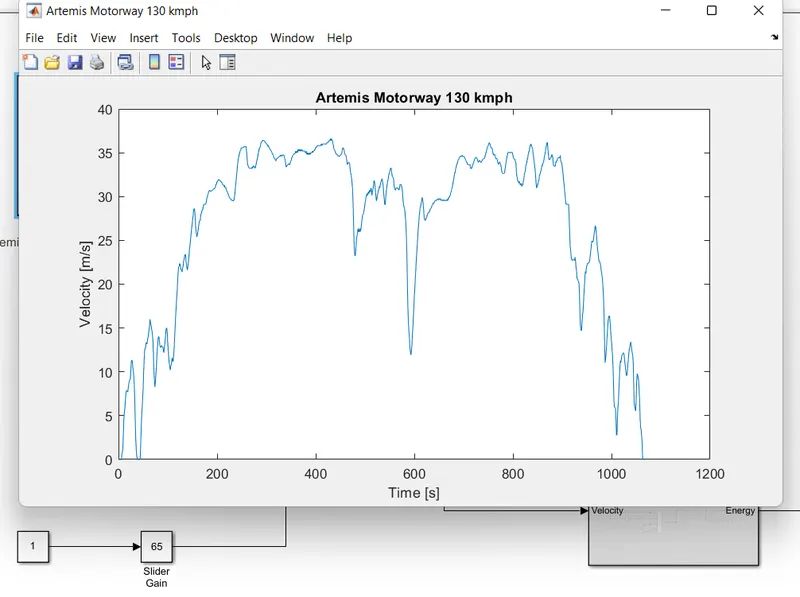
This cycle is based on a statistical study done in Europe within the so-called Artemis project. It is made of 3 different configurations, plus an additional variant: the urban cycle, the rural one, the motorway at 130 km/h, and the motorway at 150 km/h.
Artemis Urban cycleArtemis Rural cycle width=
Urban Rural Motorway 150 Motorway130
Distance 4870 m 17272 m 29545 m 28735 m
Duration 993 s 1082 s 1068 s 1068 s
Average speed 17.6 km/h 57.5 km/h 99.6 km/h 96.9 km/h
Design and Develop a Simulink model to understand the Energy analysis of EVs:-
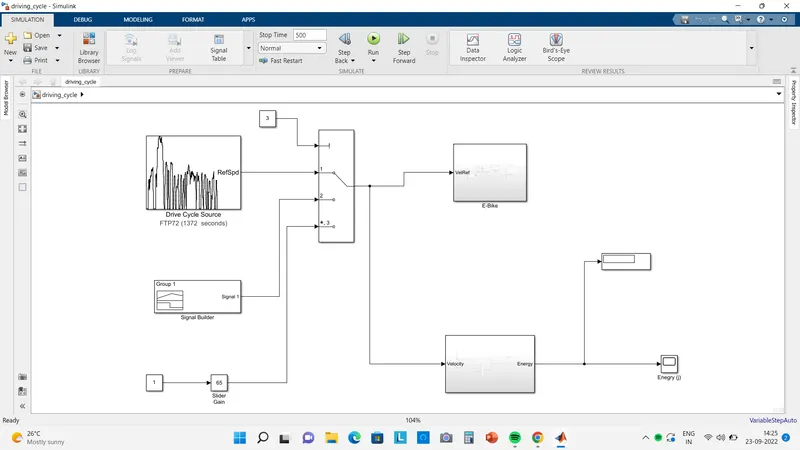
This Simulink is the main model of Powertrain for analyzing the energy of Electrical vehicles and its subsystem is as shown below.
Drive cycle source:
The Drive Cycle Source block generates a standard or user-specified longitudinal drive cycle. The block output is the specified vehicle longitudinal speed, which you can use to: Predict the engine torque and fuel consumption that a vehicle requires to achieve desired speed and acceleration for a given gear shift reference.
Signal builder: The Signal Builder block allows you to create interchangeable groups of piecewise linear signal sources and use them in a model. You can quickly switch the signal groups into and out of a model to facilitate testing.
A subsystem of energy:
E bike simulink model:
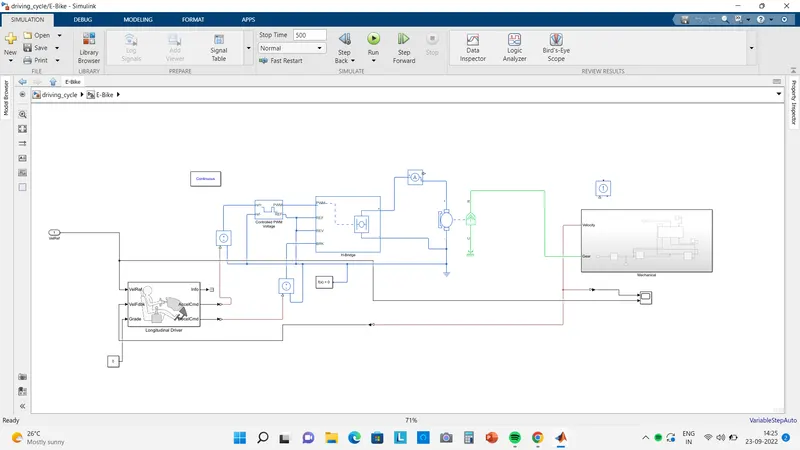
Here used the main block is the longitudinal driver block
The Longitudinal Driver block implements a longitudinal speed-tracking controller. Based on reference and feedback velocities, the block generates normalized acceleration and braking commands that can vary from 0 through 1
H bridge:- The actual use of discrete components to make an H-bridge is very troublesome, there are already many more commonly used IC solutions on the market, such as the commonly used L293D, L298N, TA7257P, SN754410, etc... Connect the power supply and the motor, and then the motor can be driven by inputting the control signal.
Main used of driving cycle and why you need the driving cycle at different types:
Drive cycles are typically used to assess vehicle performance parameters, perform system sizing and perform accelerated testing on a test bed or a virtual test environment, hence reducing the expenses on-road tests. This study is an attempt to design a relatively robust process to generate a real-world drive cycle.
To assess the performance of a vehicle (fuel economy, emission tests)
To analyze battery state and energy consumption in Electric Vehicles
To simulate the vehicle model prior to the actual development
Conclusion:-
On average, it takes 30 to 60 minutes to complete the driving cycle. However, it may vary depending on the type of driving being done, how long it takes to reach the required speed limit, and how many stops are made. How many miles does the Driving Cycle cover? The driving cycle covers about 50 to 100 miles in total.
Select the route in which the driving cycle has to be developed based on the application of the drive cycle. For example, the real
performance of a vehicle in city traffic can be analyzed using a transient driving cycle which has been developed with data collected from the vehicle.