Project 2
Q1
wine_red=pd.read_csv('winequality-red.csv')
wine_red.head()
wine_white=pd.read_csv('winequality-white.csv')
wine_white.head()
Q2.
wine_white.info()
wine_red.info()
Q3
wine_red.isnull().sum()
wine_white.isnull().sum()
Q4
wine_red[wine_red.duplicated()]
wine_red.drop_duplicates()
wine_white[wine_white.duplicated()]
wine_white.drop_duplicates()
Q5
wine_red.nunique()
wine_white.nunique()
Q6
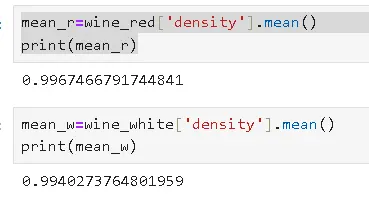
Q7
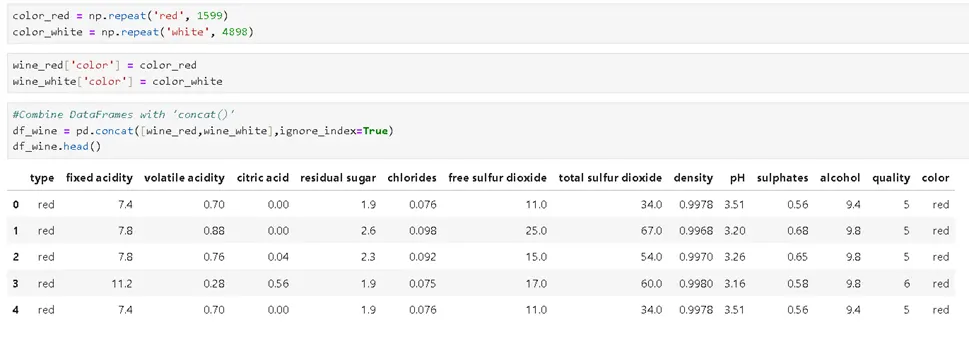
Q8
df_wine.isnull().sum()
df_wine[df_wine.duplicated()]
df_wine.drop_duplicates()
Q9
df_wine['color'] = df_wine['color'].infer_objects(copy=False)
# Remove outliers for each numerical column
for col in df_wine.select_dtypes(include=[np.number]).columns:
Q1 = df_wine[col].quantile(0.25)
Q3 = df_wine[col].quantile(0.75)
IQR = Q3 - Q1
lower_bound = Q1 - 1.5 * IQR
upper_bound = Q3 + 1.5 * IQR
df_wine = df_wine[(df_wine[col] >= lower_bound) & (df_wine[col] <= upper_bound)]
# Display the cleaned DataFrame
print("Cleaned DataFrame without outliers:")
df_wine
Q10
columns_to_check = ['fixed acidity','volatile acidity','citric acid','residual sugar','chlorides','free sulfur dioxide','density','pH','sulphates','alcohol','quality']
# Calculate the Z-scores for each data point in the specified columns
z_scores = np.abs((df_wine[columns_to_check] - df_wine[columns_to_check].mean()) / df_wine[columns_to_check].std())
# Set the threshold for outlier detection (Z-score greater than 3)
threshold = 3
# Remove the rows with outliers
df_wine[(z_scores < threshold)]
correlation=df_wine['alcohol'].corr(df_wine['quality'])
print(correlation)
# Plot a scatter plot to visualize the relationship
sns.scatterplot(x='alcohol', y='quality', data=df_wine)
# Display the plot
plt.show()
Q11
correlation=df_wine['citric acid'].corr(df_wine['pH'])
print(correlation)
Q12
from sklearn.linear_model import LinearRegression
# Select the predictor (citric acid) and target variable (pH)
X = df_wine[['citric acid']]
y = df_wine['pH']
# Create an instance of the LinearRegression model
model = LinearRegression()
# Fit the model to the data
model.fit(X, y)
# Get the regression coefficients
intercept = model.intercept_
slope = model.coef_[0]
print("Regression equation : pH = {:.2f} + {:.2f} * citric acid ".format(intercept,slope))
plt.figure(figsize=(10, 6))
plt.scatter(X, y, color='blue', label='Data points')
plt.plot(X, model.predict(X), color='red', linewidth=2, label='Regression line')
plt.xlabel('Citric Acid')
plt.ylabel('pH')
plt.title('Regression of pH on Citric Acid')
plt.legend()
plt.show()
Q13
from scipy.stats import chi2_contingency
# Create a contingency table
contingency_table = pd.crosstab(df_wine["citric acid"], df_wine["pH"])
# Calculate the chi-square statistic
chi_square_statistic, p_value, df, _ = chi2_contingency(contingency_table)
# Print the results
print("Chi-square statistic:", chi_square_statistic)
print("P-value:", p_value)
# Interpretation
if p_value < 0.05:
print("The variables are statistically dependent.")
else:
print("The variables are statistically independent.")
Q14
bin_edges = [2.72,3.11,3.21,3.32,4.01]
bin_names = ['very_high','high','medium','low']
df_wine['acidity_levels'] = pd.cut(df_wine['pH'], bin_edges, labels=bin_names)
df_wine.head()
Q15
df_wine.groupby('acidity_levels',observed=True)['quality'].mean()
Q16
drdf.groupby('color',observed=True)['quality'].mean()
Q17
#low_alcohol = df_wine[df_wine['alcohol'] < 10.3]
low_alcohol=df_wine.query('alcohol < 10.3')
low_alcohol
#high_alcohol = df_wine[df_wine['alcohol'] >= 10.3]
high_alcohol =df_wine.query('alcohol >= 10.3')
high_alcohol
Q18
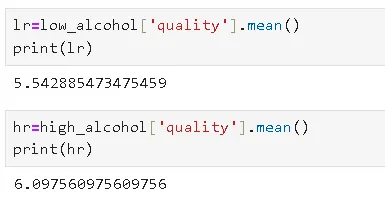
Q19
correlation = df_wine['residual sugar'].corr(df_wine['quality'])
print(correlation)
# visualize the relationship between sweetness level and wine ratings using a scatter plot
import matplotlib.pyplot as plt
plt.scatter(df_wine['residual sugar'], df_wine['quality'])
plt.xlabel('Residual Sugar')
plt.ylabel('Quality')
plt.title('Relationship between Sweetness and Wine Quality')
plt.show()
Q20
# Count the number of occurrences based on ratings and color
count_by_ratings_and_color = df_wine.groupby(['quality', 'color']).size()
# Print the counts
print(count_by_ratings_and_color)
Q21
from scipy import stats
# Extract the density for red and white wines
red_wine_density = df_wine.loc[df_wine['color'] == 'red', 'density']
white_wine_density = df_wine.loc[df_wine['color'] == 'white', 'density']
# Perform a t-test
t_statistic, p_value = stats.ttest_ind(red_wine_density, white_wine_density, equal_var=False)
# Compare the p-value to the significance level (e.g., 0.05)
alpha = 0.05
if p_value < alpha:
print("The density of red wine and white wine is significantly different.")
else:
print("The density of red wine and white wine is not significantly different.")
Q22
from math import sqrt
# Replace the placeholders with the actual counts and totals from your dataset
count_white_rating3 = 50 # Replace with the count of white wines with rating 3
total_white_wines = 200 # Replace with the total count of white wines
count_red_rating3 = 30 # Replace with the count of red wines with rating 3
total_red_wines = 150 # Replace with the total count of red wines
# Calculate the proportions for white wine with rating 3 and red wine with rating 3
proportion1 = count_white_rating3 / total_white_wines
proportion2 = count_red_rating3 / total_red_wines
# Calculate the sample sizes
n1 = total_white_wines
n2 = total_red_wines
standard_error = sqrt((proportion1 * (1 - proportion1) / n1) + (proportion2 * (1 - proportion2) / n2))
from scipy.stats import norm
# Set the desired confidence level (e.g., 95%)
confidence_level = 0.95
# Calculate the critical value (z-score) using the norm function from scipy.stats
critical_value = norm.ppf((1 + confidence_level) / 2)
# Calculate the margin of error
margin_of_error = critical_value * standard_error
# Calculate the lower and upper bounds of the confidence interval
lower_bound = (proportion1 - proportion2) - margin_of_error
upper_bound = (proportion1 - proportion2) + margin_of_error