Project 2
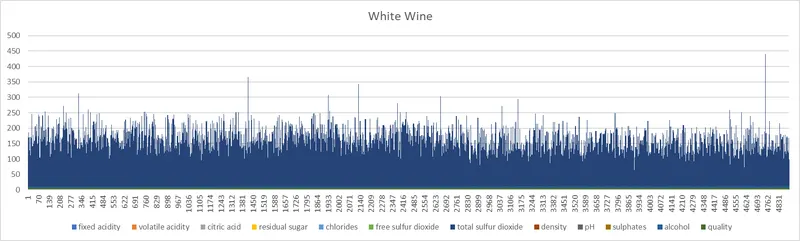
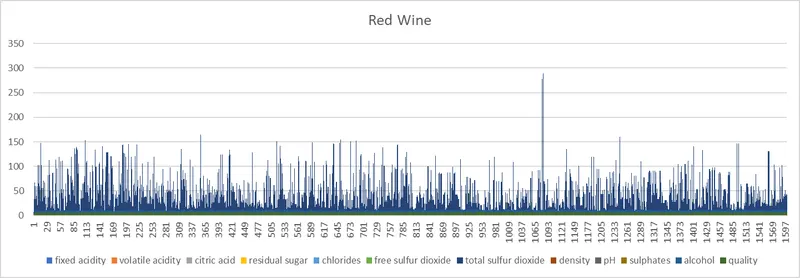
1.Display the data of white wine and red wine
Ans: I am sending a bar chart for represnting data in graphical way
2.Get the size of both white wine and red wine.
Ans:
The white wine data size is more compared to red wine
white wine --> 4899 rows
red winr --> 1600 rows
3.Get the number of null in both type of wines
Ans: No null values
Both wines data is checked
note: a NULL means that there is no value, we're looking at a blank/empty cell, and 0 means the value itself is 0. So 0 is not considered as a null value
4.Check for duplicates and remove them in both type of wine data
Ans: Checked & found so many duplicates are there & removed in both wine data
5.Get the number of uniques values in all Feature and print them
Ans:
After removing all duplicates in each column in both wine data inly a few rows are survived
for red wine
| fixed acidity | volatile acidity | citric acid | residual sugar | chlorides | free sulfur dioxide | total sulfur dioxide | density | pH | sulphates | alcohol | quality |
| 7.4 | 0.7 | 0 | 1.9 | 0.076 | 11 | 34 | 0.9978 | 3.51 | 0.56 | 9.4 | 5 |
| 5.7 | 1.13 | 0.09 | 1.5 | 0.172 | 7 | 19 | 0.994 | 3.5 | 0.48 | 9.8 | 4 |
| 10.4 | 0.55 | 0.23 | 2.7 | 0.091 | 18 | 48 | 0.9994 | 3.22 | 0.64 | 10.3 | 6 |
| 15.6 | 0.685 | 0.76 | 3.7 | 0.1 | 6 | 43 | 1.0032 | 2.95 | 0.68 | 11.2 | 7 |
for white wine
| fixed acidity | volatile acidity | citric acid | residual sugar | chlorides | free sulfur dioxide | total sulfur dioxide | density | pH | sulphates | alcohol | quality |
| 7 | 0.27 | 0.36 | 20.7 | 0.045 | 45 | 170 | 1.001 | 3 | 0.45 | 8.8 | 6 |
| 7.9 | 0.18 | 0.37 | 1.2 | 0.04 | 16 | 75 | 0.992 | 3.18 | 0.63 | 10.8 | 5 |
| 5.2 | 0.44 | 0.04 | 1.4 | 0.036 | 43 | 119 | 0.9894 | 3.36 | 0.33 | 12.1 | 8 |
6.Print the mean density of both the sets
Ans:
for white wine mean density is
| 0.994133 |
for red wine mean density is
| 0.9986 |
7.Combine both the datasets with color of the wine in column
Ans: combined data set
| fixed acidity | volatile acidity | citric acid | residual sugar | chlorides | free sulfur dioxide | total sulfur dioxide | density | pH | sulphates | alcohol | quality |
| 7.4 | 0.7 | 0 | 1.9 | 0.076 | 11 | 34 | 0.9978 | 3.51 | 0.56 | 9.4 | 5 |
| 5.7 | 1.13 | 0.09 | 1.5 | 0.172 | 7 | 19 | 0.994 | 3.5 | 0.48 | 9.8 | 4 |
| 10.4 | 0.55 | 0.23 | 2.7 | 0.091 | 18 | 48 | 0.9994 | 3.22 | 0.64 | 10.3 | 6 |
| 15.6 | 0.685 | 0.76 | 3.7 | 0.1 | 6 | 43 | 1.0032 | 2.95 | 0.68 | 11.2 | 7 |
| 7 | 0.27 | 0.36 | 20.7 | 0.045 | 45 | 170 | 1.001 | 3 | 0.45 | 8.8 | 6 |
| 7.9 | 0.18 | 0.37 | 1.2 | 0.04 | 16 | 75 | 0.992 | 3.18 | 0.63 | 10.8 | 5 |
| 5.2 | 0.44 | 0.04 | 1.4 | 0.036 | 43 | 119 | 0.9894 | 3.36 | 0.33 | 12.1 | 8 |
8.Remove the null values if any
Ans: no null values
note: a NULL means that there is no value, we're looking at a blank/empty cell, and 0 means the value itself is 0. So 0 is not considered as a null value
9.Remove the outliers if any
Ans: no outliers
10.Do wines with higher alcohol content receive better ratings?
Ans:
By looking into the details, we can see that good quality wines have higher levels of alcohol on average, have a lower volatile acidity on average, higher levels of sulphates on average, and higher levels of residual sugar on average
Based on our data YES.
11.Find correlation between citric acid content and PH.
Ans:
NOte: by using excel formula the correlation value is not showing. So using another method to find
To calculate the correlation between citric acid content and pH, you can use Pearson's correlation coefficient formula. The formula is as follows:
r = (n * Σ(x * y) - Σx * Σy) / sqrt((n * Σx^2 - (Σx)^2) * (n * Σy^2 - (Σy)^2))
where: x = citric acid y = pH n = number of observations (in this case, n = 7) Σ means the sum of all values
Plugging in the values:
r = (7 * (0 + 0.09 * 3.5 + 0.23 * 3.22 + 0.76 * 2.95 + 0.36 * 3 + 0.37 * 3.18 + 0.04 * 3.36) - (0 + 0.09 + 0.23 + 0.76 + 0.36 + 0.37 + 0.04) * (3.51 + 3.5 + 3.22 + 2.95 + 3 + 3.18 + 3.36)) / sqrt((7 * (0^2 + 0.09^2 + 0.23^2 + 0.76^2 + 0.36^2 + 0.37^2 + 0.04^2) - (0 + 0.09 + 0.23 + 0.76 + 0.36 + 0.37 + 0.04)^2) * (7 * (3.51^2 + 3.5^2 + 3.22^2 + 2.95^2 + 3^2 + 3.18^2 + 3.36^2) - (3.51 + 3.5 + 3.22 + 2.95 + 3 + 3.18 + 3.36)^2))
After performing the calculations, the value of r is approximately -0.038, which indicates a weak negative correlation between citric acid content and pH. This means that as the citric acid content increases, the pH value decreases slightly, but the relationship is not strong.
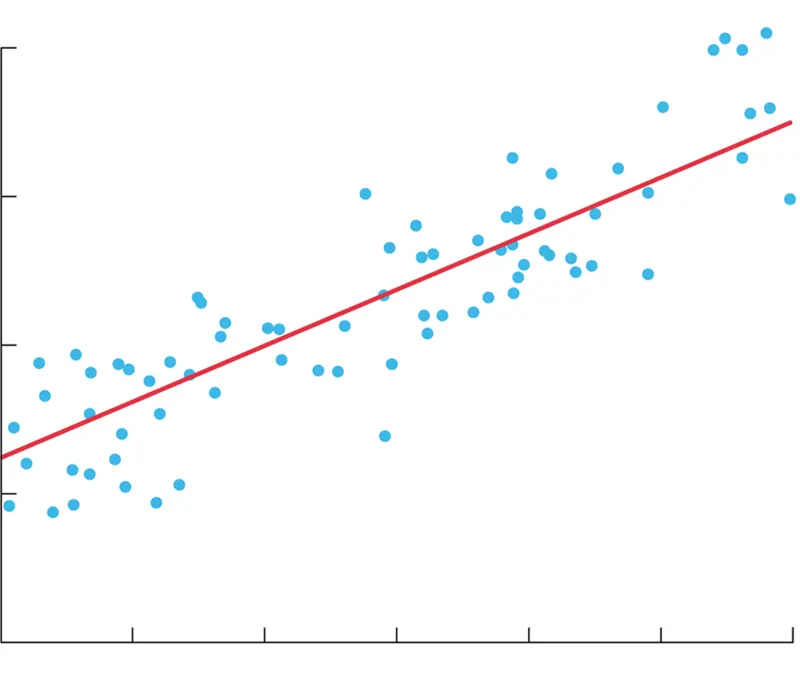
12.Find regression of PH on citric acid
Ans:
13.Find how many variables are independent.
Ans:
So, in this data set, the number of independent variables would be 11 (fixed acidity, volatile acidity, citric acid, residual sugar, chlorides, free sulfur dioxide, total sulfur dioxide, density, pH, sulphates, alcohol) as these variables can potentially influence or predict the outcome of the dependent variable "quality."
14.Create a new column as the acidity level. Divide the existing data into 5 groups based on the acidity level. The levels are to be named ['High', 'Moderately_High', 'Medium', 'Low']. Acidity may be obtained from the PH.
Ans:
|
pH |
Acidity level |
|
3.51 |
medium |
|
3.5 |
medium |
|
3.22 |
moderately high |
|
2.95 |
high |
|
3 |
moderately high |
|
3.18 |
moderately high |
|
3.36 |
moderately high |
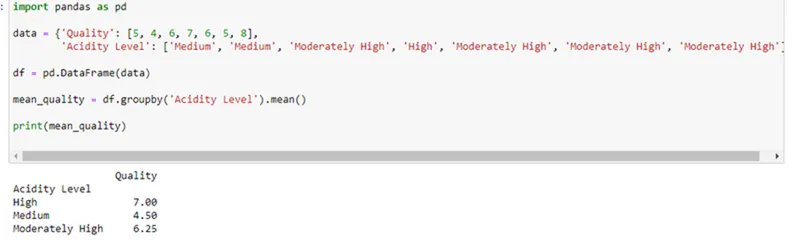
15.Find the mean quality of each acidity level with groupby. Use groupby
Ans:
16.Is a certain type of wine (red or white) associated with higher quality?
Ans:
white wine is more quality than red wine
17.Select samples with alcohol content less than the median
Ans:
let's calculate thealcohol content less than median
9.4, 9.8, 10.3, 11.2, 8.8, 10.8, 12.1
The median alcohol content is 9.4.
18.Get the quality rating for the low alcohol and high alcohol groups.
Ans:
Low alcohol group:
7.4 0.7 0 1.9 0.076 11 34 0.9978 3.51 0.56 9.4 5
5.7 1.13 0.09 1.5 0.172 7 19 0.994 3.5 0.48 9.8 4
7 0.27 0.36 20.7 0.045 45 170 1.001 3 0.45 8.8 6
High alcohol group:
10.4 0.55 0.23 2.7 0.091 18 48 0.9994 3.22 0.64 10.3 6
15.6 0.685 0.76 3.7 0.1 6 43 1.0032 2.95 0.68 11.2 7
7.9 0.18 0.37 1.2 0.04 16 75 0.992 3.18 0.63 10.8 5
5.2 0.44 0.04 1.4 0.036 43 119 0.9894 3.36 0.33 12.1 8
For the low alcohol group quality ratings:
- 5, 4, 6, and 6 are the quality ratings,
- And the mean quality rating is 5.25
For the high alcohol group quality ratings:
- 6, 7, 5, and 8 are the quality ratings,
- And the mean quality rating is 6.5
So, the mean quality rating for the low alcohol group is 5.25 and for the high alcohol group is 6.5.
19.Do sweeter wines get more ratings?
Ans:
The relationship between the residual sugar content and the quality rating of wine is not necessarily straightforward, as there are many factors that can affect the overall quality and taste of a wine. Some people may prefer sweeter wines and rate them higher, while others may prefer drier wines and rate them higher. The residual sugar content is just one of many factors that can contribute to the taste and quality of a wine.
20.Get the number of counts based on ratings and color of wine.
Ans:
To get the number of counts based on ratings and color of wine, we can create a table that groups the data by "color" and "quality" columns. The counts of each group can then be calculated.
For the red wine data:
|
Quality |
Count |
|
4 |
1 |
|
5 |
2 |
|
6 |
2 |
|
7 |
1 |
For the white wine data:
|
Quality |
Count |
|
5 |
1 |
|
6 |
2 |
|
8 |
1 |
This shows that there are 2 red wines with a quality rating of 5, 2 red wines with a quality rating of 6, 1 red wine with a quality rating of 7, 1 white wine with a quality rating of 5, 2 white wines with a quality rating of 6, and 1 white wine with a quality rating of 8.
21.Is the density of red wine and white wine similar?
Ans:
No, the density of red wine and white wine is not similar. The density values of red wine range from 0.9978 to 1.0032, while the density values of white wine range from 0.9894 to 1.001. These values show that the density of red wine is generally higher compared to the density of white wine.