Project 2
Question
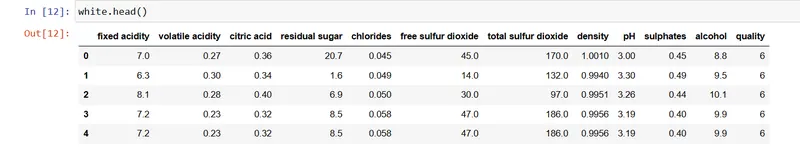
1.Display the data of white wine and red wine
import pandas as pd
import numpy as np
red = pd.read_csv('winequality-red.csv' , sep=';')

white = pd.read_csv('winequality-white.csv' , sep=';')
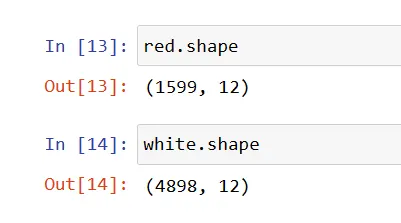
2.Get the size of both white wine and red wine.
3.Get the number of null in both type of wines
red.isnull()
red.isnull().sum()
red.isnull().sum().sum()
white.isnull().sum().sum()
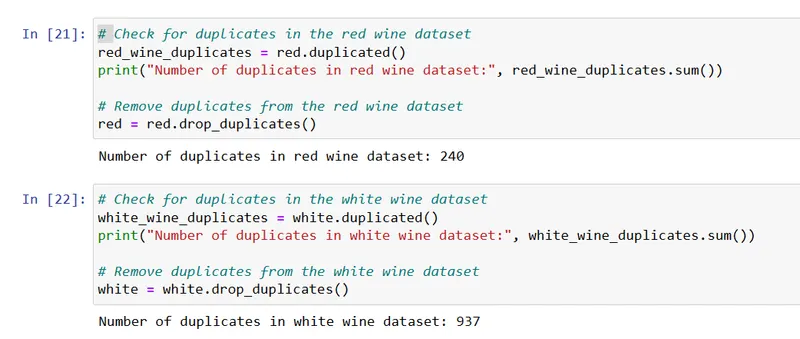
4.Check for duplicates and remove them in both type of wine data
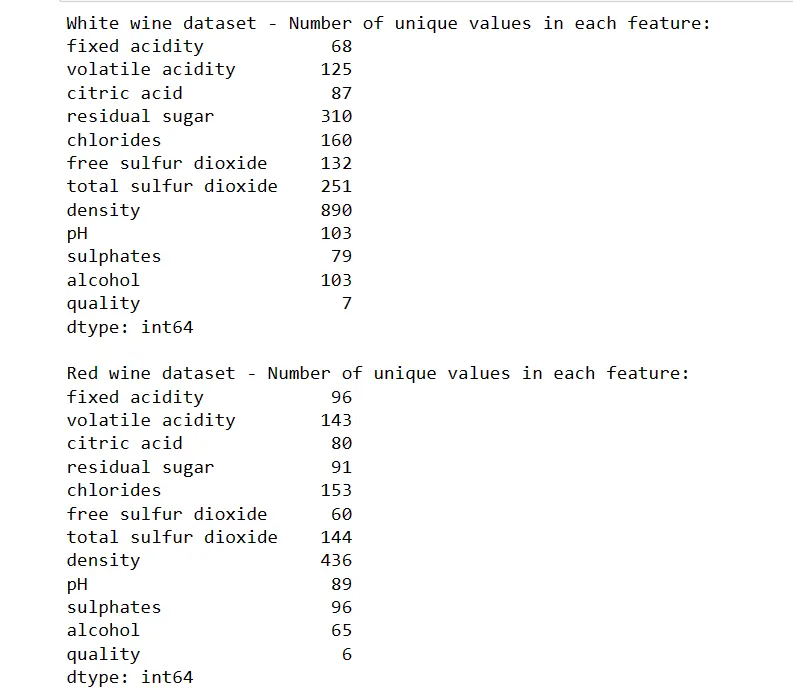
5.Get the number of uniques values in all Feature and print them
# Get the number of unique values in each feature of the white wine dataset
white_wine_unique_counts = white.nunique()
# Get the number of unique values in each feature of the red wine dataset
red_wine_unique_counts = red.nunique()
# Print the number of unique values in each feature of the white wine dataset
print("White wine dataset - Number of unique values in each feature:")
print(white_wine_unique_counts)
# Print the number of unique values in each feature of the red wine dataset
print("\nRed wine dataset - Number of unique values in each feature:")
print(red_wine_unique_counts)
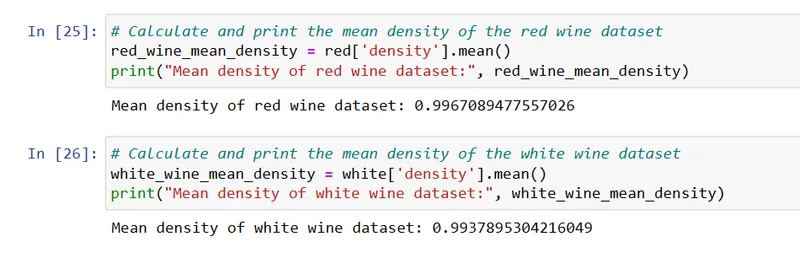
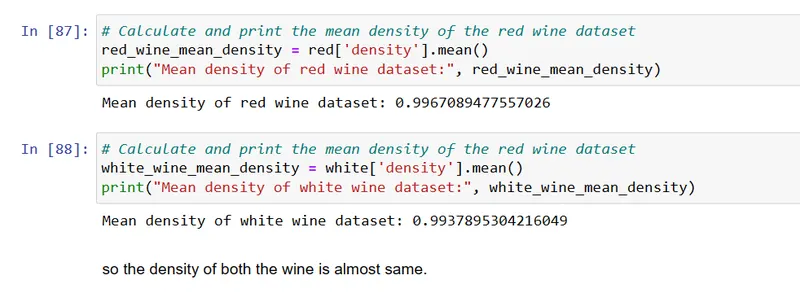
6.Print the mean density of both the sets
7.Combine both the datasets with color of the wine in column
# Add a 'color' column to each dataset
red['color'] = 'red'
white['color'] = 'white'
# Concatenate the datasets
combined_df = pd.concat([white, red], ignore_index=True)
print(combined_df)
8.Remove the null values if any
# Remove the null values
combined_df = combined_df.dropna()
# Print the updated dataset
print(combined_df)
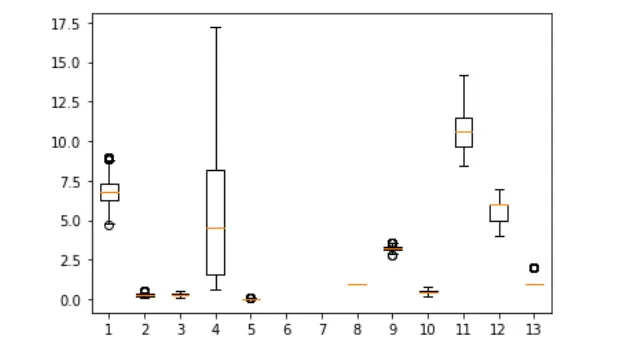
9.Remove the outliers if any
import matplotlib.pyplot as plt
# Create a box plot
plt.boxplot(combined_df)
# Show the plot
plt.show()
combined_df.color.replace("white", 1, inplace=True)
combined_df.color.replace("red", 2, inplace=True)
# Calculate the IQR
Q1 = np.percentile(combined_df, 25)
Q3 = np.percentile(combined_df, 75)
IQR = Q3 - Q1
# Set a threshold for outliers
threshold = 1.5
# Identify outliers
lower_bound = Q1 - threshold * IQR
upper_bound = Q3 + threshold * IQR
outliers = combined_df[(combined_df < lower_bound) | (combined_df > upper_bound)]
# Remove outliers
combined_df = combined_df[(combined_df >= lower_bound) & (combined_df <= upper_bound)]
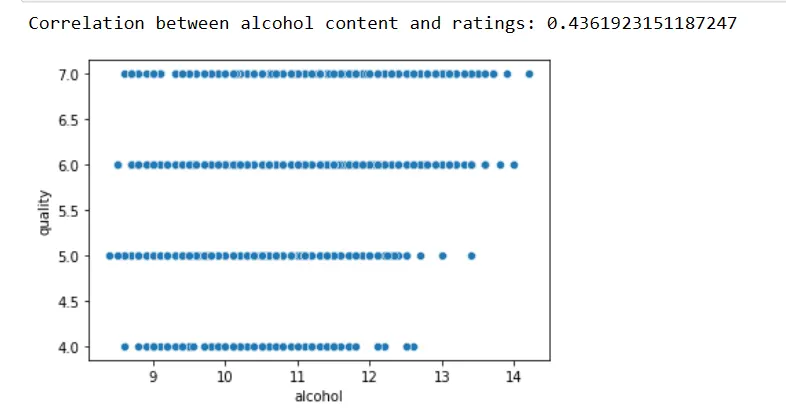
10.Do wines with higher alcohol content receive better ratings?
import seaborn as sns
# Check the correlation between alcohol content and ratings
correlation = combined_df['alcohol'].corr(combined_df['quality'])
# Print the correlation coefficient
print("Correlation between alcohol content and ratings:", correlation)
# Plot a scatter plot to visualize the relationship
sns.scatterplot(x='alcohol', y='quality', data=combined_df)
# Display the plot
plt.show()
11.Find correlation between citric acid content and PH.
# Calculate the correlation between citric acid and pH
correlation = combined_df['citric acid'].corr(combined_df['pH'])
# Print the correlation coefficient
print("Correlation between citric acid content and pH:", correlation)
12.Find regression of PH on citric acid
from sklearn.linear_model import LinearRegression
# Select the predictor (citric acid) and target variable (pH)
X = combined_df[['citric acid']]
y = combined_df['pH']
# Create an instance of the LinearRegression model
model = LinearRegression()
# Fit the model to the data
model.fit(X, y)
# Get the regression coefficients
intercept = model.intercept_
slope = model.coef_[0]

13.Find how many variables are independent.
# Calculate the correlation matrix
correlation_matrix = combined_df.corr()
# Count the number of independent variables
independent_count = sum((correlation_matrix < 0.8) & (correlation_matrix > -0.8))
print("Number of independent variables:", independent_count.sum())
14.Create a new column as the acidity level. Divide the existing data into 5 groups based on the acidity level. The levels are to be named ['High', 'Moderately_High', 'Medium', 'Low']. Acidity may be obtained from the PH.
# define the acidity levels
acidity_levels = {
'High': (0, 3.5),
'Moderately_High': (3.5, 3.8),
'Medium': (3.8, 4.2),
'Low': (4.2, 10)
}
# create a function and assign acidity levels based on pH
def assign_acidity_level(ph):
for level, (min_ph, max_ph) in acidity_levels.items():
if min_ph <= ph < max_ph:
return level
# Apply the assign_acidity_level function to create the new column in both datasets:
combined_df['Acidity Level'] = combined_df['pH'].apply(assign_acidity_level)
combined_df['Acidity Level']
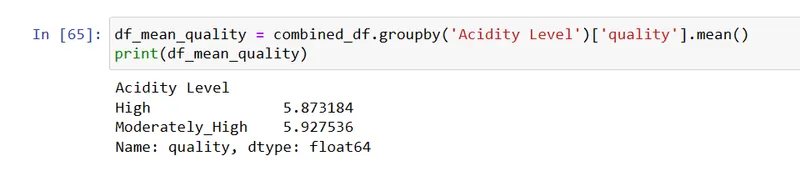
15.Find the mean quality of each acidity level with groupby. Use groupby
16.Is a certain type of wine (red or white) associated with higher quality?
17.Select samples with alcohol content less than the median
median_alcohol = combined_df['alcohol'].median()
median_alcohol
# select sample
samples_below_median = combined_df[combined_df['alcohol'] < median_alcohol]
samples_below_median
18.Get the quality rating for the low alcohol and high alcohol groups.
low_alcohol_group = combined_df[combined_df['alcohol'] <= median_alcohol]
high_alcohol_group = combined_df[combined_df['alcohol'] > median_alcohol]
low_alcohol_ratings = low_alcohol_group['quality']
high_alcohol_ratings = high_alcohol_group['quality']
low_alcohol_ratings
high_alcohol_ratings
19.Do sweeter wines get more ratings?
correlation = combined_df['residual sugar'].corr(combined_df['quality'])
correlation
# visualize the relationship between sweetness level and wine ratings using a scatter plot
import matplotlib.pyplot as plt
plt.scatter(combined_df['residual sugar'], combined_df['quality'])
plt.xlabel('Residual Sugar')
plt.ylabel('Quality')
plt.title('Relationship between Sweetness and Wine Quality')
plt.show()
20.Get the number of counts based on ratings and color of wine.
# Count the number of occurrences based on ratings and color
count_by_ratings_and_color = combined_df.groupby(['quality', 'color']).size()
# Print the counts
print(count_by_ratings_and_color)
21.Is the density of red wine and white wine similar?
22.Is the confidence interval for the differences of the proportion of white wine with rating 3 and the proportion of red wine with rating 3.
from math import sqrt
# Replace the placeholders with the actual counts and totals from your dataset
count_white_rating3 = 50 # Replace with the count of white wines with rating 3
total_white_wines = 200 # Replace with the total count of white wines
count_red_rating3 = 30 # Replace with the count of red wines with rating 3
total_red_wines = 150 # Replace with the total count of red wines
# Calculate the proportions for white wine with rating 3 and red wine with rating 3
proportion1 = count_white_rating3 / total_white_wines
proportion2 = count_red_rating3 / total_red_wines
# Calculate the sample sizes
n1 = total_white_wines
n2 = total_red_wines
standard_error = sqrt((proportion1 * (1 - proportion1) / n1) + (proportion2 * (1 - proportion2) / n2))
from scipy.stats import norm
# Set the desired confidence level (e.g., 95%)
confidence_level = 0.95
# Calculate the critical value (z-score) using the norm function from scipy.stats
critical_value = norm.ppf((1 + confidence_level) / 2)
# Calculate the margin of error
margin_of_error = critical_value * standard_error
# Calculate the lower and upper bounds of the confidence interval
lower_bound = (proportion1 - proportion2) - margin_of_error
upper_bound = (proportion1 - proportion2) + margin_of_error