Project 1 - Parsing NASA thermodynamic data
AIM :
To write a code in Matlab to parse the NASA thermodynamics data file and then calculated the thermodynamic properties of various gas species.
OBJECTIVE :
1. Write a function that extracts the 14 coefficients and calculates the enthalpy, entropy and specific heats for all the species in the data file.
2. Calculate the molecular weight of each species and display it in the command window.
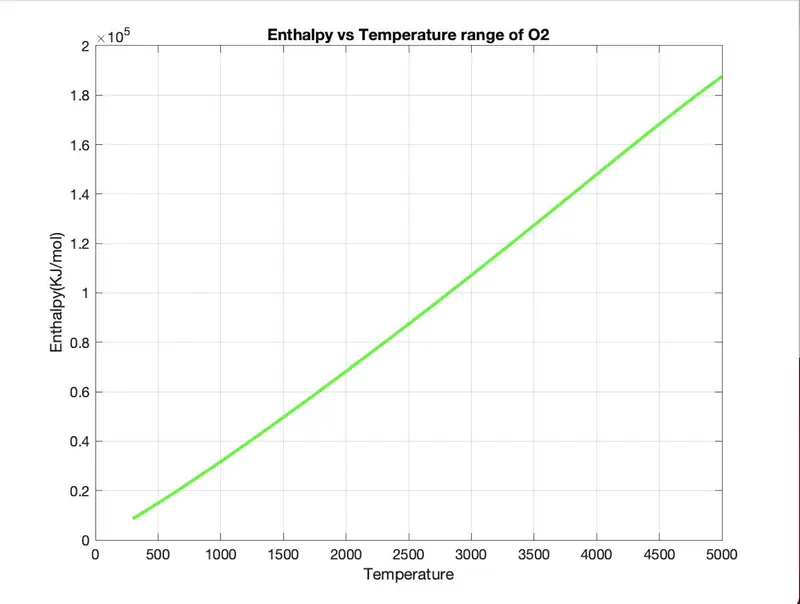
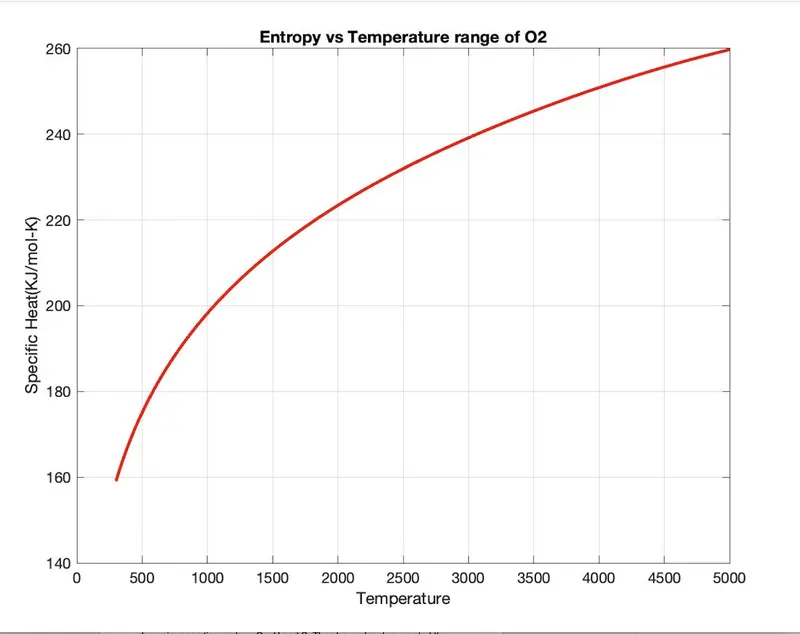
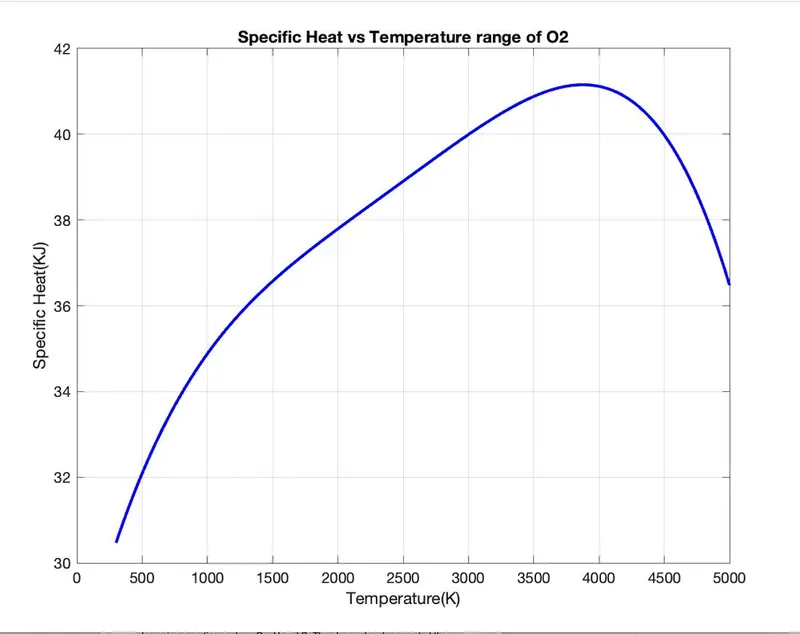
3. Plot the Cp, Enthalpy and Entropy for the local temperature range (low temperature : high temperature) specific for each species.
4. Save the plots as images with appropriate names and dump them in separate folders for each species with suitable name. All these should be generated automatically.
5.The main program that you will submit will just take the “THERMO.dat” file as an input and generate Cp,H and S plots.
6.Screenshot of the window where all folders are saved.
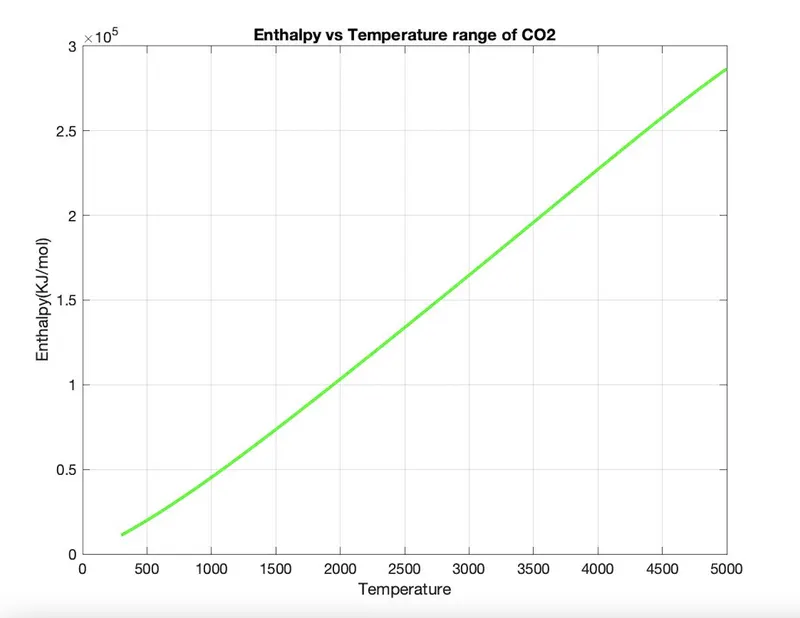
7.Plots for O2,N2 and Co2 species
FILE PARCING :
Different organisations comes up with polynomials, that can be used to evaluate different properties for different environments for Ex.In case of thermodynamics such as CP, H and S. They also create a document file for the coefficients that are required to evaluate these polynomials, for n no. of species
So, file parsing is method that helps us in decoding that data or in other words helps reading that data and use it in calculation of several parameters that defines the state that environment. and analyse behaviour of different species changing with some varying inputs.
To do file parsing first we need to check whether the data is broken down into meaningful bits or not. If not then we should first break it down the standard form so that reading for each species becomes similar.
NASA THERMODYNAMICS DATA :
NASA came up with polynomials that can be used to evaluate thermodynamic properties such as Cp, H and S. They have also documented the coefficients that are required to evaluate these polynomials for 1000+ species.
Using find parsing we need to write the function that extracts the 14 coefficients by reading data file and calculate the enthalpy(H), entropy(S) and specific heat (Cp) for all the species.We can also make plots for better understanding and the behaviour of gas w.r.t to temperature.
Formula :

Where,
R = universal gas constant
T = temperature
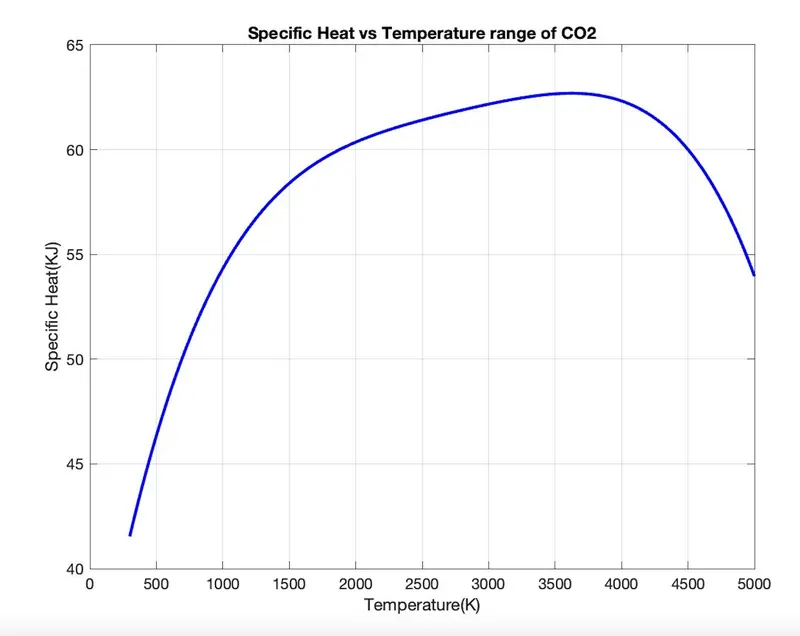
Cp = specific heat(KJ)
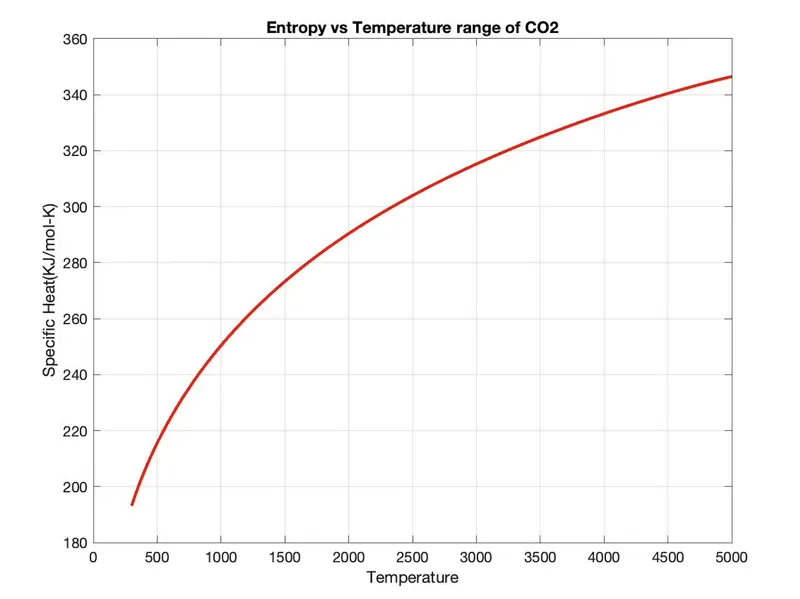
S = entropy (KJ/mol-K)
H = enthalpy (KJ/mol)
a(i) = coefficients where, i = 1 to 14
- Write a function that extracts the 14 coefficients and calculates the enthalpy, entropy and specific heats for all the species in the data file
Specific Heat :
The specific heat is the amount of heat unit mass required to raise the temperature by 1° celsius. The relationship between heat and temperature change it is usually expressed in the form shown below where C is the specific heat
Cp = R*(a1+(a2*T)+(a3*(T).^2)+(a4*(T).^3)+(a5*(T).^4))
Function for specific heat
function [Cp]=specific_heat(a1,a2,a3,a4,a5,a8,a9,a10,a11,a12,T,R,tempmid)
%calculating specific heat
%calculating specific heat for higher & lower temperature respectively
if (T<=tempmid)
Cp = R*(a8+(a9*T)+(a10*(T).^2)+(a11*(T).^3)+(a12*(T).^4));
else
Cp = R*(a1+(a2*T)+(a3*(T).^2)+(a4*(T).^3)+(a5*(T).^4));
end
end
Entropy :
Entropy, the measure of system’s thermal energy per unit temperature that is unavailable for doing useful work. Because work is obtained from ordered molecular motion, the amount of entropy is also a measure of the molecular disorder, or randomness of system.
S = R*(a1.*log(T)+(a2*T)+((a3*(T).^2)/2)+((a4*(T).^3)/3)+((a5*(T).^4)/4)+a7)
Function for Entropy
function [S]=Entropy(a1,a2,a3,a4,a5,a8,a9,a10,a11,a12,T,R,tempmid)
%calculating Entropy
%calculating Entropy for higher & lower temperature respectively
if (T<=tempmid)
S = R*(a8*log(T)+(a9*T)+((a10*(T).^2)/2)+((a11*(T).^3)/3)+((a12*(T).^4)/4));
else
S = R*(a1*log(T)+(a2*T)+((a3*(T).^2)/2)+((a4*(T).^3)/3)+((a5*(T).^4)/4));
end
end
Enthalpy :
Enthalpy, a property of thermodynamic systems equal to the system’s internal energy plus the product of its pressure and volume.IN a system contained so as to prevent mass transferor processes at constant pressure, the heat absorbed or released equals the change in enthalpy.
H = R*T.*((a1+(a2*T)/2)+((a3*(T).^2)/3)+((a4*(T).^3)/4)+((a5*(T).^4)/5)+((a6./T)))
Function for Enthalpy
function [H]=Enthalpy(a1,a2,a3,a4,a5,a8,a9,a10,a11,a12,T,R,tempmid)
%calculating Enthalpy
%calculating Enthalpy for higher & lower temperature respectively
if (T<=tempmid)
H = R*T.*((a8+(a9*T)/2)+((a10*(T).^2)/3)+((a11*(T).^3)/4)+((a12*(T).^4)/5));
else
H = R*T.*((a1+(a2*T)/2)+((a3*(T).^2)/3)+((a4*(T).^3)/4)+((a5*(T).^4)/5));
end
end
- Calculate the molecular weight of each species and display it in the command window.
Function for molecular weight
function W= Molecular_weight(species)
atomic_name = ['H','C','O','N','Ar'];
atomic_weight = [1.008 12.011 15.999 14.007 39.948];
W = 0;
for i = 1:length(species)
for j = 1:length(atomic_name)
if strcmp(species(i),atomic_name(j))
W = W + atomic_weight(j)
position = j
end
end
n = str2num(species)
if n>1
W = W + atomic_weight(position)*(n-1)
end
end
fprintf('molecular Weight of %S :-',species)
fprintf('%f',W)
disp(' ')
end
Result -
molecular weight of O :- 15.999000
molecular weight of O2 :- 15.999000
molecular weight of H :- 1.008000
molecular weight of H2 :- 1.008000
molecular weight of OH :- 17.007000
molecular weight of H2O :- 17.007000
molecular weight of HO2 :- 17.007000
molecular weight of H2O2 :- 17.007000
molecular weight of C :- 12.011000
molecular weight of CH :- 13.019000
molecular weight of CH2 :- 13.019000
molecular weight of CH2(S) :- 13.019000
molecular weight of CH3 :- 13.019000
molecular weight of CH4 :- 13.019000
molecular weight of CO :- 28.010000
molecular weight of CO2 :- 28.010000
molecular weight of HCO :- 29.018000
molecular weight of CH2O :- 29.018000
molecular weight of CH2OH :- 30.026000
molecular weight of CH3O :- 29.018000
molecular weight of CH3OH :- 30.026000
molecular weight of C2H :- 13.019000
molecular weight of C2H2 :- 13.019000
molecular weight of C2H3 :- 13.019000
molecular weight of C2H4 :- 13.019000
molecular weight of C2H5 :- 13.019000
molecular weight of C2H6 :- 13.019000
molecular weight of CH2CO :- 41.029000
molecular weight of HCCO :- 41.029000
molecular weight of HCCOH :- 42.037000
molecular weight of H2CN :- 27.026000
molecular weight of HCN :- 27.026000
molecular weight of HNO :- 31.014000
molecular weight of N :- 14.007000
molecular weight of NNH :- 29.022000
molecular weight of N2O :- 30.006000
molecular weight of NH :- 15.015000
molecular weight of NH2 :- 15.015000
molecular weight of NH3 :- 15.015000
molecular weight of NO :- 30.006000
molecular weight of NO2 :- 30.006000
molecular weight of HCNO :- 43.025000
molecular weight of HOCN :- 43.025000
molecular weight of HNCO :- 43.025000
molecular weight of NCO :- 42.017000
molecular weight of CN :- 26.018000
molecular weight of HCNN :- 41.033000
molecular weight of N2 :- 14.007000
molecular weight of AR :- 39.948000
molecular weight of C3H8 :- 13.019000
molecular weight of C3H7 :- 13.019000
molecular weight of CH3CHO :- 42.037000
molecular weight of CH2CHO :- 42.037000
- The main program that you will submit will just take the “THERMO.dat” file as an input and generate Cp,H and S plots
Main code -
clear all
close all
clc
cd('/Users/kiran/Desktop/File parcing')
% Reading data file
% Open file and reading THERMO.dat file
f1 = fopen('THERMO.dat','r')
get = fgetl(f1);
R = 8.314
% Now reading temperature from this file
temp = fgetl(f1);
%Spliting
s = strsplit(temp);
%converting strings cells into numbers
templow = str2num(s{2});
tempmid = str2num(s{3});
temphigh = str2num(s{4});
% Temperature Range
T = linspace(templow,temphigh,1000);
%skipping comment lines
for i = 1:3
get=fgetl(f1);
end
% Reading the species
for j = 1:53
tline = fgetl(f1);
A = strsplit(tline,' ');
species = (A{1});
%converting string to number
lowtemp = str2num(A{end-3});
midtemp = str2num(A{end-2});
hightemp = str2num(A{end-1});
% Getting next line
tline1 = fgetl(f1);
a = strfind(tline1,'E');
%finding first 7 higher and second 7 lower coefficients
%finding higher coefficients
a1 = tline1(1:a(1)+3);
a1 = str2num(a1);
a2 = tline1(a(1)+4:a(2)+3);
a2 = str2num(a2);
a3 = tline1(a(2)+4:a(3)+3);
a3 = str2num(a3);
a4 = tline1(a(3)+4:a(4)+3);
a4 = str2num(a4);
a5 = tline1(a(4)+4:a(5)+3);
a5 = str2num(a5);
tline2 = fgetl(f1);
b = strfind(tline2,'E');
a6 = tline2(1:b(1)+3);
a6 = str2num(a6);
a7 = tline2(b(1)+4:b(2)+3);
a7 = str2num(a7);
%finding lower coefficients
a8 = tline2(b(2)+4:b(3)+3);
a8 = str2num(a8);
a9 = tline2(b(3)+4:b(4)+3);
a9 = str2num(a9);
a10 = tline2(b(4)+4:b(5)+3);
a10 = str2num(a10);
tline3 = fgetl(f1);
c = strfind(tline3,'E');
a11 = tline3(1:c(1)+3);
a11 = str2num(a11);
a12 = tline3(c(1)+4:c(2)+3);
a12 = str2num(a12);
a13 = tline3(c(2)+4:c(3)+3);
a13 = str2num(a13);
a14 = tline3(c(3)+4:c(4)+3);
a14 = str2num(a14);
%calculate Specific heat
Cp = specific_heat(a1,a2,a3,a4,a5,a8,a9,a10,a11,a12,T,R,tempmid);
%calculate Entropy
S = Entropy(a1,a2,a3,a4,a5,a7,a8,a9,a10,a11,a12,a14,T,R,tempmid);
%calculate Enthalpy
H = Enthalpy(a1,a2,a3,a4,a5,a6,a8,a9,a10,a11,a12,a13,T,R,tempmid);
%calculate molecular weight of the species
W = Molecular_weight(species);
%writing molecular weight file
MW_file = fopen('Molecular Weight.txt','w');
fprintf(MW_file,'Molecular weight of %s is %d',species,W)
fclose(MW_file);
%plotting Cp,H and S with Temperature
%saving in a folder
mkdir(species)
cd(species)
%plot 1 Cp vs T
figure(1)
plot(T,Cp,'LineWidth',2,'Color','b')
xlabel('Temperature(K)');
ylabel('Specific Heat(KJ)');
title(sprintf('Specific Heat vs Temperature range of %s',species ))
grid on
saveas(figure(1),'specific Heat.jpg')%plot 1 Cp vs T
%plot 2 S vs T
figure(2)
plot(T,S,'LineWidth',2,'Color','r')
xlabel('Temperature');
ylabel('Specific Heat(KJ/mol-K)');
title(sprintf('Entropy vs Temperature range of %s',species))
grid on
saveas(figure(2),'Entropy.jpg')
%plot 3 H vs T
figure(3)
plot(T,H,'LineWidth',2,'Color','g')
xlabel('Temperature');
ylabel('Enthalpy(KJ/mol)');
title(sprintf('Enthalpy vs Temperature range of %s',species))
grid on
saveas(figure(3),'Enthalpy.jpg')
cd ..
%Molecular Weight
W = Molecular_weight(species)
end
- Plot the Cp, Enthalpy and Entropy for the local temperature range (low temperature : high temperature) specific for each species. Save the plots as images with appropriate names and dump them in separate folders for each species with suitable name. All these should be generated automatically. Screen shot of the window where all folders are saved.


- Output of molecular weight of the different species -
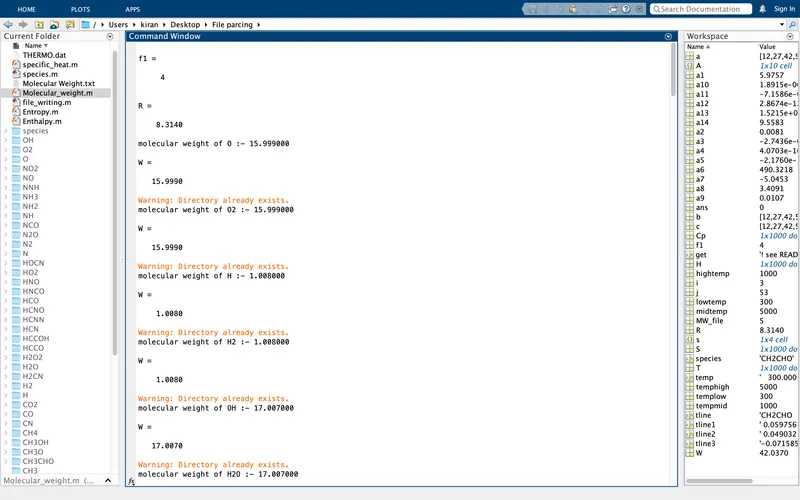
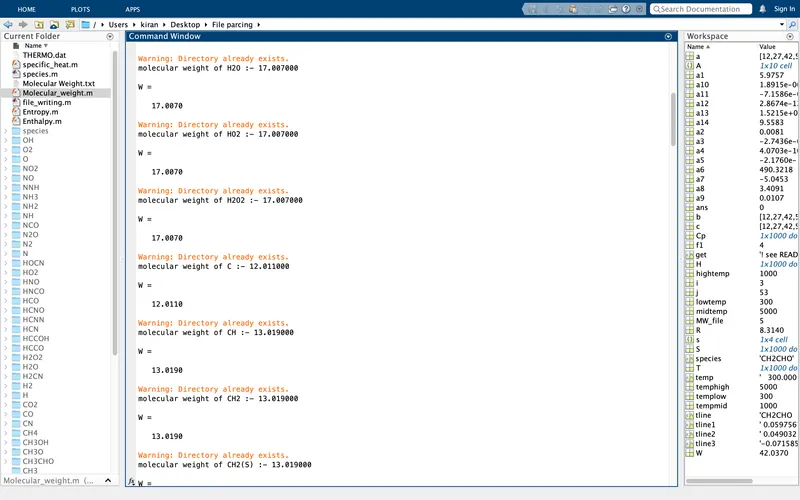
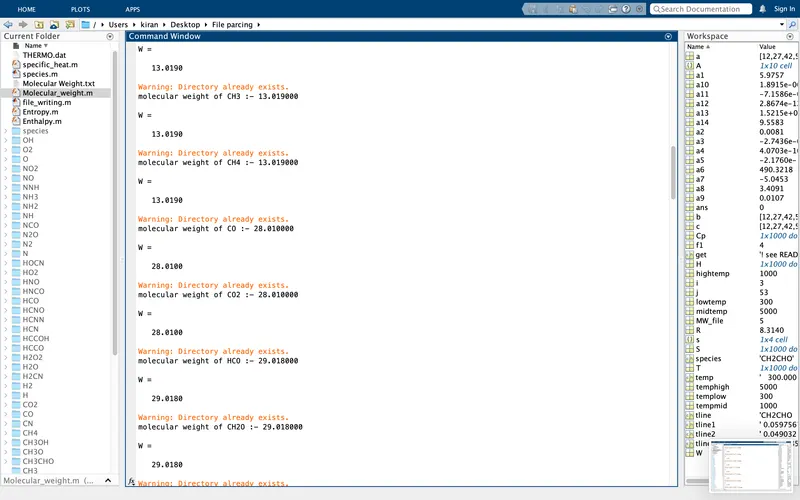
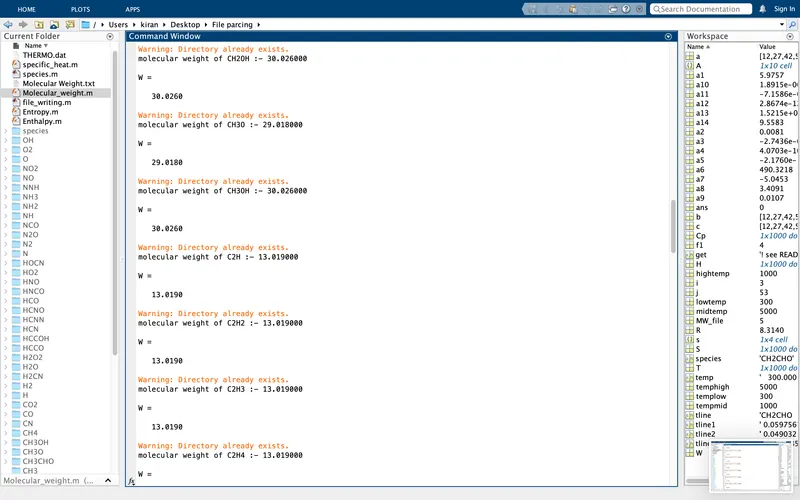
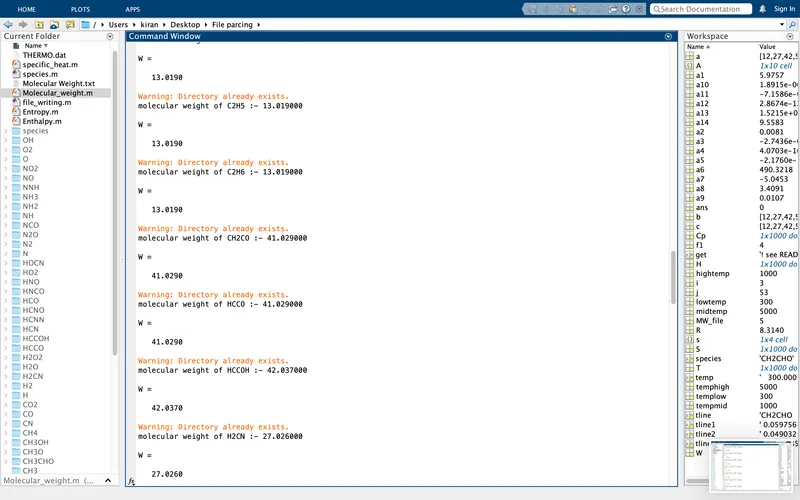
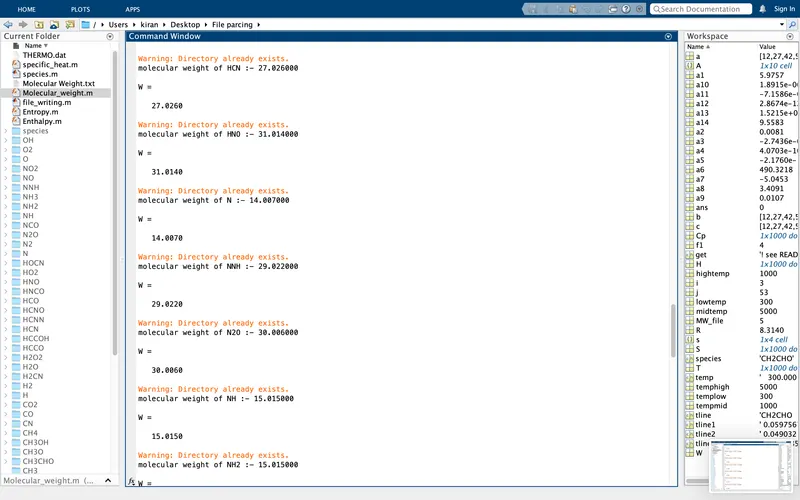
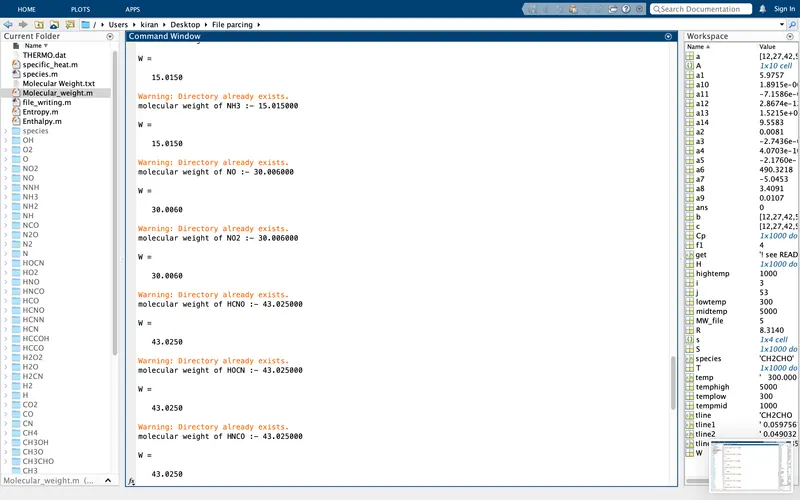
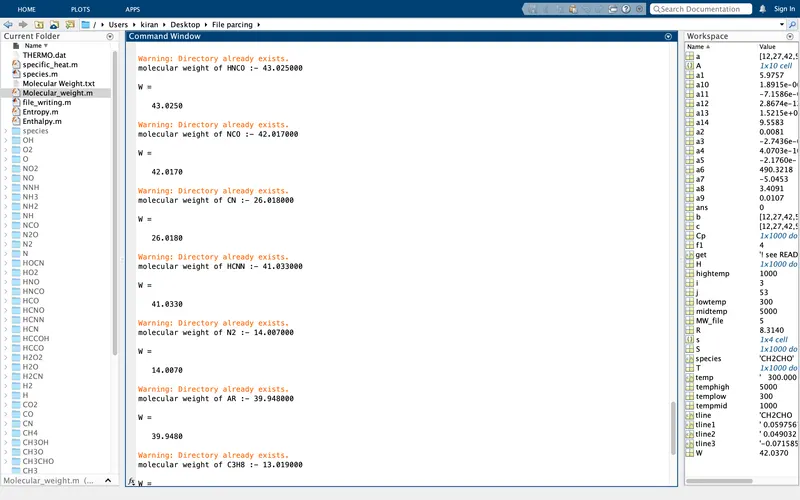
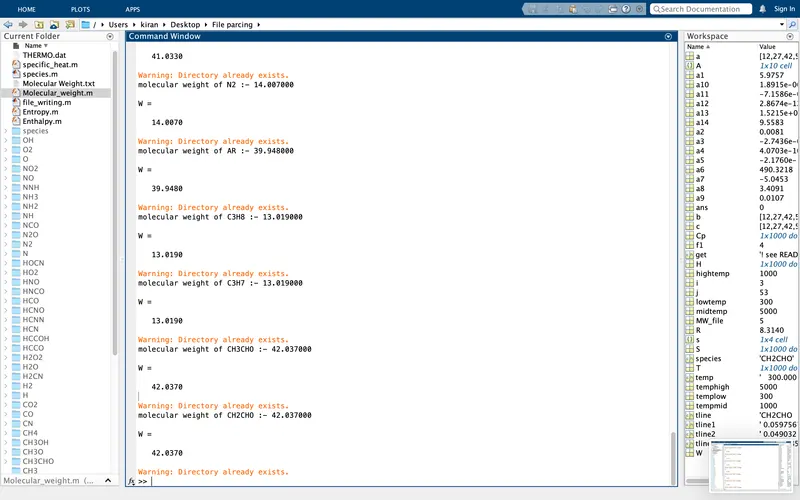
- Plots for O2,N2 and Co2 species
Plots for specie O2 -
Plots for specie N2 -
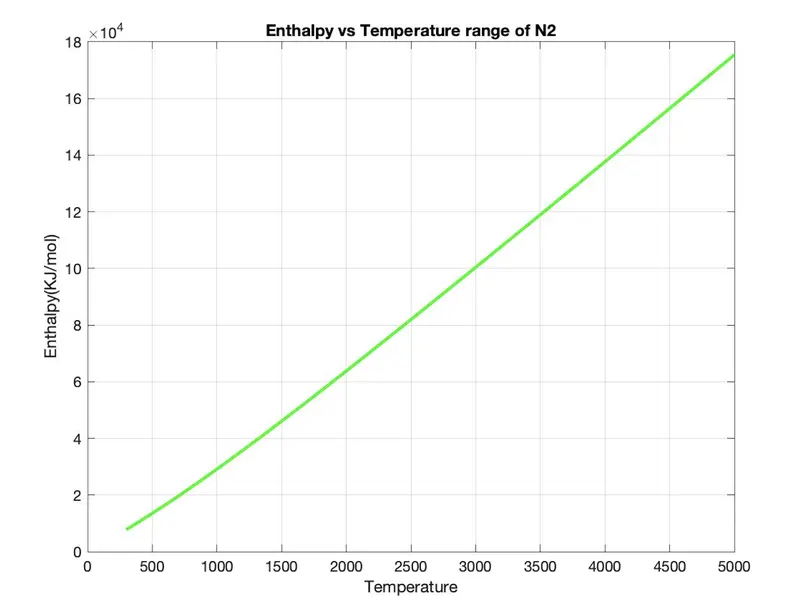
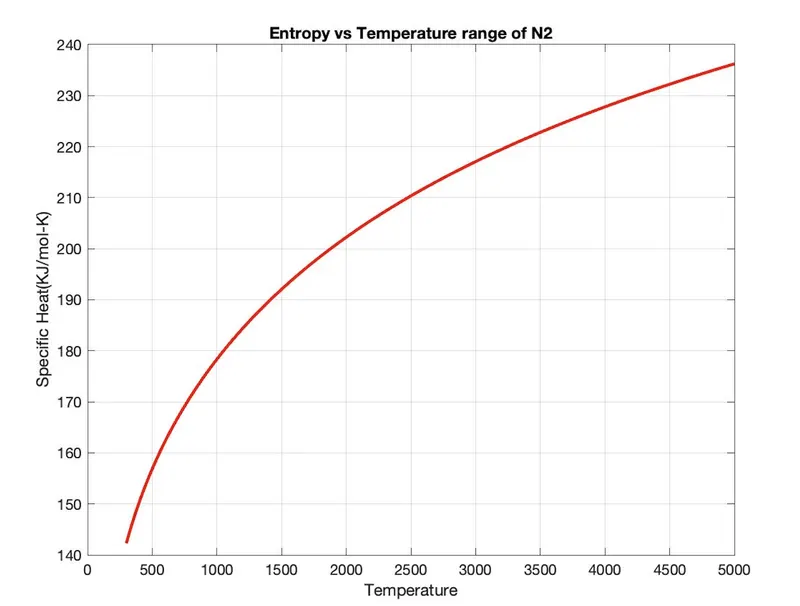
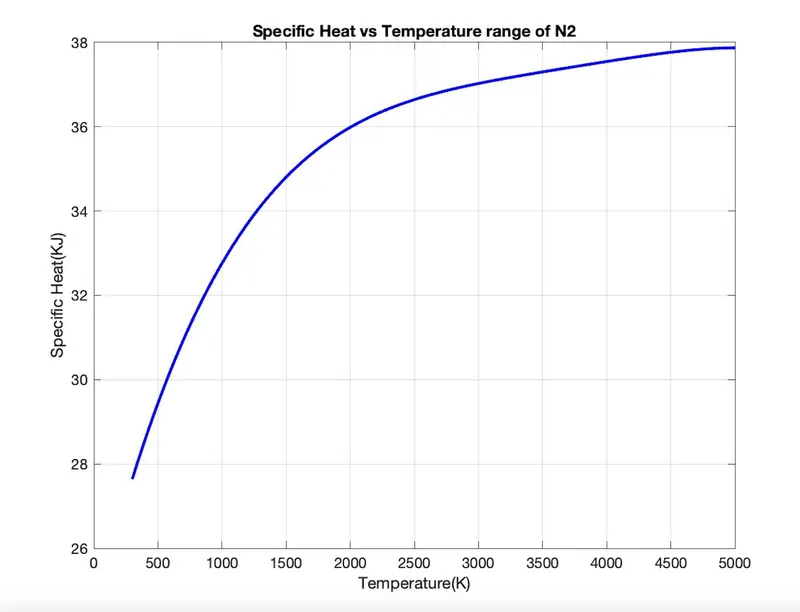
Plots for specie Co2 -
Errors Occured while programing -
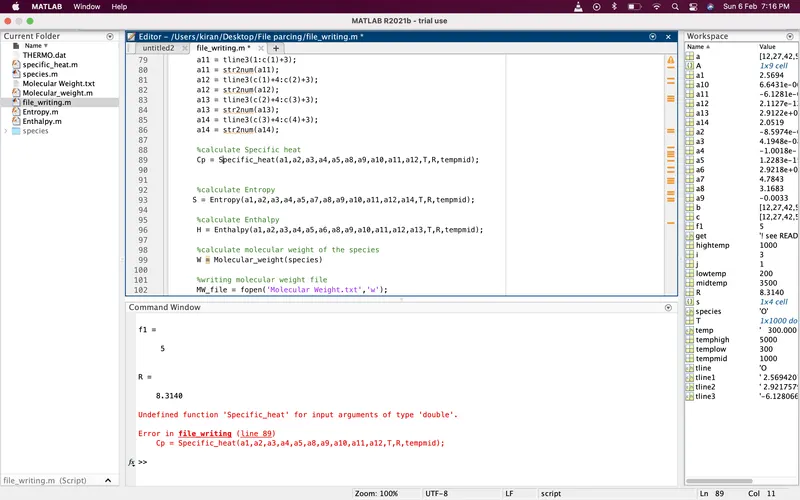
1.Error - Undefined function 'specific_heat' for input argument of type double
Solution - spelling of specific heat in function program and main program is not same.After doing correction program ran successfully.
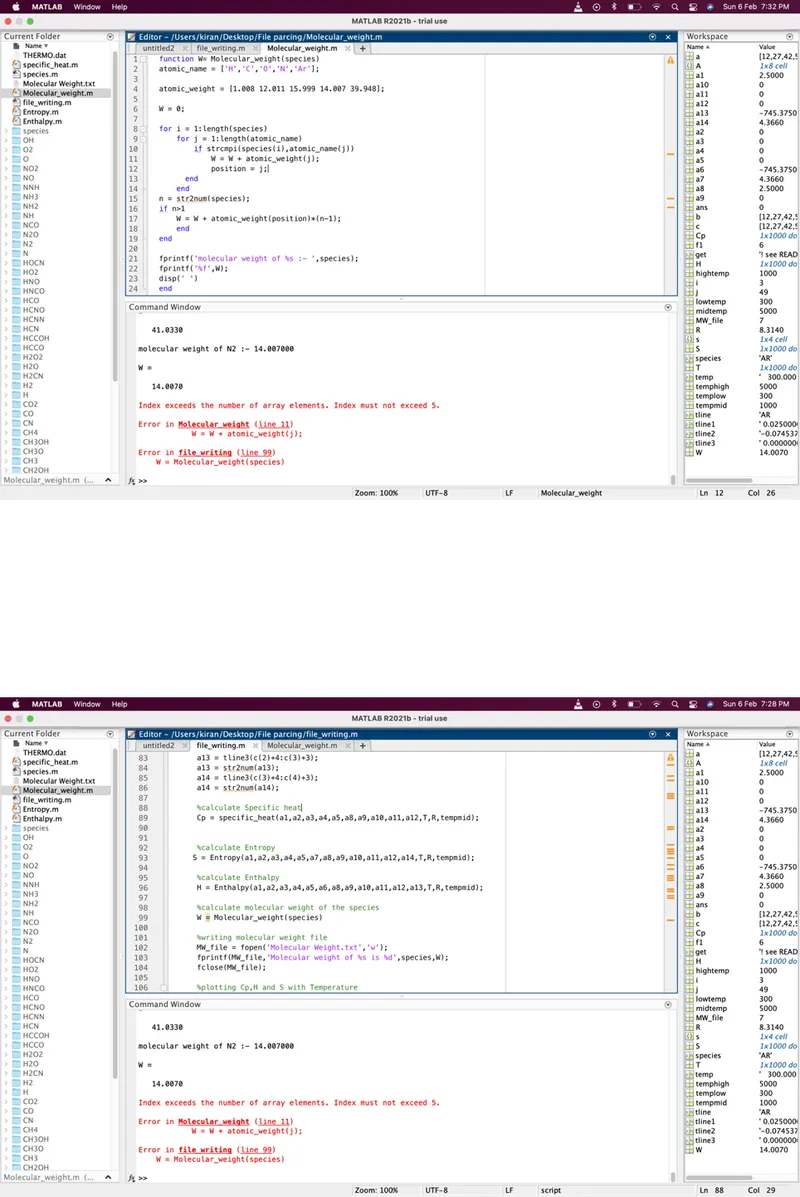
2. Index exceeds the number of array elements.Index must not exceed 5
Solution - There is Error in molecular weight function 'strcmpi'. I changed it into 'strcmp'.
Google Drive link -
https://drive.google.com/drive/folders/1PFFkWTabNp9mm55XzPrzz8w8LWgx1Nw_?usp=sharing
References -
https://in.mathworks.com/help/matlab/ref/mkdir.html
https://in.mathworks.com/help/matlab/ref/saveas.html