Project 1 - Parsing NASA thermodynamic data
Aim:- To write the matlab code to extract the NASA THERMO.dat file & obtain different species.
Objects:-
- Write a MATLAB code to reading NASA thermodynamic data file.
- Extract the co-efficients
- Calculate the molecular weight of each species and display in the command window.
- Save the plots as images with appropriate names and dump them in separate folders for each species with suitable name. All these should be generated automatically.
- Write the program that take the "THERMO.dat" file as an input and generate Cp, H and S plots.
File:-https://drive.google.com/file/d/14cYM7N3DFox-J6o2f0zEZG2KfclxsT5t/view?usp=sharing
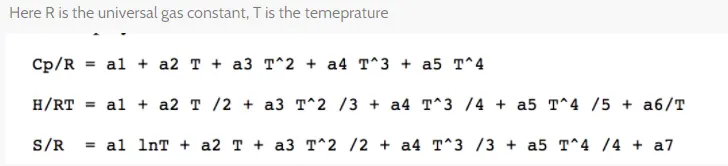
formulae use to calculate the Cp, H and S.
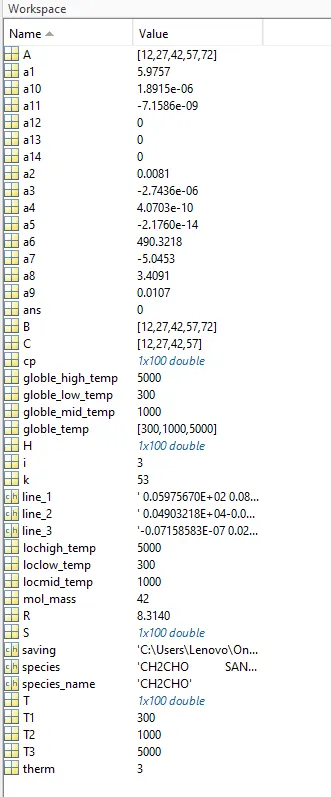
File Parsing:- FIle parsing in computer languages refers to syntactic analysis of the input data normally from a file into its components parts in order to facilitatenthe writing of complier and interpreters. it can be used to describe split or separation.
Parsing a file means reading in data stream of some sort and bulding an in memory model of the semantic content of that data. This aims at faciliating performing some kind of transformation on the data.
MATLAB Code
1. Main Program:-
close all
clear all
clc
%Reading data
therm = fopen('THERMO.dat')
fgetl(therm);
globle_temp = str2num(fgetl(therm));
globle_low_temp = globle_temp(1);
globle_mid_temp = globle_temp(2);
globle_high_temp = globle_temp(3);
%skip the lines
for i=1:3
fgetl(therm);
end
%reading the coefficients
for k=1:53
species = fgetl(therm)
species_name= species(1:6)
loclow_temp=str2double(species(52-3:52+3));
lochigh_temp=str2double(species(62-4:62+3));
locmid_temp=str2double(species(72-4:72+3));
T1=loclow_temp
T2=locmid_temp
T3=lochigh_temp
line_1=fgetl(therm);
A= strfind(line_1,'E')
a1=str2double(line_1(1:A(1)+3))
a2=str2double(line_1(A(1)+4:A(2)+3))
a3=str2double(line_1(A(2)+4:A(3)+3))
a4=str2double(line_1(A(3)+4:A(4)+3))
a5=str2double(line_1(A(4)+4:A(5)+3))
line_2= fgetl(therm)
B= strfind(line_2,'E')
a6= str2double(line_2(1:B(1)+3))
a7= str2double(line_2(B(1)+4:B(2)+3))
a8= str2double(line_2(B(2)+4:B(3)+3))
a9= str2double(line_2(B(3)+4:B(4)+3))
a10= str2double(line_2(B(4)+4:B(5)+3))
line_3= fgetl(therm);
C=strfind(line_3,'E')
a11= str2double(line_3(1:C(1)+3))
a12= str2double(line_3(1:C(1)+4:C(2)+3))
a13= str2double(line_3(1:C(2)+4:C(3)+3))
a14= str2double(line_3(1:C(3)+4:C(4)+3))
%creating folder with species name
mkdir(['C:\Users\Lenovo\OneDrive\Desktop\Matlab ass\File_Parsing',species_name])
T=linspace(T1,T3,100);
R=8.314;
[cp,H,S]=thermo_func(R,T,T1,T2,T3,a1,a2,a3,a4,a5,a6,a7,a8,a9,a10,a11,a12,a13,a14)
figure(1)
plot(T,cp,'linewidth',3,'color','r')
grid on
title(species_name)
xlabel('Temperature')
ylabel('Specific Heat')
figure(2)
plot(T,H,'linewidth',3,'color','g')
grid on
title(species_name)
xlabel('Temperature')
ylabel('Enthalpy')
figure(3)
plot(T,S,'linewidth',3,'color','b')
grid on
title(species_name)
xlabel('Temperature')
ylabel('Entropy')
%changing the directory
saving= (['C:\Users\Lenovo\OneDrive\Desktop\Matlab ass\File_Parsing', species_name])
cd(saving)
%saving the plots
saveas(1,'specific heat','jpg');
saveas(2,'Enthalpy','jpg');
saveas(3,'Entropy','jpg');
cd('C:\Users\Lenovo\OneDrive\Desktop\Matlab ass\File_Parsing')
mol_mass= molecular_weight(species_name);
end
fclose(therm)
2. Fuction for cp, H & S :-
%function for the thermo dynamic properties
%thermo_func(R,T,T1,T2,T3,a1,a2,a3,a4,a5,a6,a7,a8,a9,a10,a11,a12,a13,a14);
function[cp,H,S] = thermo_func(R,T,T1,T2,T3,a1,a2,a3,a4,a5,a6,a7,a8,a9,a10,a11,a12,a13,a14);
for i=1:length(T)
if T(i)>T2
cp=(a1+a2.*T+a3.*T.^2+a4.*T.^3+a5.*T.^4)*R;
H=(a1+(a2.*T)./2+(a3.*T.^2)/3+(a4.*T.^3)./4+(a5.*T.^4)./5+a6./T)*R.*T;
S=(a1.*log(T)+a2.*T+(a3.*T.^2)./2+(a3.*T.^3)./3+(a4.*T.^4)./+a7)*R;
else
cp=(a8+a9.*T+a9.*T.^2+a10.*T.^3+a11.*T.^4)*R;
H=(a8+(a9.*T)./2+(a10.*T.^2)/3+(a11.*T.^3)./4+(a12.*T.^4)./5+a13./T)*R.*T;
S=(a8.*log(T)+a9.*T+(a10.*T.^2)./2+(a11.*T.^3)./3+(a12.*T.^4)./+a14)*R;
end
end
end
3. Fuction for Molecular Weight :-
% Fuction for molecular mass
%mol_mass=molecular_weight(species_name)
function mol_mass= molecular_weight(species_name)
species = species_name;
elements = ['H','C','O','N','A']
atomic_weight= [1 12 16 14 40 32]
mol_mass=0
for i=1:length(species)
for j=1:length(elements)
if strcmp(species(i),elements(j))
mol_mass= mol_mass+atomic_weight(j);
a=j
end
end
end
n= str2double(species(i))
if n>1
mol_mass=mol_mass+elements(a)*(n-1)
end
end
Code Explaination:-
1. fopen command is to open the file.
2. fgetl command is use to read the lines from the file.
3. str2num &str2double is use to extract the globle & local temp range & split it to low, high & mid.
4. Write the code to extract the species name, use this to create the separate folders to store the plots of the respective species.
5. Write the code to neglect the three lines of the file, to do this for loop code is written.
6. For loop used to extract all 14 coefficient of each species.
7. co efficient arranged in a fixed order, finding that order and writing the program to extract them .location 'E' use to extract the cofficients.
8. strfind is used to find the position of the 'E'
9. Code to calculate the Cp, H and S by given formulae
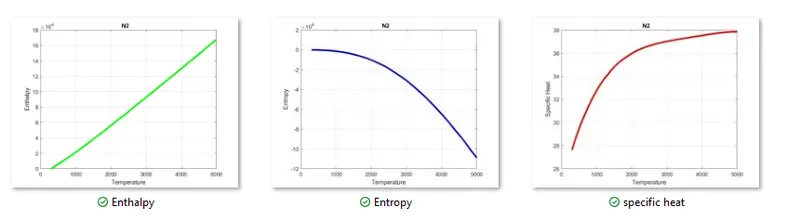
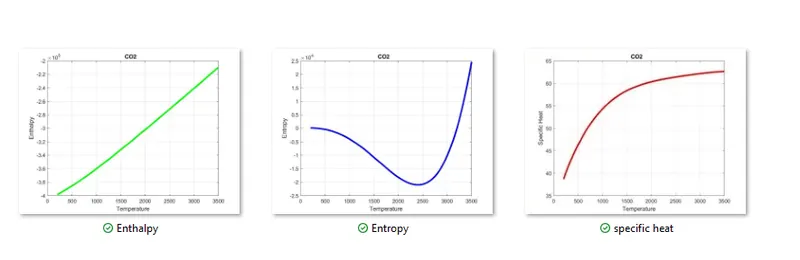
10. plot use to ploting the graph for specific heat vs temperature, Enthalpy vs temperature, Entropy vs temperature.
11. function create to calculate the molecular weight.
Results:-
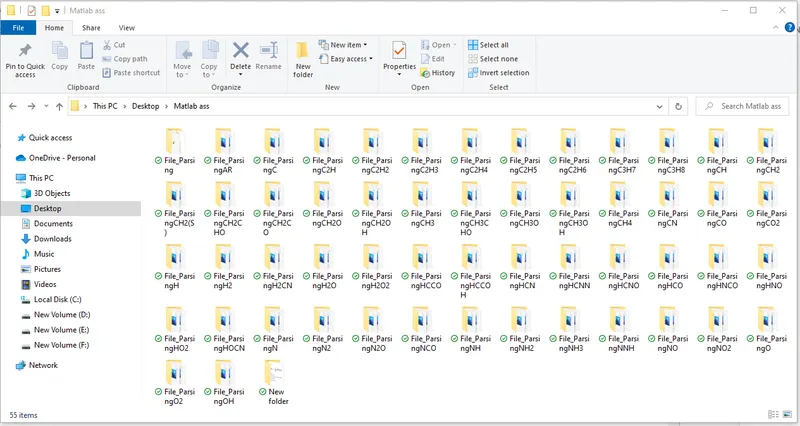
Screenshot of the window where all the folders are saved:-
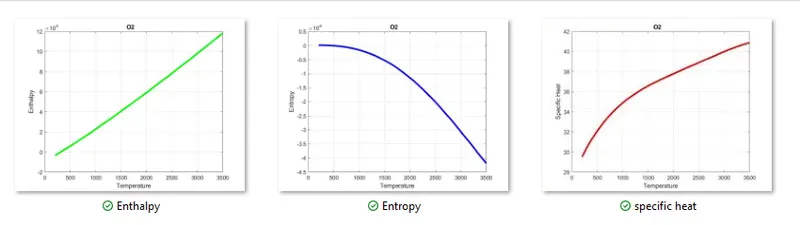
Plots:-
1. O2
2. N2
3. CO2
References:-
1. https://in.mathworks.com/