Project 1 - Parsing NASA thermodynamic data
clear all
close all
clc
% Gas constant
R = 8.314;
% Reading temperature values from file
f1 = fopen('THERMO.dat','r');
read = fgetl(f1);
read = fgetl(f1);
% splitting the string into 4 element cell
tempstring = strsplit(read,' ');
% converting string into number
low_temp = str2num(tempstring{2});
mid_temp = str2num(tempstring{3});
high_temp= str2num(tempstring{4});
t = linspace(low_temp,high_temp,1000);
% Skipping 3 lines
read = fgetl(f1);
read = fgetl(f1);
read = fgetl(f1);
% Reading temperature line and converting from string to number
for i = 1:53
tline= fgetl(f1);
x = strsplit(tline,' ');
species = (x{1});
templow = str2num(x{end-3});
tempmid = str2num(x{end-2});
temphigh = str2num(x{end-1});
% Reading the coefficients from file
t1 = fgetl(f1);
% Reading the coefficients as string and converting them to numbers
a = strfind(t1,'E');
a1 = t1(1:a(1)+3);
a1 = str2num(a1);
a2 = t1(a(1)+4:a(2)+3);
a2 = str2num(a2);
a3 = t1(a(2)+4:a(3)+3);
a3 = str2num(a3);
a4 = t1(a(3)+4:a(4)+3);
a4 = str2num(a4);
a5 = t1(a(4)+4:a(5)+3);
a5 = str2num(a5);
t2 = fgetl(f1);
b = strfind(t2,'E');
a6 = t2(1:b(1)+3);
a6 = str2num(a6);
a7 = t2(b(1)+4:b(2)+3);
a7 = str2num(a7);
a8 = t2(b(2)+4:b(3)+3);
a8 = str2num(a8);
a9 = t2(b(3)+4:b(4)+3);
a9 = str2num(a9);
a10 = t2(b(4)+4:b(5)+3);
a10= str2num(a10);
% Reading third line of coefficients
t3 = fgetl(f1);
c = strfind(t3,'E');
a11 = t3(1:c(1)+3);
a11 = str2num(a11);
a12= t3(c(1)+4:c(2)+3);
a12= str2num(a12);
a13 = t3(c(2)+4:c(3)+3);
a13= str2num(a13);
a14 = t3(c(3)+4:c(4)+3);
a14= str2num(a14);
% Calculation of Specific Heat
Cp = specific_heat(a1,a2,a3,a4,a5,a8,a9,a10,a11,a12,t,R,mid_temp);
% Calculation of Enthalpy
H = enthalpy(a1,a2,a3,a4,a5,a6,a8,a9,a10,a11,a12,a13,t,R,mid_temp);
% Calculation of Entropy
s = entropy(a1,a2,a3,a4,a5,a7,a8,a9,a10,a11,a12,a14,t,R,mid_temp);
% Calculatiion of molecular weight
w = molecular_weight(species);
mol_list = fopen('Molecular weight.txt','w');
fprintf(mol_list,'Molecualar weight of %s is %d ',species,w)
fclose(mol_list);
% Save in folder
cd('F:Matlab programsProject 1New project 1species');
mkdir(species);
cd(species);
% plot temperature vs specific heat
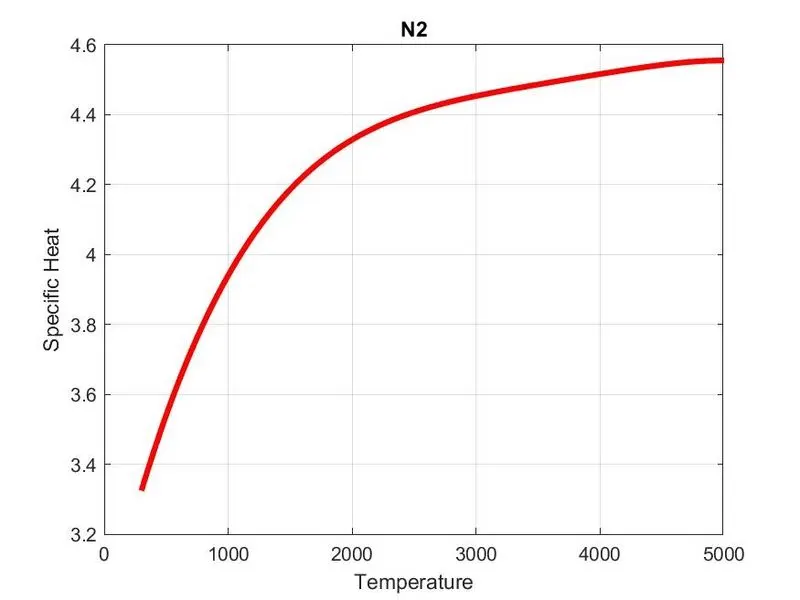
figure(1)
plot(t,Cp,'linewidth',3,'color','r');
title(species);
xlabel('Temperature');
ylabel('Specific Heat');
grid on
saveas(figure(1),'specific heat.jpg');
% plot Temperature vs Entropy
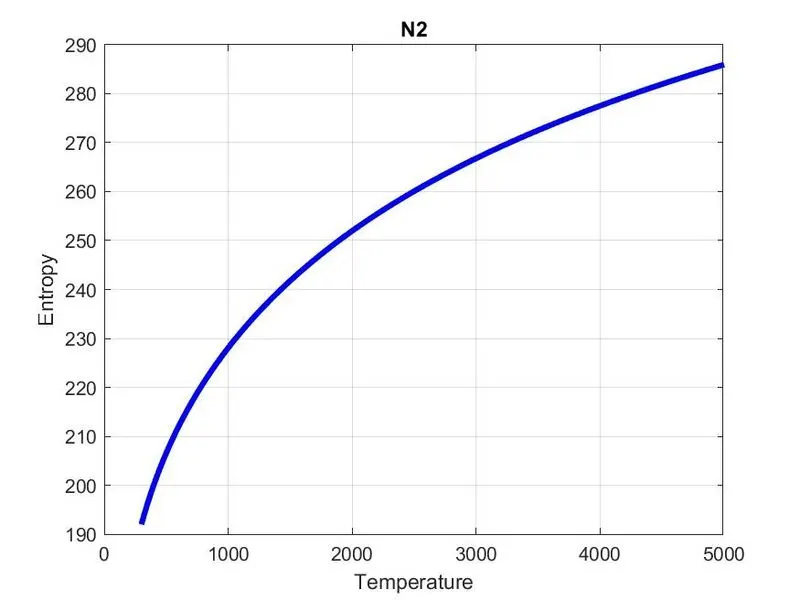
figure(2)
plot(t,s,'linewidth',3,'color','b');
title(species);
xlabel('Temperature');
ylabel('Entropy');
grid on
saveas(figure(2),'Entropy.jpg');
% plot Temperature vs Enthalpy
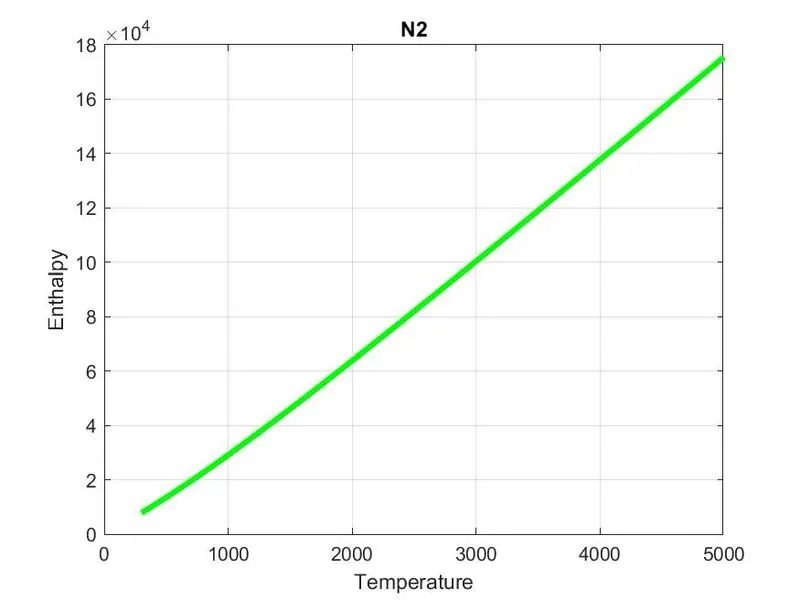
figure(3)
plot(t,H,'linewidth',3,'color','g');
title(species);
xlabel('Temperature');
ylabel('Enthalpy');
grid on
saveas(figure(3),'Enthalpy.jpg');
cd('F:Matlab programsProject 1New project 1species')
w = molecular_weight(species)
end
fucntion of enthaly
function [H] = enthalpy(a1,a2,a3,a4,a5,a6,a8,a9,a10,a11,a12,a13,t,R,mid_temp)
if(t <= mid_temp)
H = R*t.*(a8 + ((a9*t)/2) + a10*(((t).^2)/3) + a11*(((t).^3)/4) + a12*(((t).^4)/5)) + ((a13./t));
else
H = R*t.*(a1 + (a2*t)/2 + a3*(((t).^2)/3) + a4*(((t).^3)/4) + a5*(((t).^4)/5)) + ((a6./t));
end
end
function of entropy
function [s] = entropy(a1,a2,a3,a4,a5,a7,a8,a9,a10,a11,a12,a14,t,R,mid_temp)
if(t <= mid_temp)
s = R.*(a8*log(t) + (a9*t) + ((a10*(t).^2)/2) + ((a11*(t).^3)/3) + ((a12*(t).^4)/4) + a14);
else
s = R.*(a1*log(t) + (a2*t) + ((a3*(t).^2)/2) + ((a4*(t).^3)/3) + ((a5*(t).^4)/4) + a7);
end
end
function of specific heat
function [Cp] = specific_heat(a1,a2,a3,a4,a5,a8,a9,a10,a11,a12,t,R,mid_temp)
if(t <= mid_temp)
Cp = R*(a8 + a9*t + a10*(t).^2 + a11*(t).^3 + a12*(t).^4);
else
Cp = a1 + a2*t + a3*(t).^2 + a4*(t).^3 + a5*(t).^4;
end
end
function of molecular weight
% Molecular weight
function w = molecular_weight(species)
atomic_name = ['H','C','O','N','A'];
% Atomic number from periodic table
Atomic_weight = [1.008 12.011 15.999 14.007 39.948];
w = 0;
for i = 1:length(species)
for j = 1:length(atomic_name)
if strcmp(species(i),atomic_name(j))
w = w + Atomic_weight(j);
position = j;
end
end
n = str2num(species);
if n > 1
w = w + Atomic_weight(position)*(n-1);
end
end
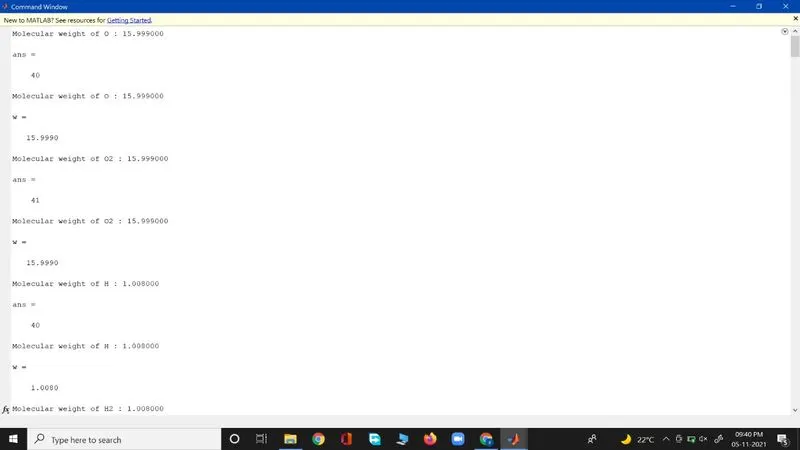
fprintf('Molecular weight of %s : ',species);
fprintf('%f',w);
disp(' ')
end
Enthalpy vs Temperature
Entropy vs Temperature
Specific Heat vs Temperature
Sample showing molecular weight of all Species
Graphs corresponding to each species are created in the directory