Project 1 - Parsing NASA thermodynamic data
Aim - To write a code in MATLAB for parsing the Nasa thermodynamics data file and calculate thermodynamics properties of various species using the data.
Objective -
- Write a function that extracts the 14 co-efficients and calculates the enthalpy, entropy and specific heats for all the species in the data file. We will be reading the file Nasa Thermodynamic.data file.
- Calculate the molecular weight of each species and display it.
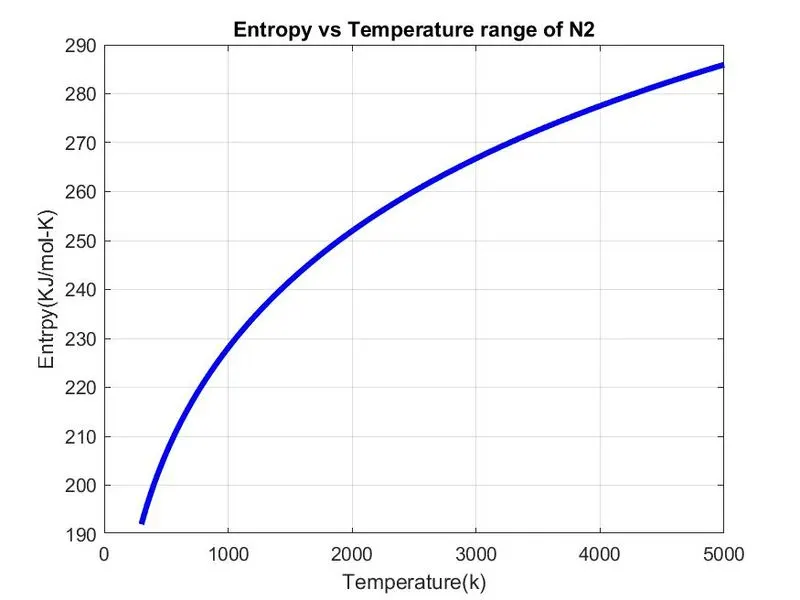
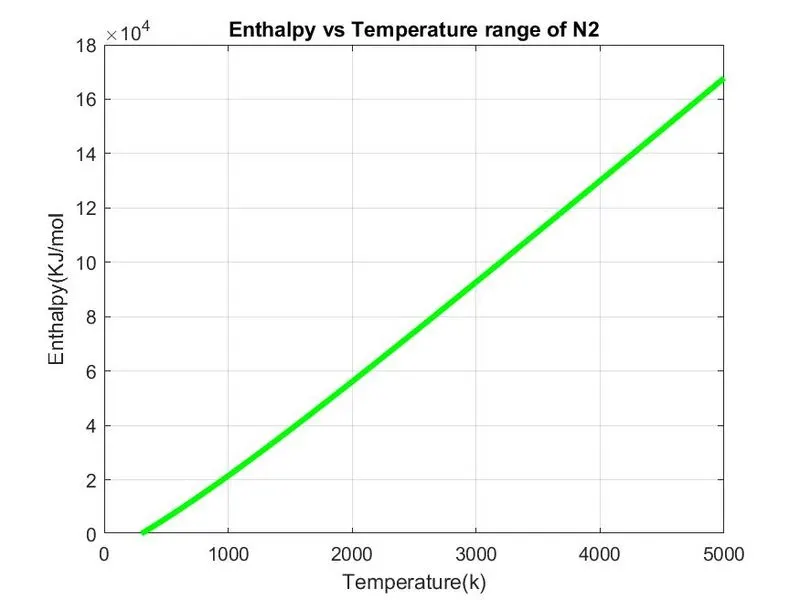
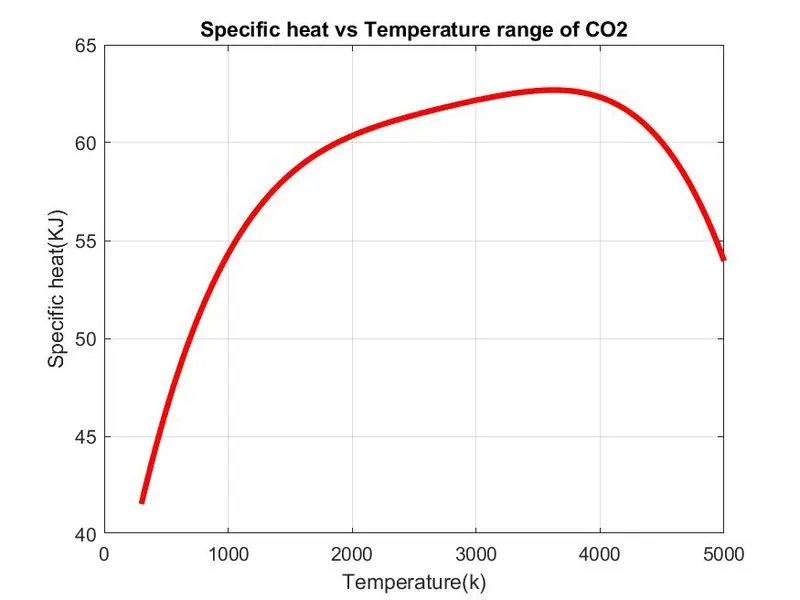
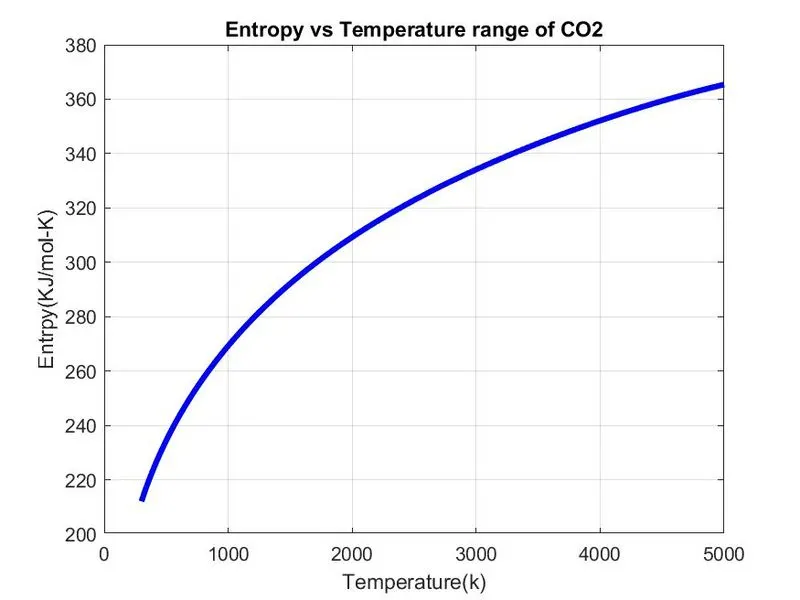
- Plot the Cp, Enthalpy and Entropy for the local temperature range (low temperature : high temperature) specific for each species.
- We have to ave the plots as images with appropriate names and save them in separate folders for each species with suitable name.
What is file parsing ?
File Parsing means reading a data stream of some sort and building an in memory model of the semantic content of that data. This aims at facilitating perfoming some kind of transformation on the data. It is the process of analyzing a string of symbols, either in natural language, computer languages or data structures. Within computational linguistiics the term is used to reer to the formal analysis by computer of a sentence or string of words into its constituents, resulting in a parse tree showing their syntactic relation to each other, which may also ontain semantic and other information.
Specific heat (Cp) -
It is the quantity of heat required to raise the temperature of one gram of a substance by one celcius degree. The units of specific heat are usually calories or joules per gram per Celsius degree. Its expressin is gives as with Cp as specific heat.
Cp = R*(a1+(a2*T)+(a3*(T).^2)+(a4*(T).^3)+(a5*(T).^4))
 function Cp = Specific_heat(a1,a2,a3,a4,a5,a8,a9,a10,a11,a12,T,R,temp_mid)

 if (T <= temp_mid)
    Cp = R*(a8 + (a9*T) + (a10*(T).^2) + (a11*(T).^3) + (a12*(T).^4));
 else
    Cp = R*(a1 + (a2*T) + (a3*(T).^2) + (a4*(T).^3) + (a5*(T).^4));
 end
end function S = Entropy(a1,a2,a3,a4,a5,a7,a8,a9,a10,a11,a12,a14,T,R,temp_mid);
if (T <= temp_mid)
S = R*(a8.*log(T) + (a9*T) + ((a10*(T).^2)/2) + ((a11*(T).^3)/3) + ((a12*(T).^4)/4) + a14);
else
S = R*(a1.*log(T) + (a2*T) + ((a3*(T).^2)/2) + ((a4*(T).^3)/3) + ((a5*(T).^4)/4) +a7);
end
end
 function H = Enthalpy(a1,a2,a3,a4,a5,a6,a8,a9,a10,a11,a12,a13,T,R,temp_mid);

if  (T <= temp_mid)
    H = R*T.*(a8 + ((a9*T)/2) + ((a10*(T).^2)/3) + ((a11*(T).^3)/4) + ((a12*(T).^4)/5) + ((a13./T)));
else
    H = R*T.*(a1 + ((a2*T)/2) + ((a3*(T).^2)/3) + ((a4*(T).^3)/4) + ((a5*(T).^4)/5) +((a6./T)));
end
end
We have created condition using if loop and make temperature less than and equal to mid temperatue to specify lower temp coefficient in formula. Then we have use else condition to specify higher temp coefficient in formula and ending loop had complete the function for enthalpy.
4) Programme for function Molecular weight (W) -
We have to create molecular weight function and assign species input to that. We will define some elements of species in atomic name array and by taking there weight we will create an atomic weight array with respect to each element.
function W = Molecular_weight(species)

atomic_name = ['H','C','O','N','Ar'];
atomic_weight = [1.008 12.011 15.999 14.007 39.948];
W = 0

for i=1:length(species)
    for j=1:length(atomic_name)
        if strcmp(species(i),atomic_name(j))
            W = W + atomic_weight(j);
            position = j;
        end
    end
    n = str2num(species);

    if n>1
        W = W + atomic_weight(position)*(n-1);
    end
end

fprintf('Molecular weight of %s :- ',species);
fprintf('%f',W);
disp(' ')
end- We have created a for loop condition which runs the length of species and another nested for loop which runs lenght of the string.
- Then we have put condition using if condition and using strcmp command we compare species and atomic name strings.
- Now we have string the number using str2num command which assign to n, then we had run the condition if loop to find weather specis contains more than one element.
- If there are more than one elements then we will increment atomic weight by doing multiplication of postition and n-1 to atomic weight array.
- Now print the molecular weight and display it using fprintf and disp command respectively.
5) Main programme for parsing Nasa thermodynamics data file -
 close all
clear all
clc

f1 = fopen('THERMO.dat','r')
get = fgetl(f1);
temp = fgetl(f1);      % reading temperature from file
s = strsplit(temp);    % splitting

temp_low = str2num(s{2});
temp_mid = str2num(s{3});
temp_high = str2num(s{4});
T = linspace(temp_low,temp_high,1000);
R = 8.314;

% skipping the comment lines
for i=1:3
    get=fgetl(f1);
end
for j= 1:53
    tline = fgetl(f1);
    A = strsplit(tline,' ');
    species = (A{1});

    low_temp = str2num(A{end-3});
    mid_temp = str2num(A{end-2});
    high_temp = str2num(A{end-1});

    tline1 = fgetl(f1);
    a = strfind(tline1,'E');

    %finding higher coefficients
    a1 = tline1(1:a(1)+3);
    a1 = str2num(a1);
    a2 = tline1(a(1)+4:a(2)+3);
    a2 = str2num(a2);
    a3 = tline1(a(2)+4:a(3)+3);
    a3 = str2num(a3);
    a4 = tline1(a(3)+4:a(4)+3);
    a4 = str2num(a4);
    a5 = tline1(a(4)+4:a(5)+3);
    a5 = str2num(a5);

    tline2 = fgetl(f1);
    b = strfind(tline2,'E');
    a6 = tline2(1:b(1)+3);
    a6 = str2num(a6);
    a7 = tline2(b(1)+4:b(2)+3);
    a7 = str2num(a7);

    % finding lower coefficients
    a8 = tline2(b(2)+4:b(3)+3);
    a8 = str2num(a8);
    a9 = tline2(b(3)+4:b(4)+3);
    a9 = str2num(a9);
    a10 = tline2(b(4)+4:b(5)+3);
    a10 = str2num(a10);

    tline3 = fgetl(f1);
    c = strfind(tline3,'E');
    a11 = tline3(1:c(1)+3);
    a11 = str2num(a11);
    a12 = tline3(c(1)+4:c(2)+3);
    a12 = str2num(a12);
    a13 = tline3(c(2)+4:c(3)+3);
    a13 = str2num(a13);
    a14 = tline3(c(3)+4:c(4)+3);
    a14 = str2num(a14);

    % specific heat calculation
    Cp = Specific_heat(a1,a2,a3,a4,a5,a8,a9,a10,a11,a12,T,R,temp_mid);

    % entropy claculation
    S = Entropy(a1,a2,a3,a4,a5,a7,a8,a9,a10,a11,a12,a14,T,R,temp_mid);

    % enthalpy calculation
    H = Enthalpy(a1,a2,a3,a4,a5,a6,a8,a9,a10,a11,a12,a13,T,R,temp_mid);

    % molecular weight calculation of the species
    W = Molecular_weight(species);
    MW_file = fopen('Molecular weight.txt','w');
    fprintf(MW_file,'Molecular weight of %s is %d',species,W);
    fclose(MW_file);

    cd('C:\Users\gaikw\Documents\MATLAB')
    mkdir(species);
    cd(species);

    %plotting of Cp, H, S and T
    %plot 1 of Cp vs T
    figure(1)
    plot(T,Cp,'linewidth',3,'color','r');
    xlabel('Temperature(k)');
    ylabel('Specific heat(KJ)');
    title(sprintf('Specific heat vs Temperature range of %s',species));
    grid on
    saveas(figure(1),'Cp vs T.jpg');

    %plot 2 of S vs T
    figure(2)
    plot(T,S,'linewidth',3,'color','b');
    xlabel('Temperature(k)');
    ylabel('Entrpy(KJ/mol-K)');
    title(sprintf('Entropy vs Temperature range of %s',species));
    grid on
    saveas(figure(2),'S vs T.jpg');

    %plot 3 of H vs T
    figure(3)
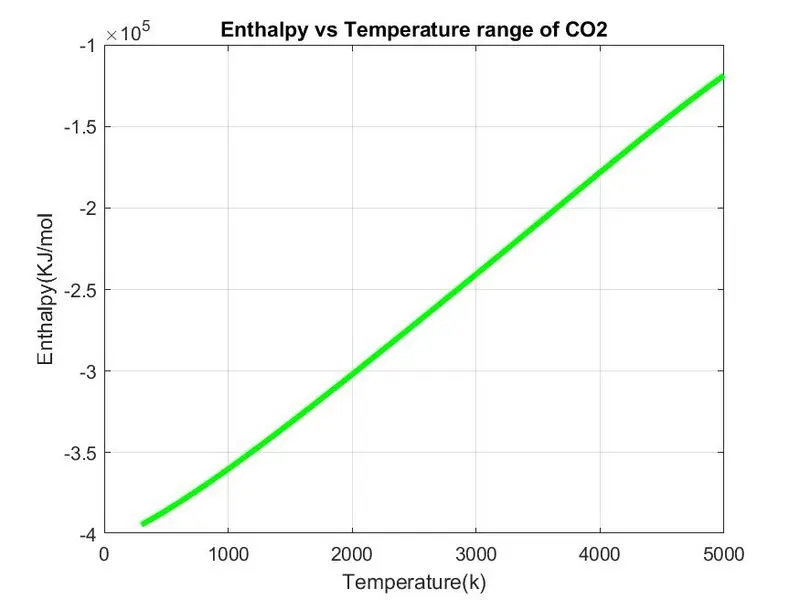
    plot(T,H,'linewidth',3,'color','g');
    xlabel('Temperature(k)');
    ylabel('Enthalpy(KJ/mol');
    title(sprintf('Enthalpy vs Temperature range of %s',species));
    grid on
    saveas(figure(3),'H vs T.jpg');

    %Molecular weight
    W = Molecular_weight(species)

end
- At first we will open file THERMO.dat and read it using fopen command, then using fgetl command we read temperature and split them using strsplit to convert into array. Then to find low, mid, high temperatures we will convert string to number using str2num command.
- Now using linspace command we will make temperature range and run loop to skip command lines using fgetl command inside loop.
- Lets run the loop to find 53 element in data file with help of fgetl command and then split it into the array for finding the species line, species name and no. of themperatures in species line. Then we will read new line.
- Now to read the coefficient in file we have to find 'E'string using strfind command for finding before and after numbers of coefficients. Then we will find 14 coefficients and convert them into number of strings, out of which 7 coefficients are higher temp. and other 7 are low temp.
- Now using those 14 coefficients for low and high temperature, we will specify Specific heat (Cp), Enthalpy (H) and Entropy (S) functions to find these parameters and using Molecular weight (W) function we will find molecular weight for different species.
- Now we will write Molecular weight.txt file and then using fprintf write all molecualr weights of species and close this file using fclose command. Now we change directory using cd command to save our files and to save file using mkdir command to change directory folder.
- Now lets plot specific heat, entropy and enthalpy agianst temperature one by one for different species and using saveas command we will save our all plots.
Outputs -
Plots -
1) O2 plots -
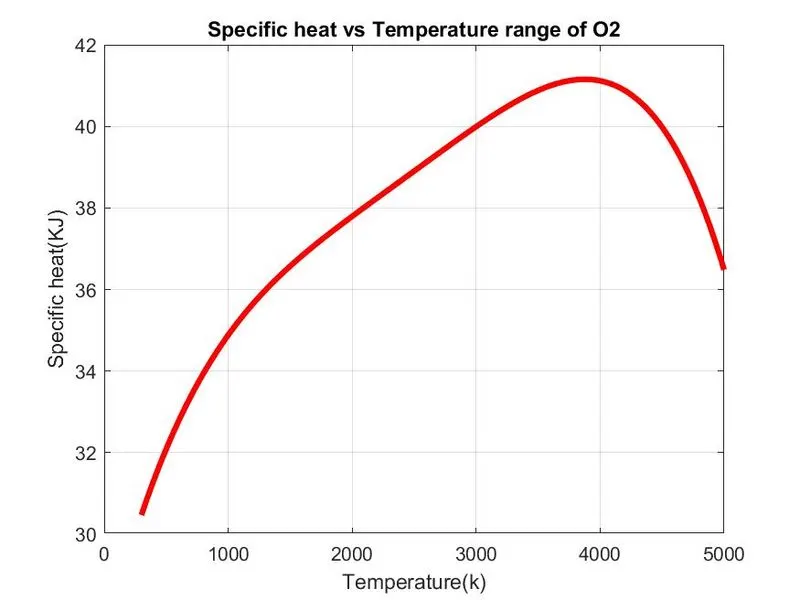
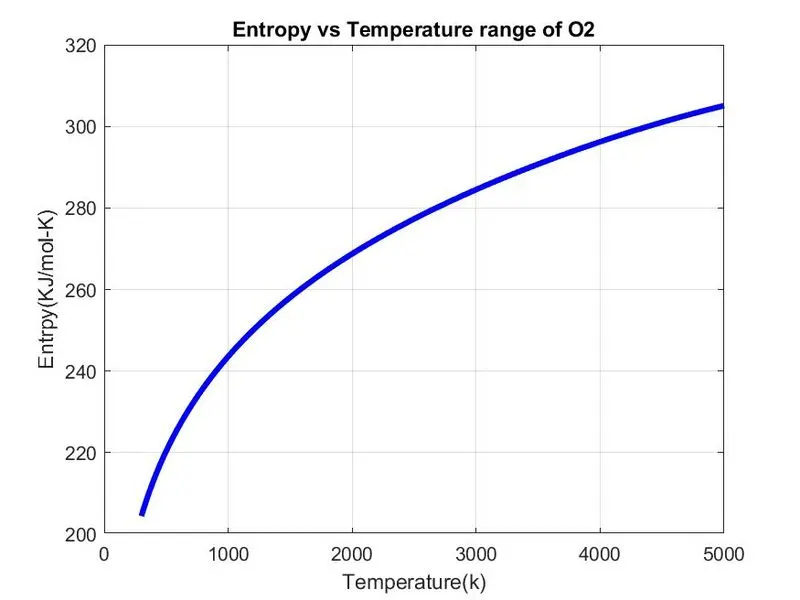
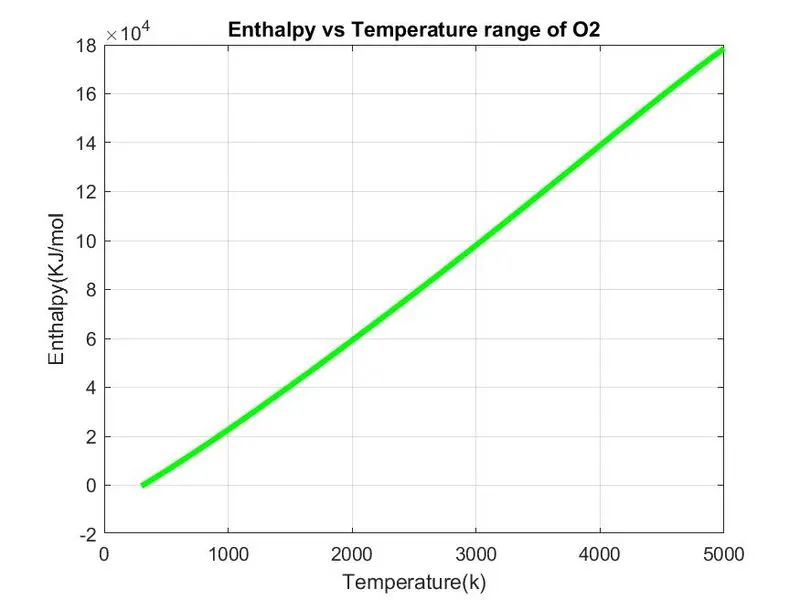
2) N2 plots -
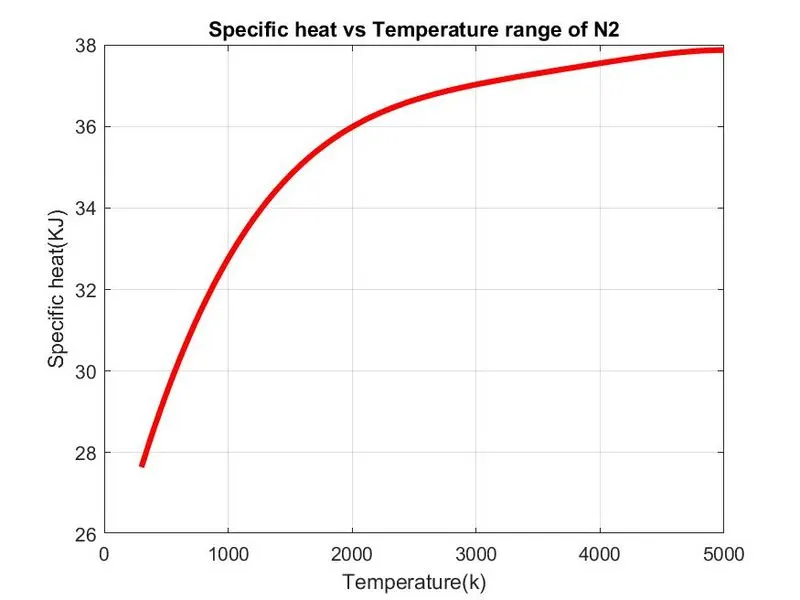
3) CO2 plots -
Screenshot of all saved folders -

Molecular weight output of some species display in command window -
Molecular weight of O :- 15.999000
Molecular weight of H :- 1.008000
Molecular weight of OH :- 17.007000
Molecular weight of C :- 12.011000
Molecular weight of CH :- 13.019000
>>