Project 1 - Parsing NASA thermodynamic data
AIM
1. To Write a function that extracts the 14 co-efficients of the species name which is given as an inpu.
- The FIRST 7 coefficients are HIGH-temperature coefficients
- The SECOND 7 coefficients are LOW-temperature coefficients.
- and calculates the enthalpy, entropy and specific heats for all the species in the data file.
- Using the LOCAL TEMPERATURE RANGES which is unique for each individual species, and calculates the enthalpy, entropy and specific heats for the input species in the data file.
2. To Calculate the molecular weight of each species and display it in the command window.
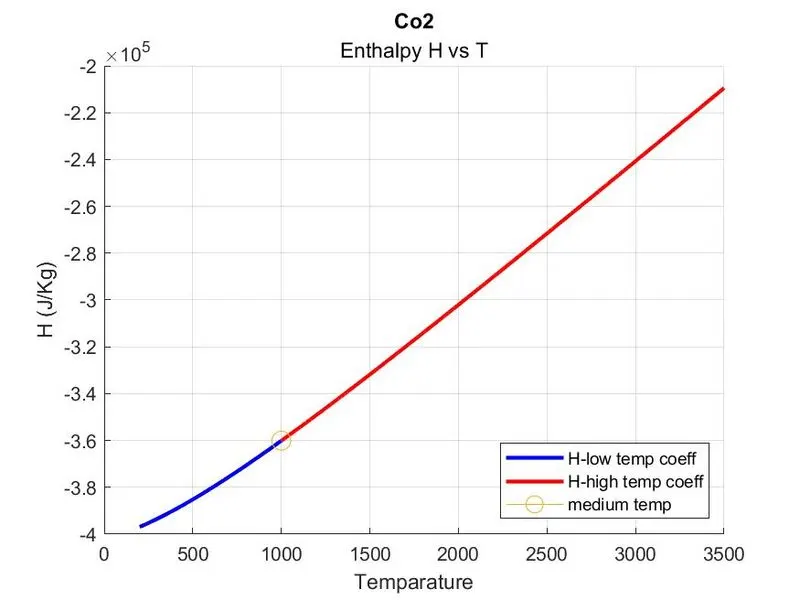
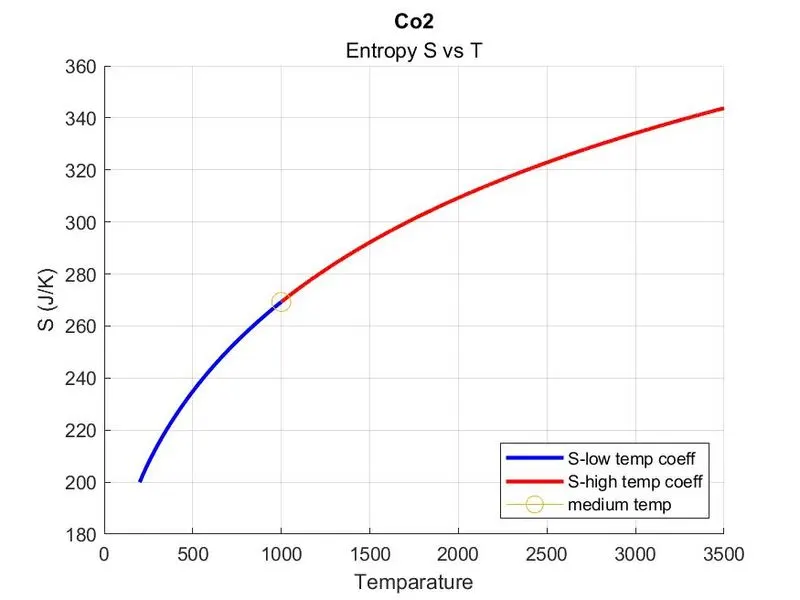
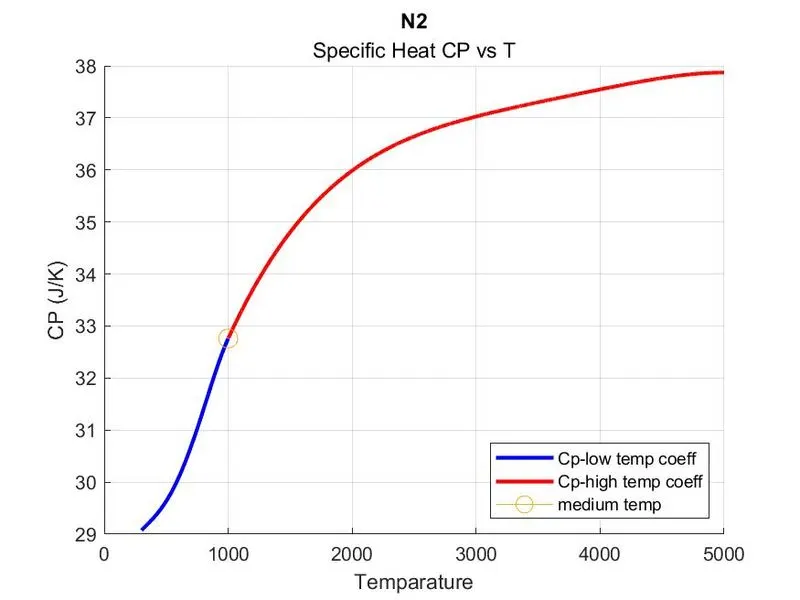
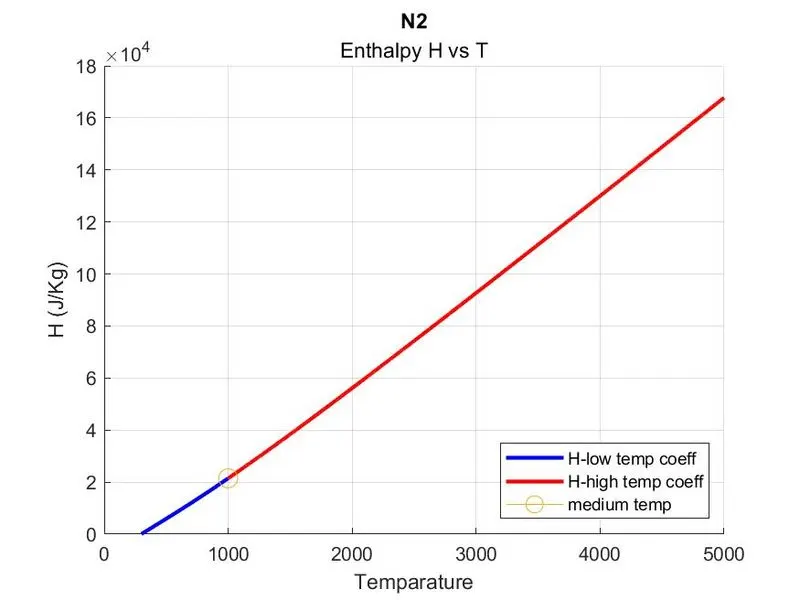
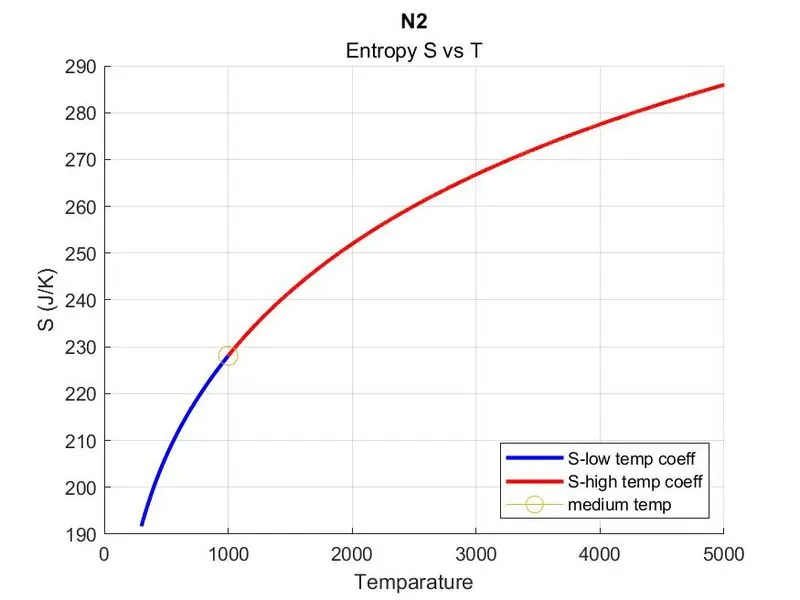
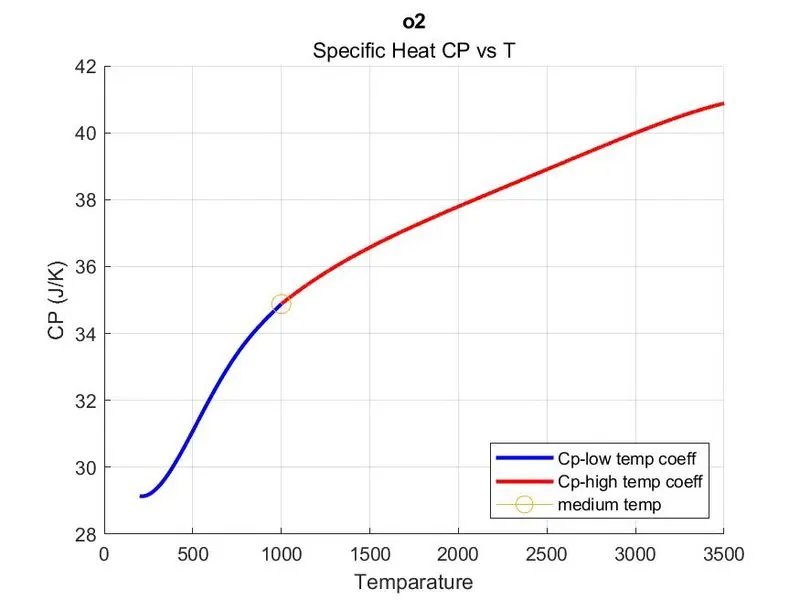
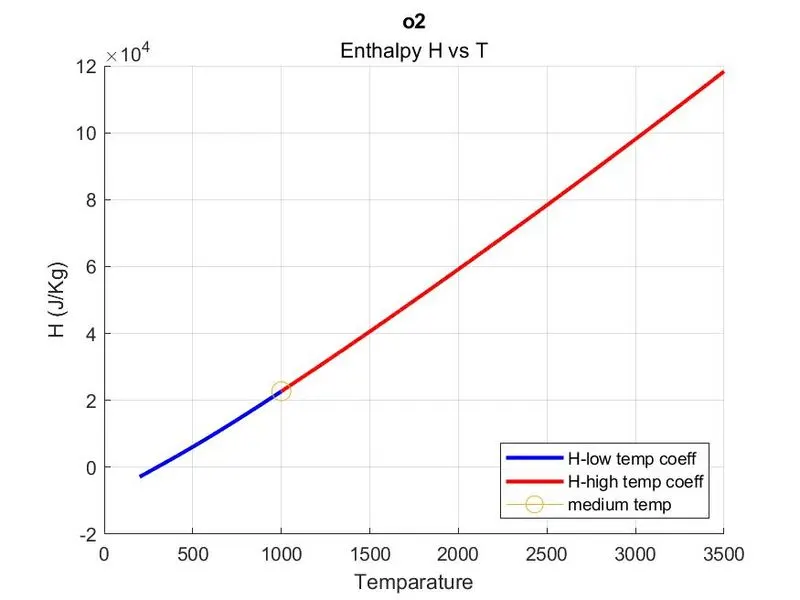
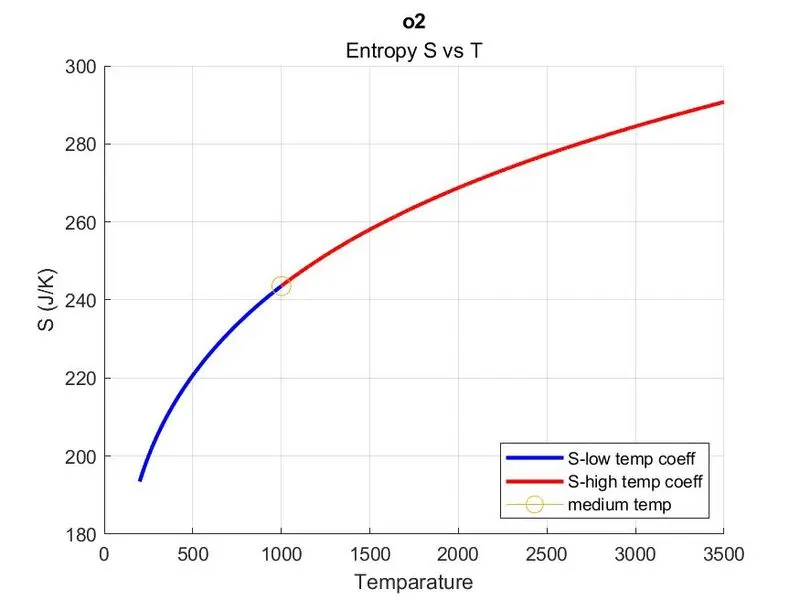
3. To Plot the Cp, Enthalpy and Entropy for the local temperature range (low temperature: high temperature) specific for each species.
4. To Save the plots as images with appropriate names and dump them in separate folders for each species with a suitable name.
Introduction
Formulae Used,
Here R is the universal gas constant, T is the temperature
Important Note: Visual Inspection of the THERMO.dat for understanding the symmetry of data provided plays a key role in writing the code.
Through thorough visual inspection for symmetry in data the following are interpreted and 1,2,3 help writing the code with indexs to parse the required data.
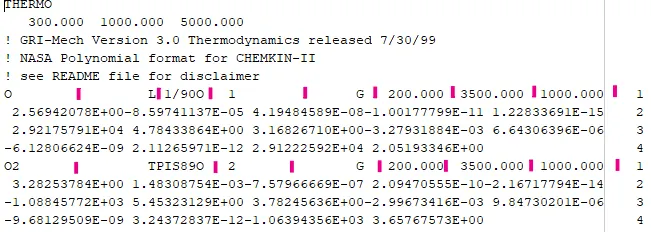
image 1
1. After 'fgetl' & splitting the data at 'spaces' the species is in the first position (as shown in Image 1): helps in comparing data with input. (code Line no 23-29)
2. Since the number of spaces arent the same (as shown in image 1) in all the lines with local temperature limits, the symmetry of data stands from the 'end' of line. so we use "end" as our reference index.(line no 63-65)
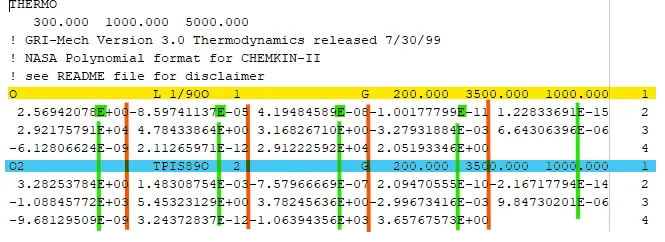
Image 2
3. Since 'E' is only constant position(Marked in green in image 1) we find the index of E. Adding 3 to index give the end of coeff (marked in red) using this symmetry we retrieve the coefficients. (line no 37-57)
Main Code
The code is attached with necessary comments to make is self explainatory.
close all
clear all
clc
%load the nasa thermographic file & should be in same folder
A= fopen('THERMO.dat','r');
fgetl(A);% skipping first line
%saving the next line for retriving global temparatures
global_temp = fgetl(A);
%splitting the line at spaces
Temp= strsplit(global_temp,' ');
%the data is stored as 'CELL' structure, explains the use of {}.
%str2double is used to convert a string to number
T_gl = str2double(Temp{2})%global low
T_gm = str2double(Temp{3})%global medium
T_gh = str2double(Temp{4})%global High

%definig variable to store input
gas= input("enter the gas for calcualtion\n", 's')

%while loop to search for the gas from the text file
while ~feof(A) %feof function is test for end of file
    %return the next line and save in variable data
    data=fgetl(A);
    %splitting the variable "data" with spaces in array
    a= strsplit(data,' ');
    %After visual analysis the position of the gas is in supposed to be in th first position
    b=a(1);
    %comparing input to match with the 'b'
    if strcmpi(b, gas)
        fprintf('\n')
        disp('Gas Data Availbale')% if match is found
        %extract the required search data coefficients

        %line 1 after the 'data' where the string is found
        f1= fgetl(A);
        %gives index position of 'E' in the line to retrive coefficients
        l1 = strfind(f1,'E');
        c1 =str2double(f1(1:l1(1)+3));
        c2 =str2double(f1(l1(1)+4:l1(2)+3));
        c3 =str2double(f1(l1(2)+4:l1(3)+3));
        c4 =str2double(f1(l1(3)+4:l1(4)+3));
        c5 =str2double(f1(l1(4)+4:l1(5)+3));
        %line 2 after the 'data' where the string is found
        f2=fgetl(A);
        l2 = strfind(f2,'E');
        c6 =str2double(f2(1:l2(1)+3));
        c7 =str2double(f2(l2(1)+4:l2(2)+3));
        c8 =str2double(f2(l2(2)+4:l2(3)+3));
        c9 =str2double(f2(l2(3)+4:l1(4)+3));
        c10 =str2double(f2(l1(4)+4:l1(5)+3));
        %line 3 after the 'data' where the string is found
        f3=fgetl(A);
        l3 = strfind(f3,'E');
        c11 =str2double(f3(1:l3(1)+3));
        c12 =str2double(f3(l3(1)+4:l3(2)+3));
        c13 =str2double(f3(l3(2)+4:l3(3)+3));
        c14 =str2double(f3(l3(3)+4:l3(4)+3));

        %parsing the local temparature limits for the gas
        fprintf('\n')
        disp('local temparature limits')
        %since the position are constant from the 'end' of the line. we use 'end' as our index
        t_ll = str2double(a{end-3})
        t_lh = str2double(a{end-2})
        t_lm = str2double(a{end-1})

        %% calculation of molecular weight
        %the atoms that are availabel in thermo.dat file
        atoms =['HCNOA'];
        % atomic weights of the respective atoms
        atomic_w = [ 1 12 14 16 40];
        W= 0;%initiation value for weight
        %i value changes from 1 to length of input gas
        for i = 1:length(gas)
            %j value chamnges from 1 to length(atoms)=5
            for j= 1: length(atoms)
                %comparing str of input gas to the atoms
                if strcmpi(gas(i),atoms(j))
                    %j gives the index of the matching string
                    W = W + atomic_w(j);%atomic_w(j) give the weight of atom at index j
                    P = j;%saving the index of j in P to use it outside the loop
                end
            end
            %x is converting the str to number to find the number of atoms
            %of particular atom
            %for example if gas =H2, double of gas(1) H is null, double of
            %gas(2)is 2
            x= str2double(gas(i));
            if (x>1)
                W = W + (atomic_w(P)*(x-1));
                %since we have already added once the X value is subtracted
            end
        end

        break % if the string copmpare in line 29 is satisfied the while loop breaks

    else % if the line 29 is not satisfied the loop returns to line 23
        %display gas not availabel for every line search where th line 29
        %is false
        disp('gas data unavailabel')
        %'data' in line 21 takes the next line in file for str compare
        continue
        %continues till end of file "feof"
    end
end
%% calculation of specific heat,Enthalpy & Entropy
%defining the variables in "for" loop as an array to save continuos loop values
%paramenters for high temperature
T_h= [];
cp_high=[];
H_high=[];
S_high=[];
%defining the variables in "for" loop as an array to save continuos loop values
%paramenters for low temperature
T_l=[];
cp_low =[];
H_low =[];
S_low=[];
%universal Gas constant R
R= 8.314;
for T = [t_ll:t_lh]
    if (T>t_lm)
        %saving all the T values greater than t_lm in T_h
        T_h=[T_h; T];
        %saving all the cp_high,H_high,S_high values as array for every T
        %value in 'if' condition to avoid overwriting in loop
        cp_high =[cp_high; R*(c1 + c2*T + c3*(T.^2)+c4*(T.^3)+c5*(T.^4))];
        H_high = [H_high; R*T*(c1 + c2*(T/2) + c3*((T.^2)/3) +c4*(T.^3)/4 + c5*(T.^4)/5 + c6/T)];
        S_high = [S_high; R*(c1*log(T) + c2*T + c3*(T.^2)/2+c4*(T.^3)/3+c5*(T.^4)/4+c7)];
    elseif (T<=t_lm)
        %saving all the T values less than t_lm in T_h
        T_l= [T_l;T];
        %saving all the cp_high,H_high,S_high values as array for every T
        %value in 'esleif' condition to avoid overwriting
        cp_low =[cp_low; (c8 + c9*T + c10*(T^2)+c11*(T^3)+c12*(T^4))*R];
        H_low = [H_low; (c8+c9*(T/2)+c10*((T^2)/3)+c11*((T^3)/4)+c12*((T^4)/5)+(c13/T))*R*T];
        S_low = [S_low; R*(c8*log(T) + c9*T + c10*(T.^2)/2+c11*(T.^3)/3+c12*(T.^4)/4+c14)];
    end
end
%% Making new directory for every input of 'gas'
mkdir(gas)%creating new directory for every 'gas' input
cd(gas)%changing the directory to created folder using mkdir
save(gas)% saving all work space variable in .mat file
%saving only the required data from the workspace
save(gas,'t_ll','t_lm','t_lh','c1','c2','c3','c4','c5','c6','c7','c8','c9','c10','c11','c12','c13','c14','-ascii')

%% Creating separate text file for Local temp and Coefficients
%creating table for the coefficients to be saved in .txt file inside the
%diretory
rowname_local ={'low temp';'medium_temp';'High_temp'};%row names
Local_T =[t_ll; t_lm; t_lh];%values
Tab = table(Local_T,'RowNames',rowname_local)

%creating table for the coefficients to be saved in .txt file inside the
%diretory
%row names for coefficents are defined
rowname_coeff ={'c1';'c2';'c3';'c4';'c5';'c6';'c7';'c8';'c9';'c10';'c11';'c12';'c13';'c14'};
coeff = [c1;c2;c3;c4;c5;c6;c7;c8;c9;c10;c11;c12;c13;c14];
Tab2 = table(coeff,'RowNames',rowname_coeff)

%writing the tables Tab & Tab2 to the respective files with appropiate
%delimiters for separation with defined file names
writetable(Tab,'Parsed local temp.txt','Delimiter',';','WriteRowNames',true)
writetable(Tab2,'Parsed coefficents.txt','Delimiter',';' ,'WriteRowNames',true)
Molecular_Weight = W
%% Plotting graphs and saving the plots in created directory 'gas'
figure(1)%numbering the figure
hold on%hold all the plot functions on figure 1 till the 'hold off'
grid on%grid view
title(gas,'Specific Heat CP vs T')%show title input 'gas' and descrpition in''
plot(T_l,cp_low,'linewidth',2,'color','b')%low coeff specific heat plotted in blue
plot(T_h,cp_high,'linewidth',2,'color','r')%high coeff specific heat plotted in red
plot(t_lm,cp_low(end),'marker','o','markersize',10)%medium temp point of transittion for coeffs
xlabel('Temparature')%x axis label
ylabel('CP (J/K)')%y axis label
legend('Cp-low temp coeff','Cp-high temp coeff','medium temp','location','southeast')
hold off
%saving the figure with a "file name 1-Specific heat and format .jpg"
saveas(figure(1),'1-Specific heat.jpg')

figure(2)
hold on
grid on
title(gas,'Enthalpy H vs T')
plot(T_l,H_low,'linewidth',2,'color','b')
plot(T_h,H_high,'linewidth',2,'color','r')
plot(t_lm,H_low(end),'marker','o','markersize',10)
xlabel('Temparature')
ylabel('H (J/Kg)')
legend('H-low temp coeff','H-high temp coeff','medium temp','location','southeast')
hold off
saveas(figure(2),'2-Enthalpy.jpg')

figure(3)
hold on
grid on
title(gas,'Entropy S vs T')
plot(T_l,S_low,'linewidth',2,'color','b')
plot(T_h,S_high,'linewidth',2,'color','r')
plot(t_lm,S_low(end),'marker','o','markersize',10)
xlabel('Temparature')
ylabel('S (J/K)')
legend('S-low temp coeff','S-high temp coeff','medium temp','location','southeast')
hold off
saveas(figure(3),'3-Entropy.jpg')

fclose('all');
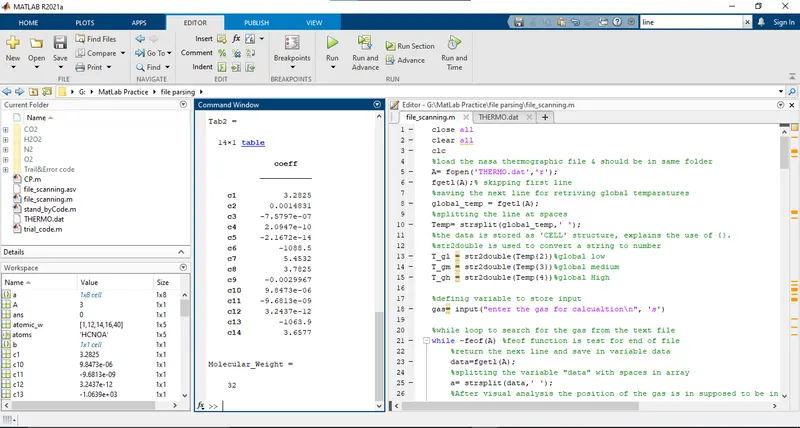
The screen capture of Matlab showing the folder, workspace, command window and editor
Solution for Aim 2 * shows the Molecular weight in Command Window
The Solution for the plots saved in respective folders as per the AIM 3 & AIM 4 are attached in link below:
https://drive.google.com/drive/folders/1ssvHkeVhj52fxX5awg2Pr1vy-I2HhJG_?usp=sharing
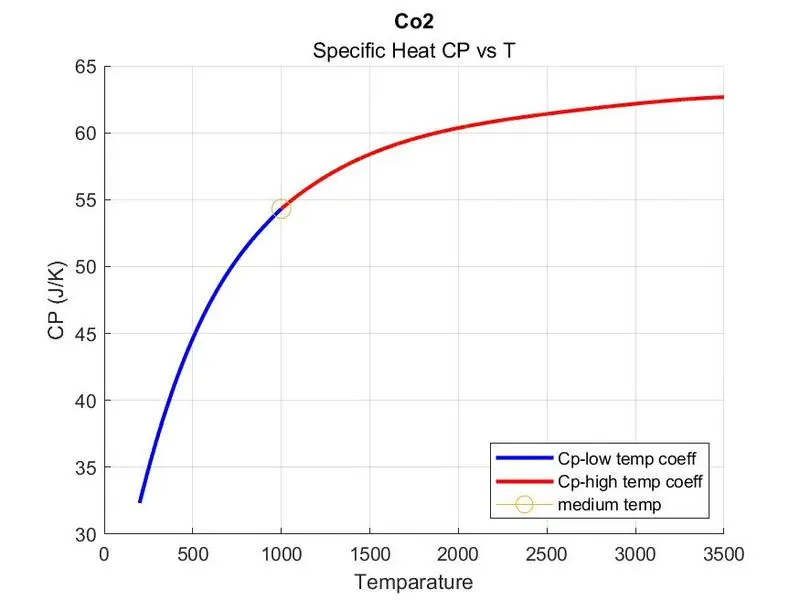
The Plots for CO2, N2 & O2 are attached below
Result
1)when run program is executed, the command windows ask for input gas.
2)For every time the input is given and is found in the THERMO.dat file, the programs reads the local temperatures & coefficients of that input to compute the Cp H S values based on the parsed parameters. and plots the respective graphs.
3) Also create a directory in the name of input to save the workspace variables .m , plots, local temperatures and coefficients in their respective formats.
Thus the project is successfully executed