Project 1 - Parsing NASA thermodynamic data
PARSING NASA THERMODYNAMIC FILE
Aim:
To write a program code that parse the NASA thermodynamic file and calculates the specific heat, Entropy, Enthalpy of all the gases present in the file.
Objective:
1. write a Matlab code that extracts 14 coefficients and 53 gas elements present in the file.
2. Calculate specific heat, Entropy, Enthalpy of all the gases present in the file.
3. Calculate the molecular weight of each species present in the file.
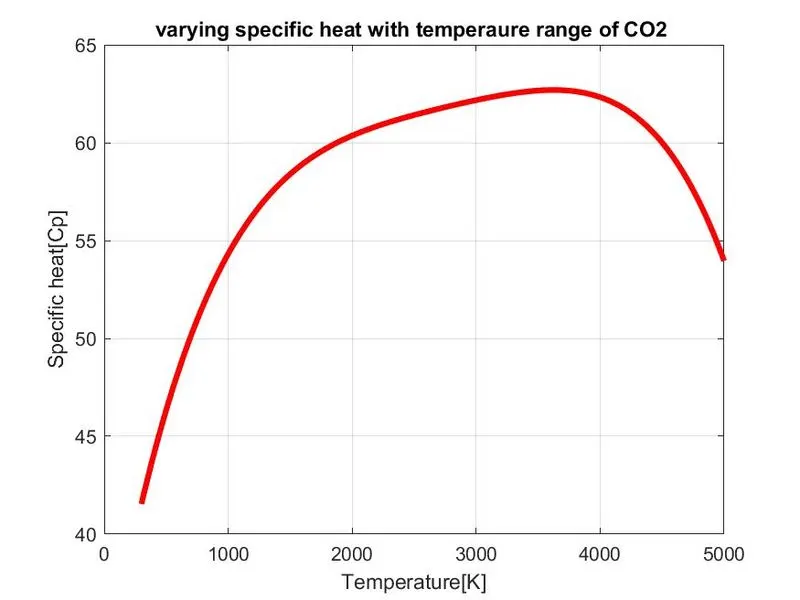
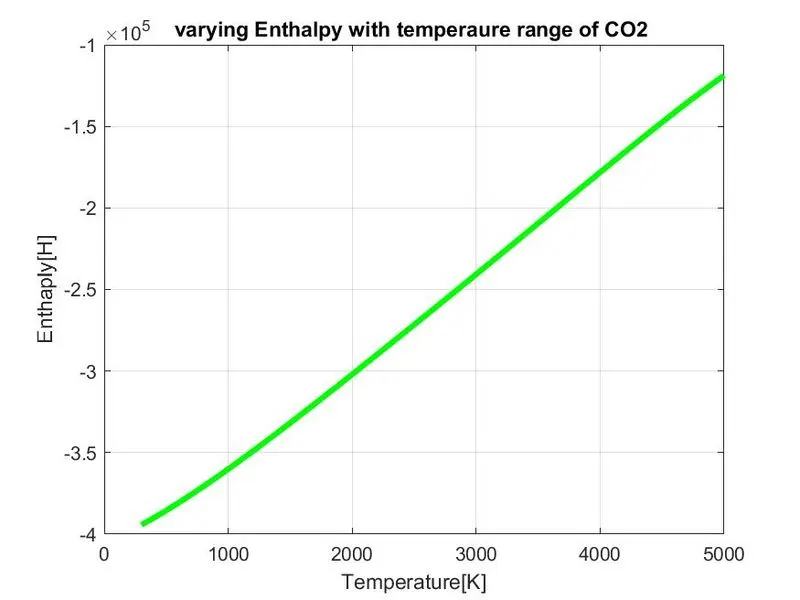
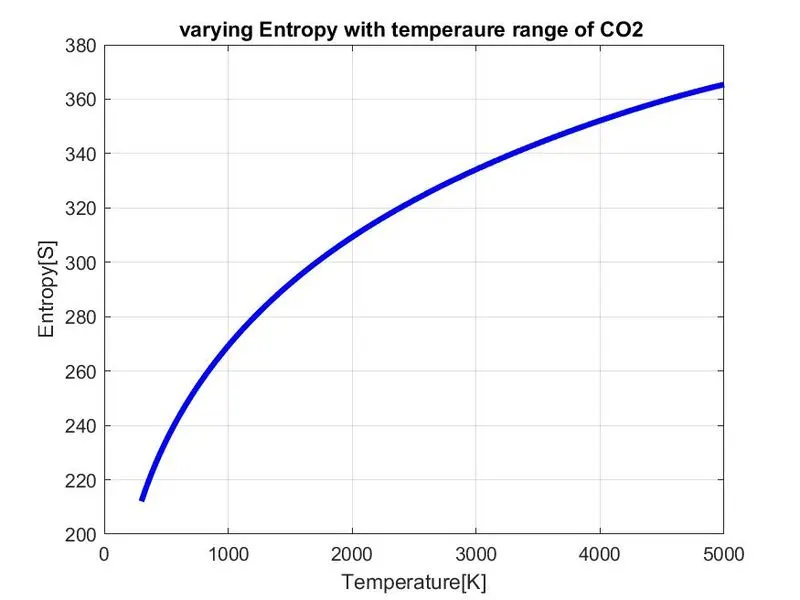
4. Plot Cp, Enthalpy, Entropy Vs Temperature and save as images each under separate gas element folders.
File parsing:
- File parsing is the process of reading data from a file and utilizes the same in the program. Out of 53 elements present in the file, common gas elements are Hydrogen, Oxygen, Carbon, Nitrogen, and Argon.
- Nasa Polynomials:

- Here, the 1st 7 coefficients are high-temperature coefficients (above 1000k), and 2nd 7 coefficients are low-temperature coefficients (below 1000k).
Coding:
Main Program:
clear all
close all
clc

%Reading NASA Thermodynamic data file
f1=fopen('THERMO.dat','r');
gt=fgetl(f1);

%Obtaining Temperature data by reading header from file
global_temp=fgetl(f1);

%splitting the temp data
t=strsplit(global_temp);

g_low_temp=str2num(t{2});
g_med_temp=str2num(t{3});
g_high_temp=str2num(t{4});

%Assuming temp range
Temp=linspace(g_low_temp,g_high_temp,1000);

%Universal gas constant J/mol-K
R=8.3145;

% Skipping three comment lines

for i= 1:3
    gt=fgetl(f1);
end

for i=1:53
    line_1=fgetl(f1);
    A=strsplit(line_1,' ');
    Species_sp=(A{1});

     line_2=fgetl(f1);
     a=strfind(line_2,'E');

     line_3=fgetl(f1);
     b=strfind(line_3,'E');

     line_4=fgetl(f1);
     c=strfind(line_3,'E');

     % Extracting first 7 coefficients/ High temp coefficients
     a1=line_2(1:a(1)+3);
     a1=str2num(a1);
     a2=line_2(a(1)+4:a(2)+3);
     a2=str2num(a2);
     a3=line_2(a(2)+4:a(3)+3);
     a3=str2num(a3);
     a4=line_2(a(3)+4:a(4)+3);
     a4=str2num(a4);
     a5=line_2(a(4)+4:a(5)+3);
     a5=str2num(a5);

     a6=line_3(1:b(1)+3);
     a6=str2num(a6);
     a7=line_3(b(1)+4:b(2)+3);
     a7=str2num(a7);


     % Extracting second 7 coefficients/ Low temp coefficients
     a8=line_3(b(2)+4:b(3)+3);
     a8=str2num(a8);
     a9=line_3(b(3)+4:b(4)+3);
     a9=str2num(a9);
     a10=line_3(b(4)+4:b(5)+3);
     a10=str2num(a10);
     a11=line_4(1:c(1)+3);
     a11=str2num(a11);
     a12=line_4(c(1)+4:c(2)+3);
     a12=str2num(a12);
     a13=line_4(c(2):c(3)+3);
     a13=str2num(a13);
     a14=line_4(c(3)+4:c(4)+3);
     a14=str2num(a14);

     %Function1- specific heat calculation

     Cp = specificheat(a1,a2,a3,a4,a5,a8,a9,a10,a11,a12,Temp,R,g_med_temp);

     %Function 2 Enthalpy Calculation

     H = Enthalpy(a1,a2,a3,a4,a5,a6,a8,a9,a10,a11,a12,a13,Temp,R,g_med_temp);

     %Function 3 Entropy Calculation

     S = Entropy(a1,a2,a3,a4,a5,a7,a8,a9,a10,a11,a12,a14,Temp,R,g_med_temp);

     %Function 4 Molecular Weight Calculation
     Molecularweight(i) = Molecular_weight(Species_sp);
     %To read and write molecular weight list

     Molecular_list = fopen('Molecular weight.txt','a+');
     fprintf(Molecular_list,'Molecular weight %s is %d','n',Species_sp,Molecularweight);
     fclose(Molecular_list);

     %saving the species_sp on the folder
     cd('C:/Users/Feroz/Documents/MATLAB/species list')
     mkdir(Species_sp);
     cd(Species_sp);


     %Plot1 Specific heat (cp) vs Temperature range(Temp)

     figure(1)
     plot(Temp,Cp,'linewidth',3,'color','r')
     xlabel('Temperature[K]')
     ylabel('Specific heat[Cp]')
     title(sprintf('varying specific heat with temperaure range of %s ',Species_sp))
     grid on
     saveas(figure(1),'Specific Heat.jpg');

     %Plot2 Enthalpy(H) vs Temperature range(Temp)

     figure(2)
     plot(Temp,H,'linewidth',3,'color','g')
     xlabel('Temperature[K]')
     ylabel('Enthaply[H]')
     title(sprintf('varying Enthalpy with temperaure range of %s ',Species_sp))
     grid on
     saveas(figure(2),'Enthalpy.jpg');


     %Plot3 Entropy(S) vs Temperature range(Temp)

     figure(3)
     plot(Temp,S,'linewidth',3,'color','b')
     xlabel('Temperature[K]')
     ylabel('Entropy[S]')
     title(sprintf('varying Entropy with temperaure range of %s ',Species_sp))
     grid on
     saveas(figure(3),'Entropy.jpg');

     cd('C:/Users/Feroz/Documents/MATLAB')

     %Molecular weight

     M = Molecular_weight(Species_sp);
     f2=fopen('molecular mass','w');
     fprintf('%s n %s n %f n', 'species','Molecular mass',M);
     fclose(f2)

end
Explanation:
1. Started with standard clear all, close all, and clc.
2. Data from the Nasa Thermodynamic file is read using fgetl(f) command.
3. Global temperature ranges is mentioned and values are split.
4.The 1st three comment lines from the files are skipped and the Universal gas constant value is considered.
5. For all 53 elements present in the file, the species name is separated and also 14 coefficients from each species element are extracted.
6. All the 4 functions ( Cp, Enthalpy, Entropy, Molecular weight ) codes are called inside the main functions.
7. Molecular list file is opened and printed.
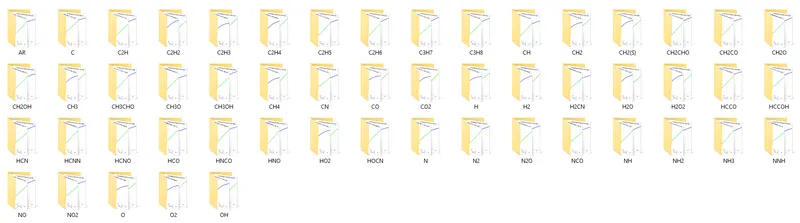
8. Folders for all the 53 different species are created.
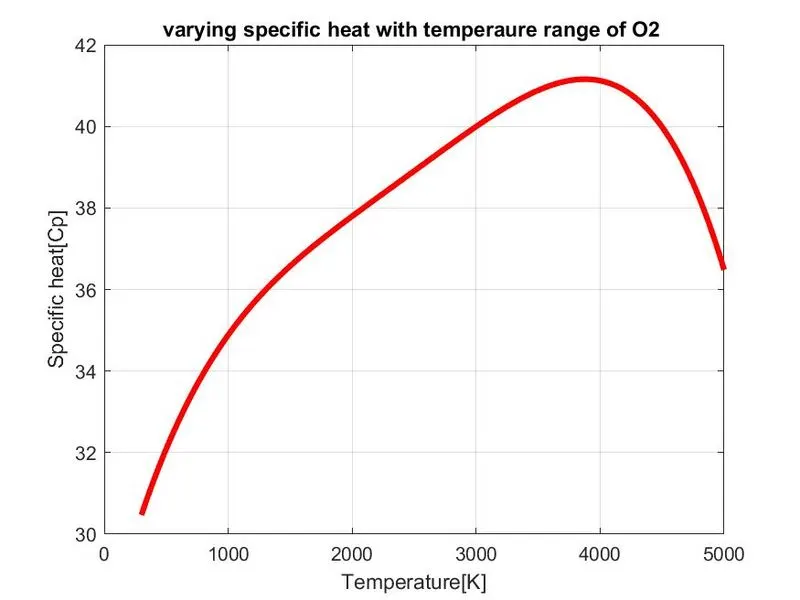
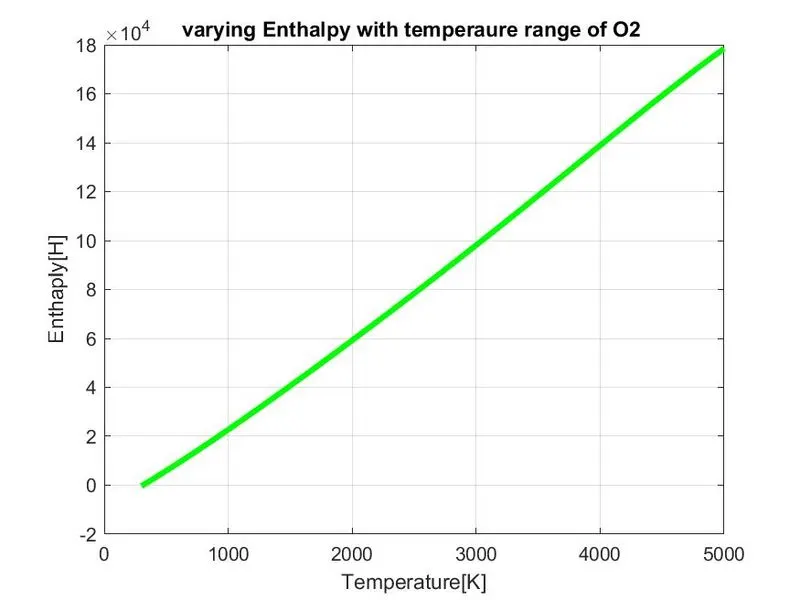
9. Plots for Cp,H,S vs Temp with varying range are plotted and saved as images under each folder.
Function codes:
1. Specific heat:
%Function1- specific heat calculation

function Cp = specificheat(a1,a2,a3,a4,a5,a8,a9,a10,a11,a12,Temp,R,g_med_temp)

%Comparing with g_med_temp
%if temp <= global_med_temp, minimum co efficients are taken
%else temp>=global_med_temp, max. coefficients are taken

if Temp <= g_med_temp
     Cp= R*(a8+(a9*Temp)+(a10*(Temp).^2) + (a11*(Temp).^3) + (a12*(Temp).^4));
else
    Cp= R*(a1+(a2*Temp)+(a3*(Temp).^2) + (a4*(Temp).^3) + (a5*(Temp).^4));
end
2. Enthalpy:
%Function 2 Enthalpy Calculation

function H = Enthalpy(a1,a2,a3,a4,a5,a6,a8,a9,a10,a11,a12,a13,Temp,R,g_med_temp)
%Comparing with g_med_temp
%if temp <= global_med_temp, minimum co efficients are taken
%else temp>=global_med_temp, max. coefficients are taken

if Temp <= g_med_temp
    H= R*Temp.*(a8+ ((a9*Temp)/2)+ ((a10*(Temp).^2)/3) + ((a11*(Temp).^3)/4) + ((a12*(Temp).^4)/5) + (a13./Temp));
else
    H= R*Temp.*(a1+ ((a2*Temp)/2)+ ((a3*(Temp).^2)/3) + ((a4*(Temp).^3)/4) + ((a5*(Temp).^4)/5) + (a6./Temp));
end
3. Entropy:
%Function 3 Entropy Calculation

function S = Entropy(a1,a2,a3,a4,a5,a7,a8,a9,a10,a11,a12,a14,Temp,R,g_med_temp)
%Comparing with g_med_temp
%if temp <= global_med_temp, minimum co efficients are taken
%else temp>=global_med_temp, max. coefficients are taken

if Temp <= g_med_temp
    S = R*(a8.*log(Temp) + (a9.*Temp) + (a10*((Temp).^2)/2) + (a11*((Temp).^3)/3) + (a12*((Temp).^4)/4) + a14);
else
    S = R*(a1.*log(Temp) + (a2.*Temp) + (a3*((Temp).^2)/2) + (a4*((Temp).^3)/3) + (a5*((Temp).^4)/4) + a7);
end
4. Molecular weight:
%Function 4 Molecular weight calculation

function Molecularweight = Molecular_weight(Species_sp)

%Atomic names
atomic_name = ['H','C','O','N','A'];

%where H - Hydrogen & C - Carbon & O - Oxygen & N - Nitrogen & A - Argon

fprintf('Molecular Weight');
fprintf('Species_sp');
fprintf(' : ');

Atomic_weight = [1.008 12.011 15.999 14.007 39.948];

% starting range of molecules
Molecularweight = 0;

%Adding the values to obtain the value of particular species_sp


for i = 1:length(Species_sp)
    for j = 1: length(atomic_name)

        if strcmpi(Species_sp(i),atomic_name(j))
            Molecularweight= Molecularweight + Atomic_weight(j);
            position = j;
        end
    end

    n = str2num(Species_sp(i));

    if n>1
        Molecularweight = Molecularweight + Atomic_weight(position)*(n-1)
    end
end
fprintf('molecular weight %s : ',Species_sp);
fprintf('%d',Molecularweight);
disp(' ');
end
Code Explanation:
- The 1st three function codes are written based on the NASA polynomials with if and else command for 7 sets of each coefficient.
- Molecular weight function code for adding the atomic weight of each element of different species.
Output:
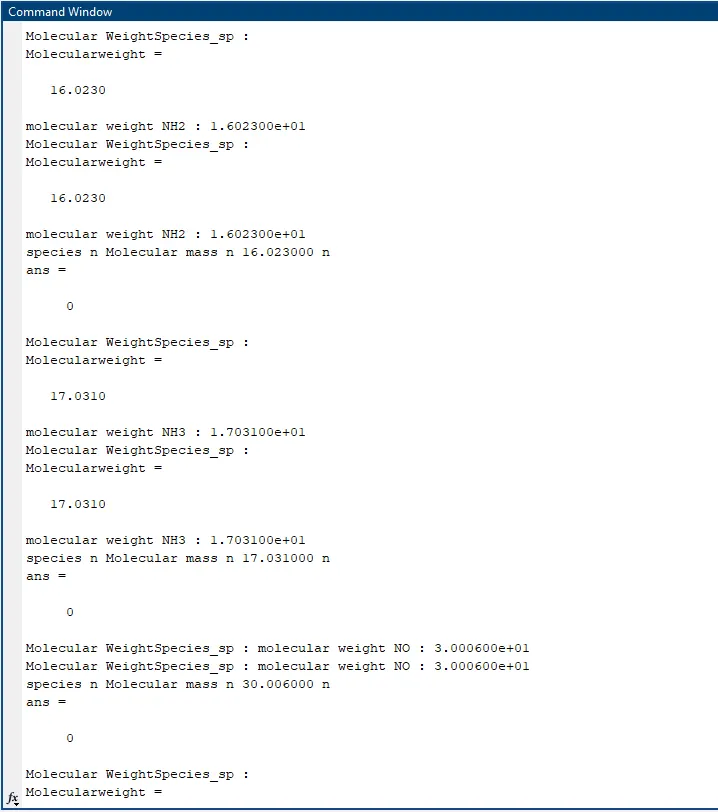
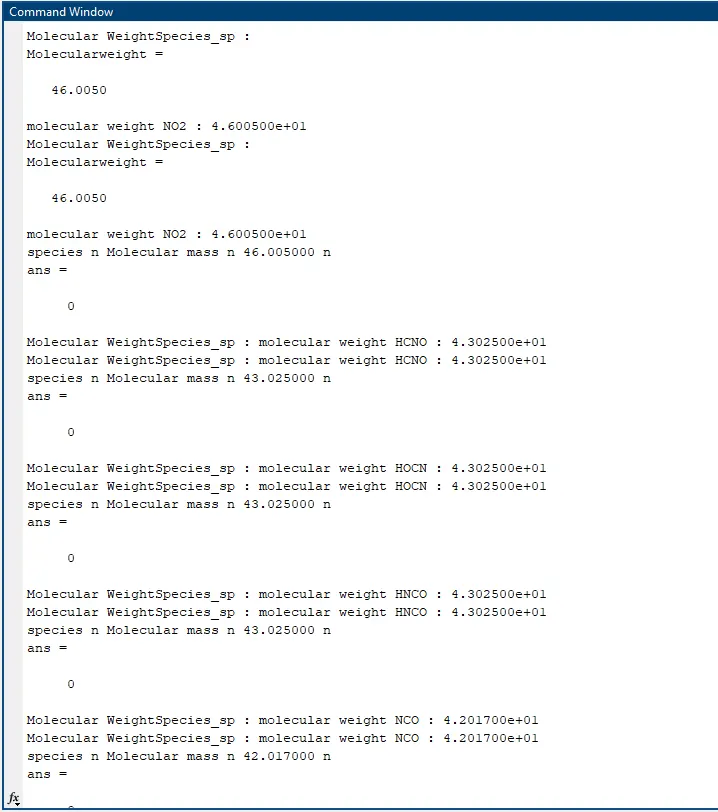
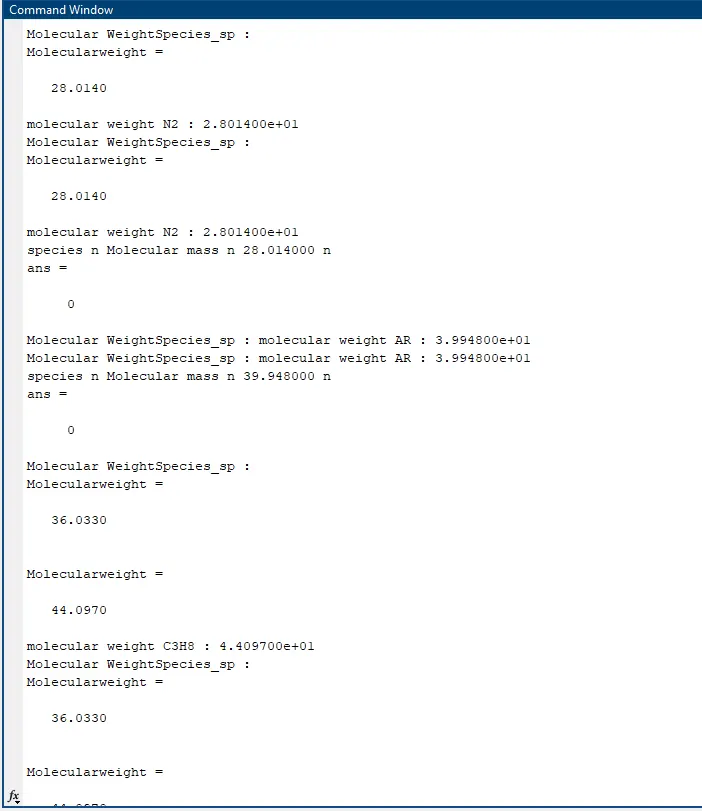
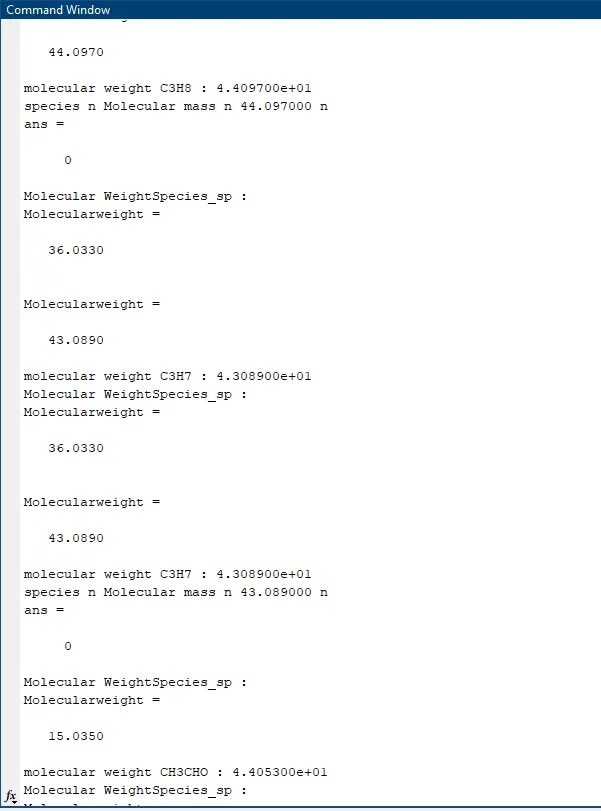
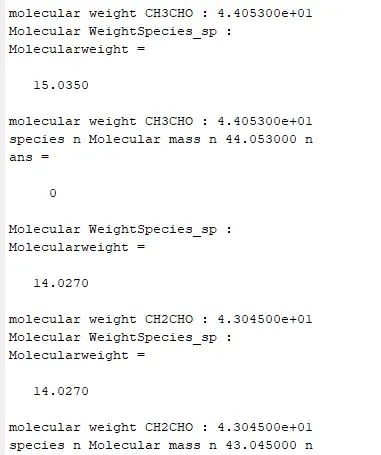
The molecular weight of each species:
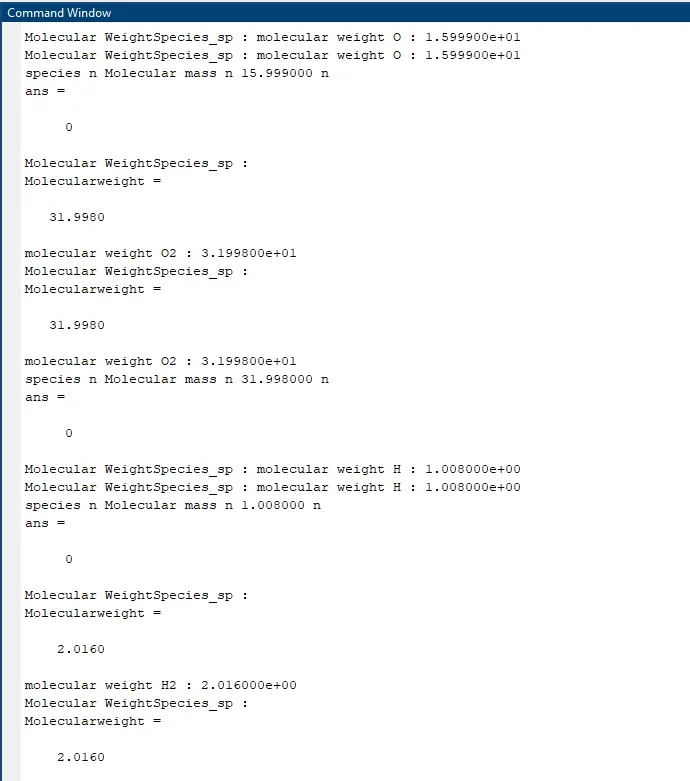
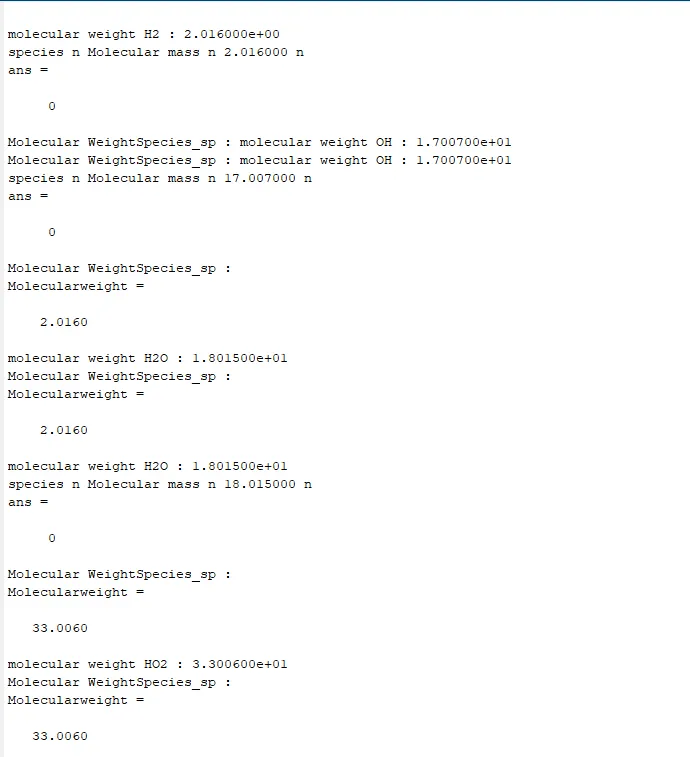
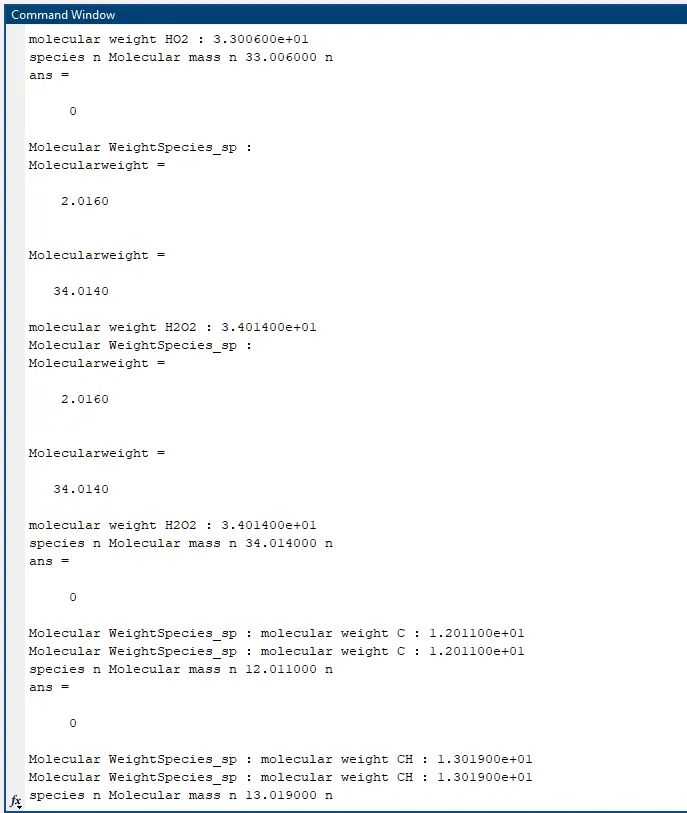
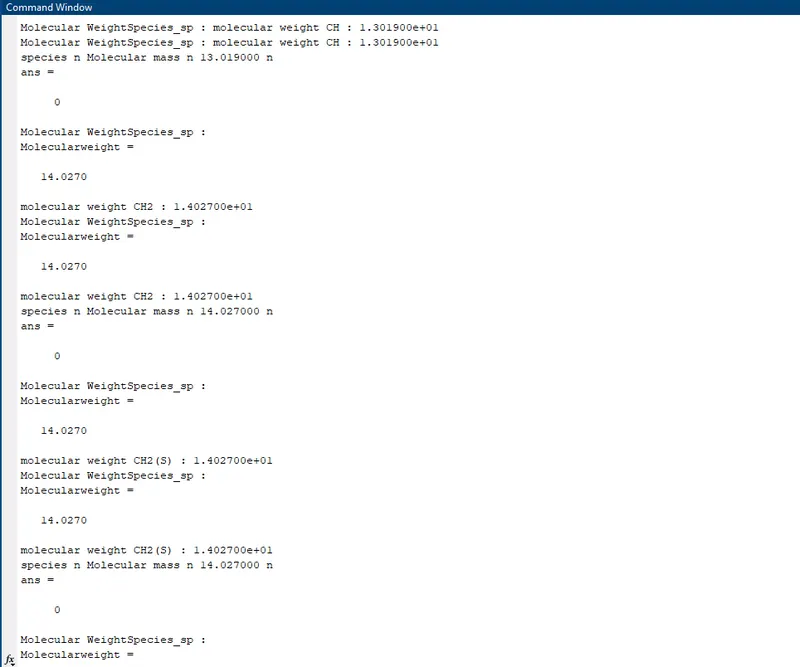
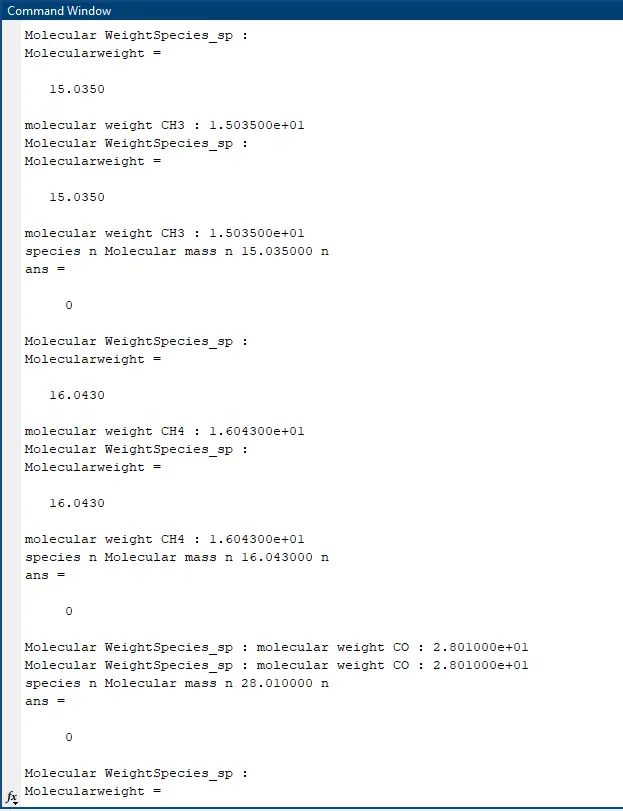
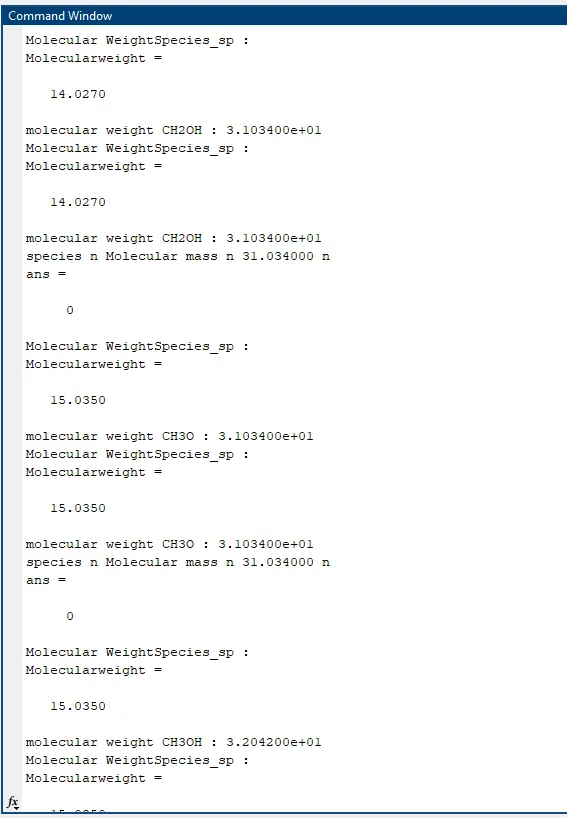
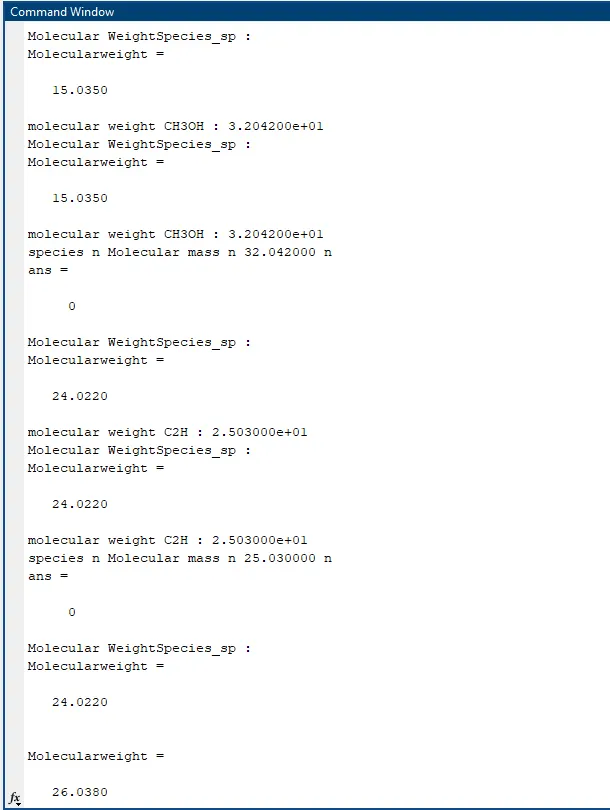
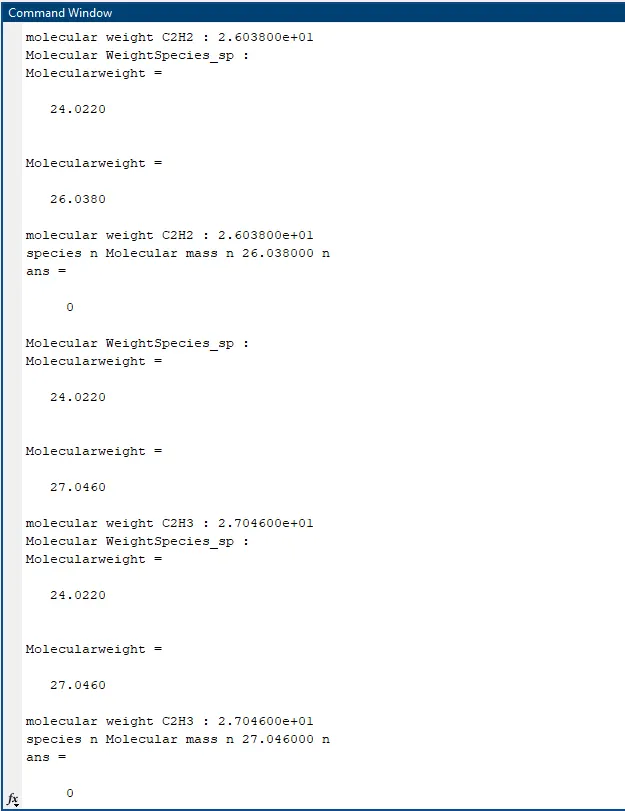
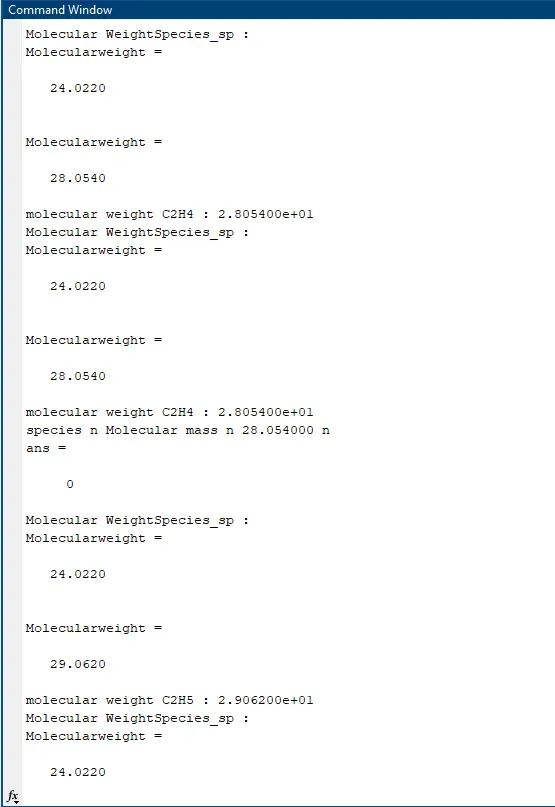
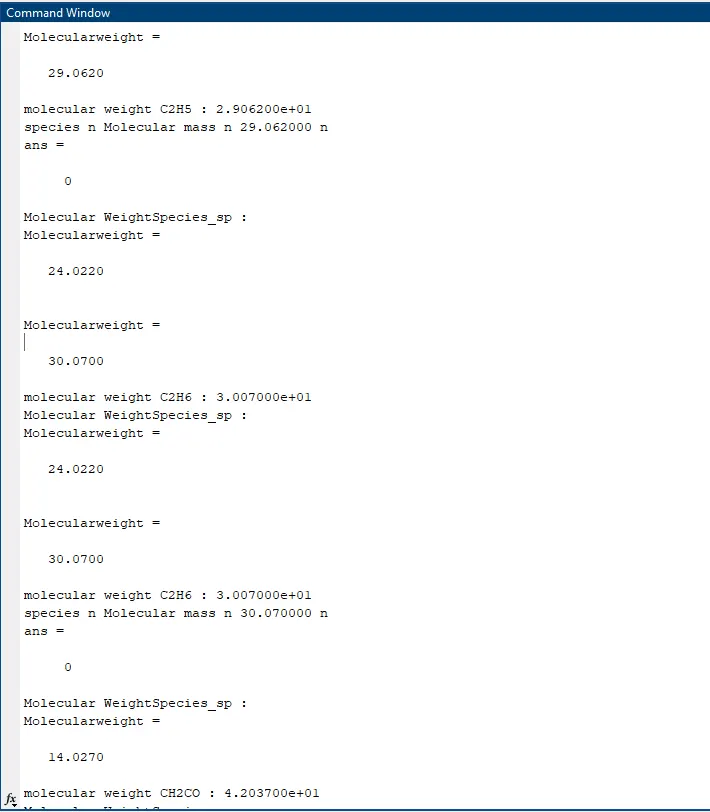
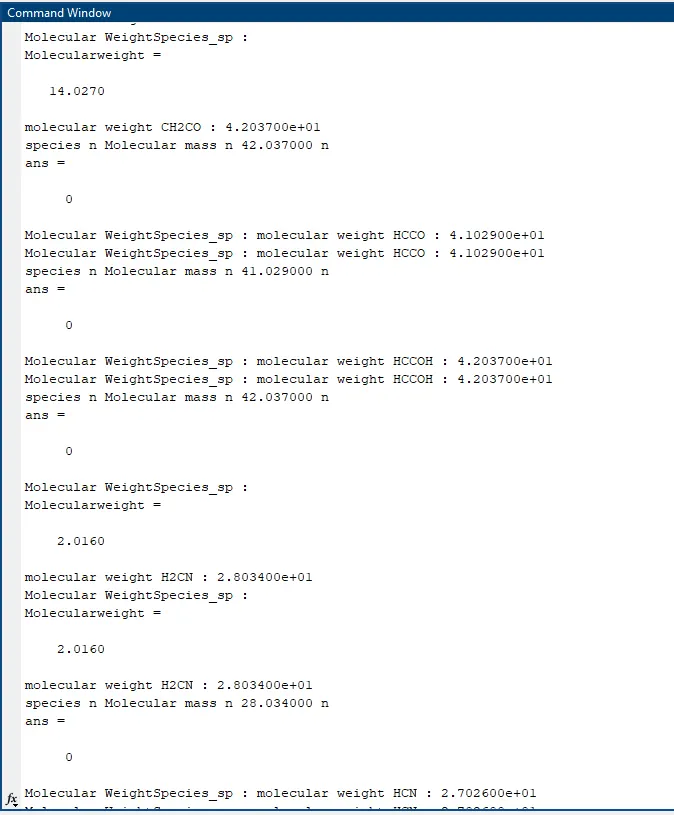
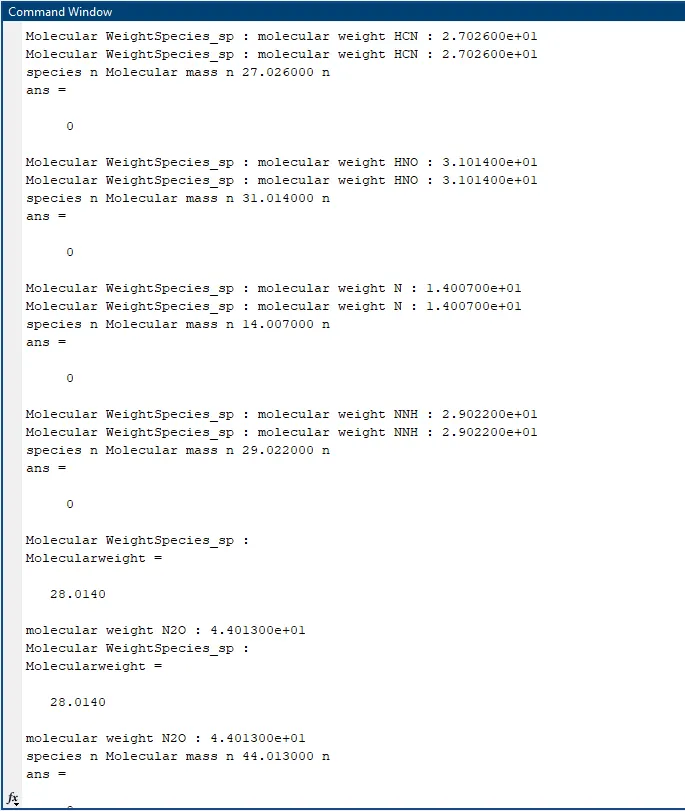
Screenshot of folders created and plots dumbed in it:
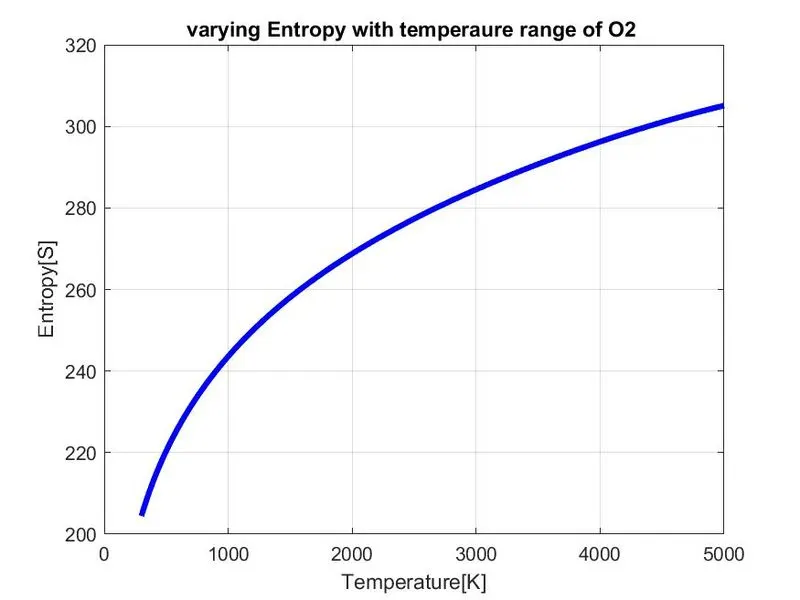
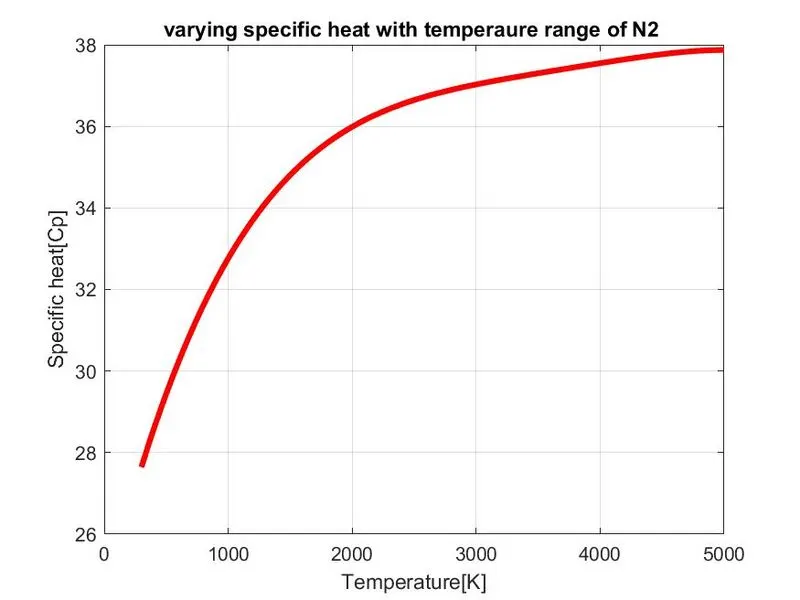
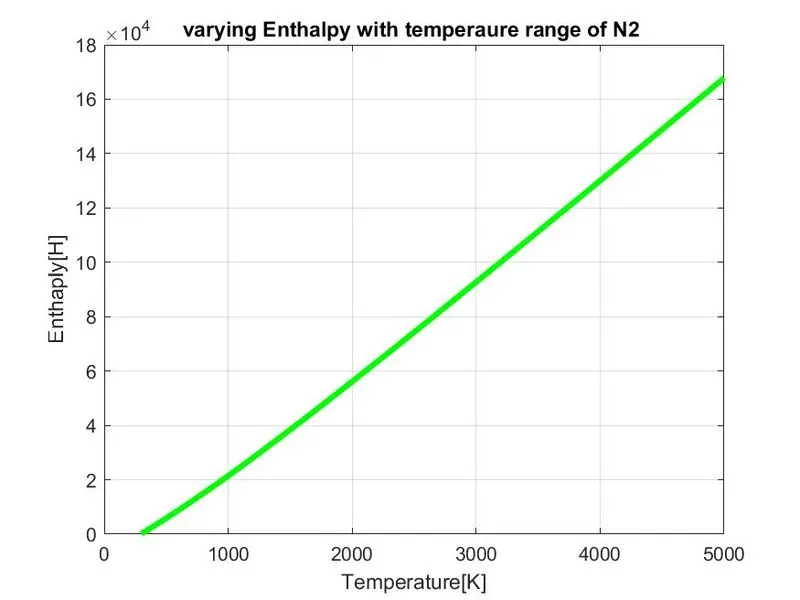
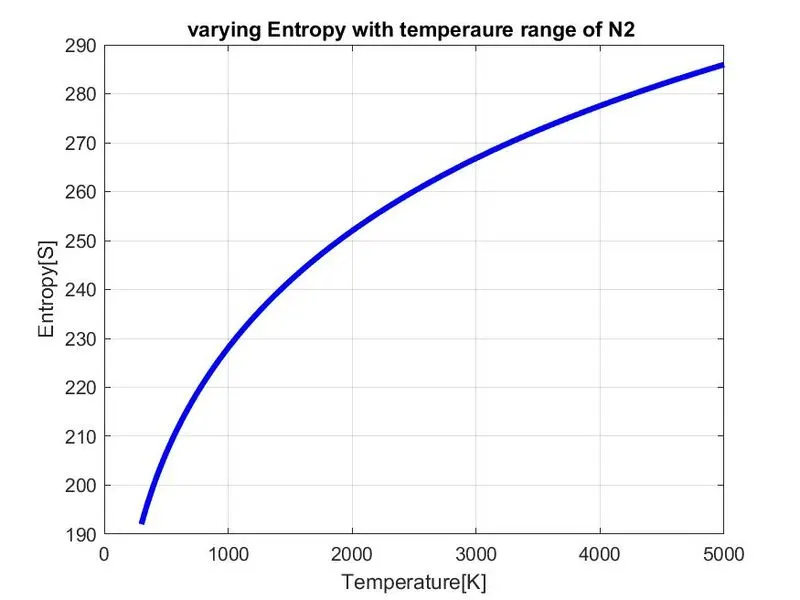
Plot results of Specific heat, Entropy, Enthalpy of O2,N2 and CO2 gases:
1. Plots for O2:
2. Plots for N2:
3. Plots for CO2:
References:
1. https://in.mathworks.com/help/matlab/ref/strcmpi.html
2. https://in.mathworks.com/help/matlab/ref/if.html
3. https://in.mathworks.com/help/matlab/ref/sprintf.html
4. https://in.mathworks.com/help/matlab/ref/saveas.html
Results:
The coefficients and elements are extracted and Specific heat, Enthalpy and Temperature are calculated. and Plots are plotted and saved under each folder.