Project 1 - Parsing NASA thermodynamic data
Parsing NASA Thermodynamic Data
File Parsing :-
Parsing in computer languages refers to syntactic analysis of the input code into its components parts in order to facilitate the writing of compilers and interpreters. It can be used to describe split or separation.
Parsing a file means reading in a data stream of some sort and building an in memory model of the semantic content of that data. This aims at facilitating performing some kind of transformation on the data.
File parsing is done to extract data from the file, it should be generic as possible to fetch the data from different files.
Description of Parsing NASA Thermodynamic Data :-
The aim of the project is to write a program in such a way that extracts the 14 co-efficients and calculates the enthalpy, entropy and specific heats for all the species in the data file. The formulae are shown below.
- The first 7 coefficients are High-temperature coefficients and the Second 7 coefficients are Low-temperature coefficients.
- Here R is the universal gas constant, T is the temperature, cp is Specific Heat, H is Enthalpy, S is entropy.
Molecular Weight :-
Molecular weight is a measure of the sum of the atomic weight values of the atoms in a molecule. Molecular weight is used to determine stoichiometry in chemical reactions and equations.
Molecular weight is either unit less or expressed in terms of atomic mass units(amu) or Daltons(Da).
Steps For Parsing The Data:-
- dat file is opened by using the ‘fopen’ command and the file is read by using ‘fgetl’ command.
- Header information is read by using ‘strsplit’ command and this command is used to split the string, and by using this global temperatures are extracted from the TERMO.dat file.
- Then By using the ‘for loop’ all the 53 species are read and the main program is given inside the loop.
- Species name and local temperatures are extracted using the ‘strsplt’ command.
- In order to get the coefficients ‘strfind’ command is used to find the variable ‘E’ and the coefficients obtained are in the form of strings, ‘str2double’ command is used for converting the strings to value.
- Folder is created in the directory for saving all the plots, for that ‘mkdir’ command is used.
- For plotting set of temperatures are needed, so for that temperatures are splitted into 1000 points between T1 and T3, As T1 is low temperature coefficient and T2 is high temperature coefficient
- R value is specified as it is constant.
- As we have 3 temperatures for dividing into 2 coefficients mid temperature T2 is taken as reference, so that T1 and T3 will be Low and High temperature coefficients.
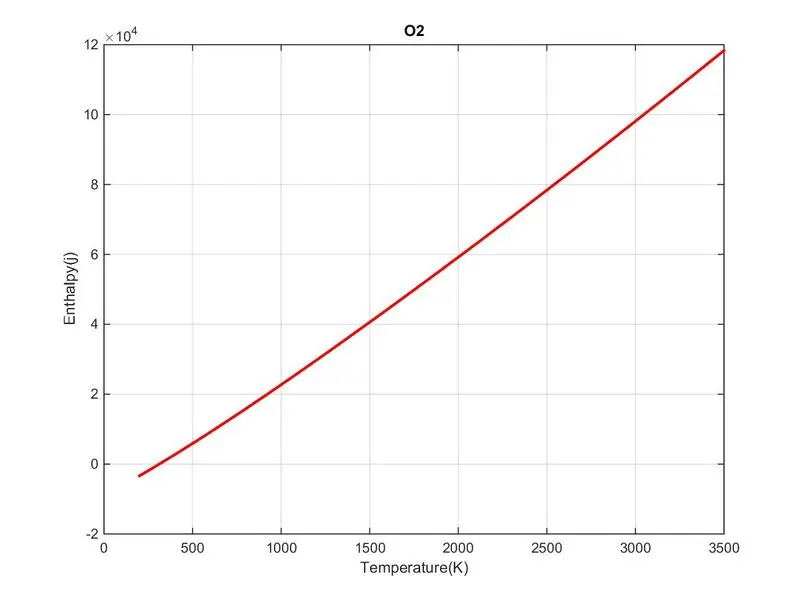
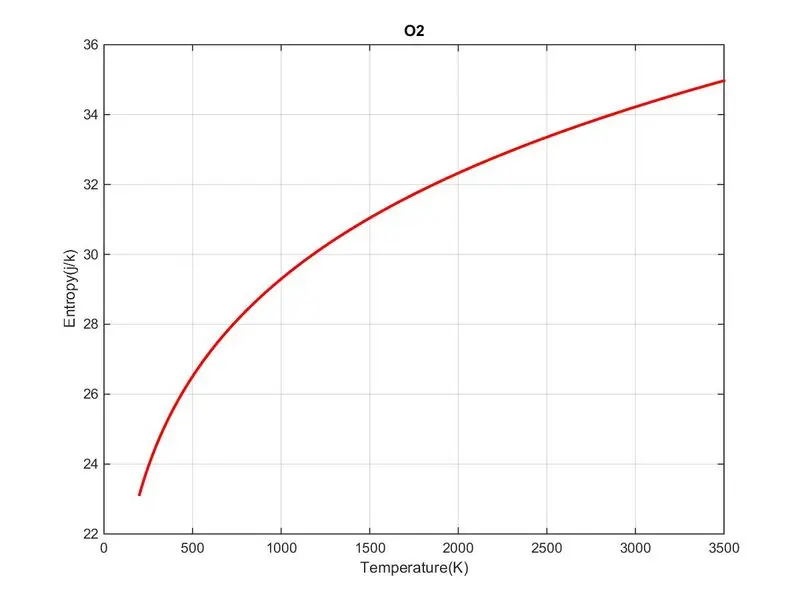
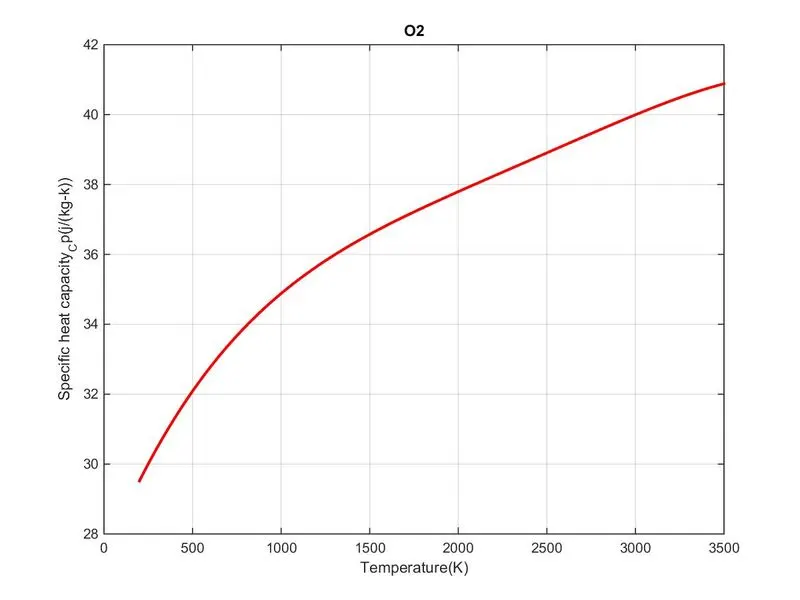
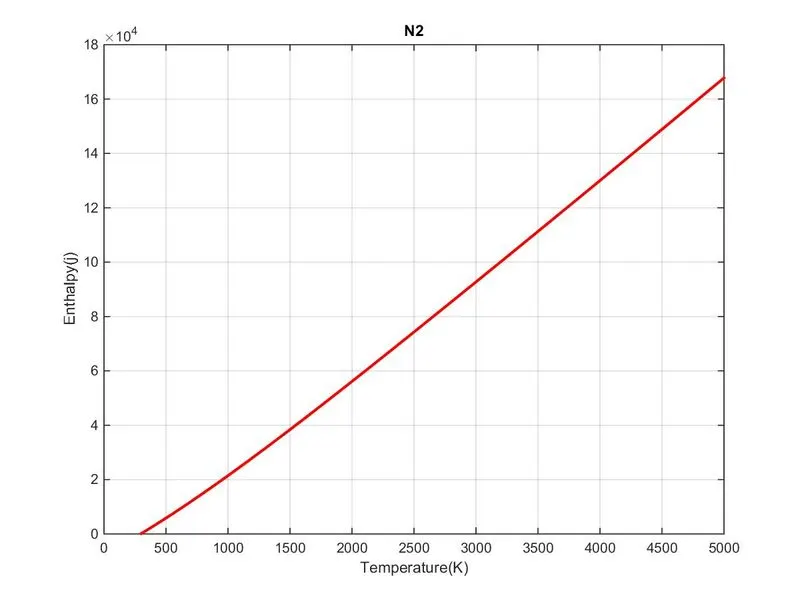
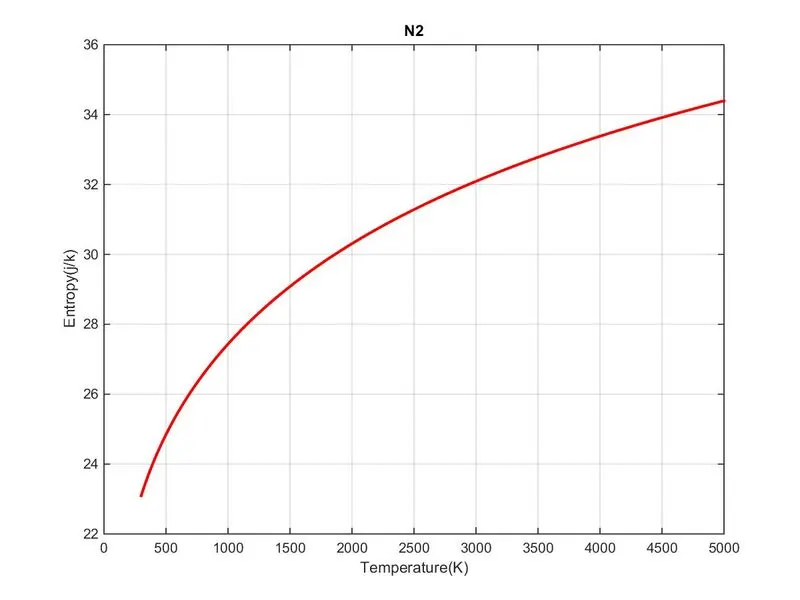
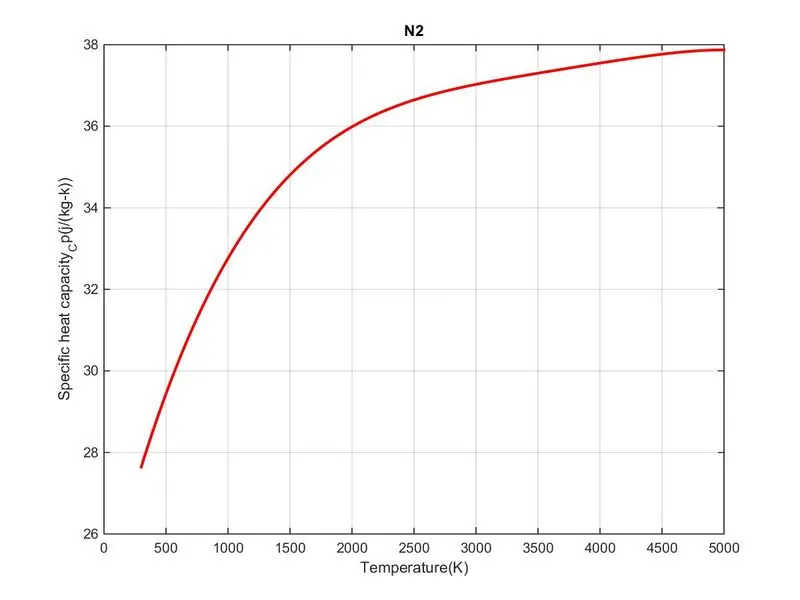
- By using the formulae specific heat, enthalpy and entropy are calculated and plots are obtained by using these values.
- Command cd is used for saving the plots in the specified folder.
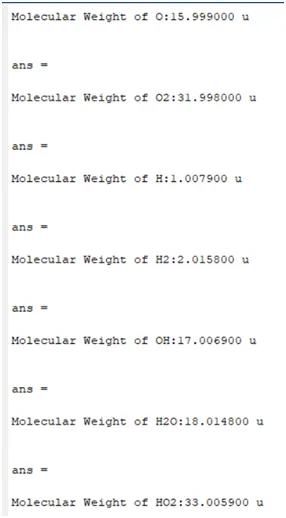
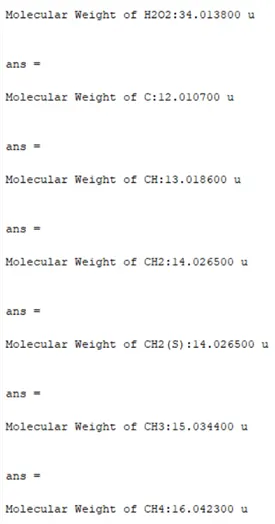
- By using the atomic weights of the atoms, molecular weight is calculated for that ‘strcmp’ is used. Two ‘for loops’ are used for calculating the Molecular weight.
Matlab Program For Parsing The Species And Calculating The Molecular Weight :-
clear all
close all
clc
%getting the data file
thermo = fopen('THERMO.dat','r');
fgetl(thermo)
%reading the header information
L1 = fgetl(thermo);
temp =strsplit(L1,' ');
global_low_temp = str2num(temp{2});
global_mid_temp = str2num(temp{3});
global_high_temp = str2num(temp{4});
%skipping next three lines
for i = 1:3
fgetl(thermo);
end
%reading the species
for j = 1:53
% Getting Species Name
tline = fgetl(thermo);
s = strsplit(tline,' ');
species_name = (s{1});
f = length(s);
%getting local temperatures
local_low_temp = str2double(s{f-3});
local_mid_temp = str2double(s{f-1});
local_high_temp= str2double(s{f-2});
T1 = local_low_temp;
T2 = local_mid_temp;
T3 = local_high_temp;
line_1 = fgetl(thermo);
a = strfind(line_1,'E');
a1 = str2double(line_1(1:a(1)+3));
a2 = str2double(line_1(a(1)+4:a(2)+3));
a3 = str2double(line_1(a(2)+4:a(3)+3));
a4 = str2double(line_1(a(3)+4:a(4)+3));
a5 = str2double(line_1(a(4)+4:a(5)+3));
line_2 = fgetl(thermo);
a_1 = strfind(line_2,'E');
a6=str2double(line_2(1:a_1(1)+3));
a7=str2double(line_2(a_1(1)+4:a_1(2)+3));
a8=str2double(line_2(a_1(2)+4:a_1(3)+3));
a9=str2double(line_2(a_1(3)+4:a_1(4)+3));
a10=str2double(line_2(a_1(4)+4:a_1(5)+3));
line_3 = fgetl(thermo);
a_2 = strfind(line_3,'E');
a11= str2double(line_3(1:a_1(1)+3));
a12= str2double(line_3(a_1(1)+4:a_1(2)+3));
a13= str2double(line_3(a_1(2)+4:a_1(3)+3));
a14= str2double(line_3(a_1(3)+4:a_1(4)+3));
%creating folder
mkdir(['C:\Users\user\Desktop\Pranai\MATLAB\File_Parsing\Images\',species_name]);
T = linspace(T1,T3,1000);
R = 8.314;
for m = 1:length(T)
if T(m)>T2
%high temperature coeffeceints.
cp=(a1+a2.*T+a3.*T.^2+a4.*T.^3+a5.*T.^4)*R;
H=(a1+(a2.*T)/2+(a3.*T.^2)/3+(a4.*T.^3)/4+(a5.*T.^4)/5+(a6./T))*R.*T;
S=a1.*log(T)+a2.*T+(a3.*T.^2)/2+(a4.*T.^3)/3+(a5.*T.^4)/4+a7;
else
%low temperature coeffecients
cp=(a8+a9.*T+a10.*T.^2+a11.*T.^3+a12.*T.^4)*R;
H=(a8+(a9.*T)/2+(a10.*T.^2)/3+(a11.*T.^3)/4+(a12.*T.^4)/5+(a13./T))*R.*T;
S=a8.*log(T)+a9.*T+(a10.*T.^2)/2+(a11.*T.^3)/3+(a12.*T.^4)/4+a14;
end
end
%plot for Temperature vs specific heat capacity
figure(1)
plot(T,cp,'color','r','linewidth',2)
grid on
xlabel('Temperature(K)')
ylabel('Specific heat capacity_Cp(j/(kg-k))')
title(species_name)
%plot for Temperature vs Enthalpy
figure(2)
plot(T,H,'color','r','linewidth',2)
grid on
xlabel('Temperature(K)')
ylabel('Enthalpy(j)')
title(species_name)
%plot for Temperature vs Entropy
figure(3)
plot(T,S,'color','r','linewidth',2)
grid on
xlabel('Temperature(K)')
ylabel('Entropy(j/k)')
title(species_name)
%changing the directory and saving the file
cd(['C:\Users\user\Desktop\Pranai\MATLAB\File_Parsing\Images\',species_name]);
% saving the files
saveas(1,'specific heat','jpg');
saveas(2,'enthalpy','jpg');
saveas(3,'entropy','jpg');
%molecular_masscalculation
elements=['H','C','O','N','A'];
atomic_weight=[1.0079 12.0107 15.999 14.0067 39.948];
molecular_mass=0;
for l=1:length(species_name)
for k=1:length(atomic_weight)
if strcmp(species_name(l),elements(k))
molecular_mass = molecular_mass+atomic_weight(k);
position=k;
end
end
n=str2double(species_name(l));
if n>1
molecular_mass = molecular_mass+atomic_weight(position)*(n-1);
end
end
sprintf('Molecular Weight of %s:%f u',species_name,molecular_mass)
end
fclose(thermo)
Result :-
- Molecular weights of the elements
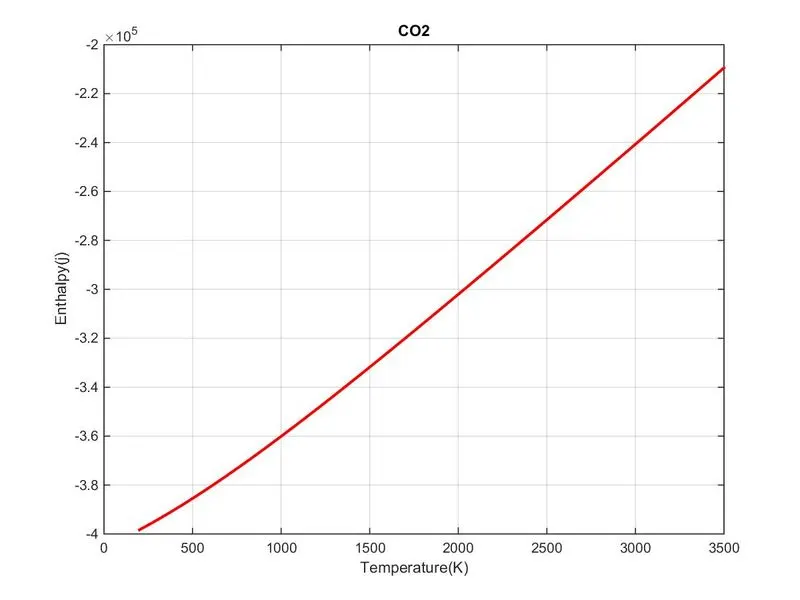
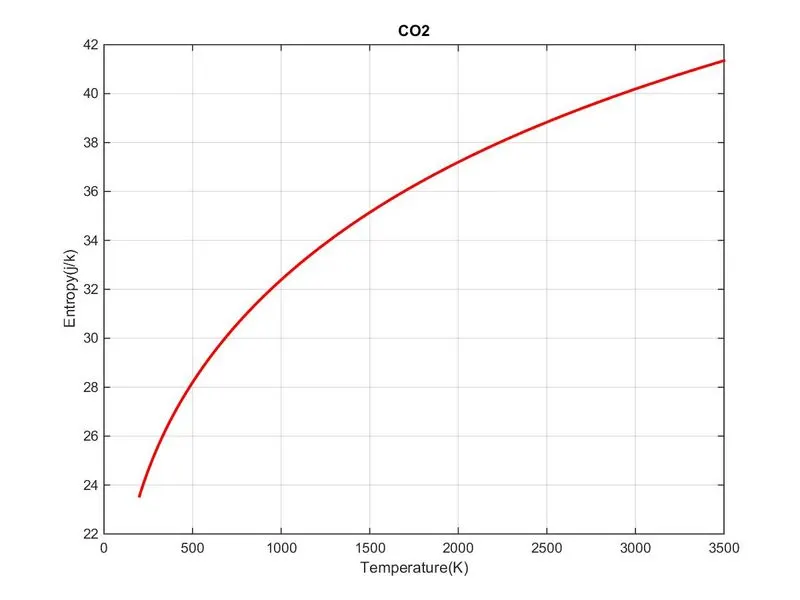
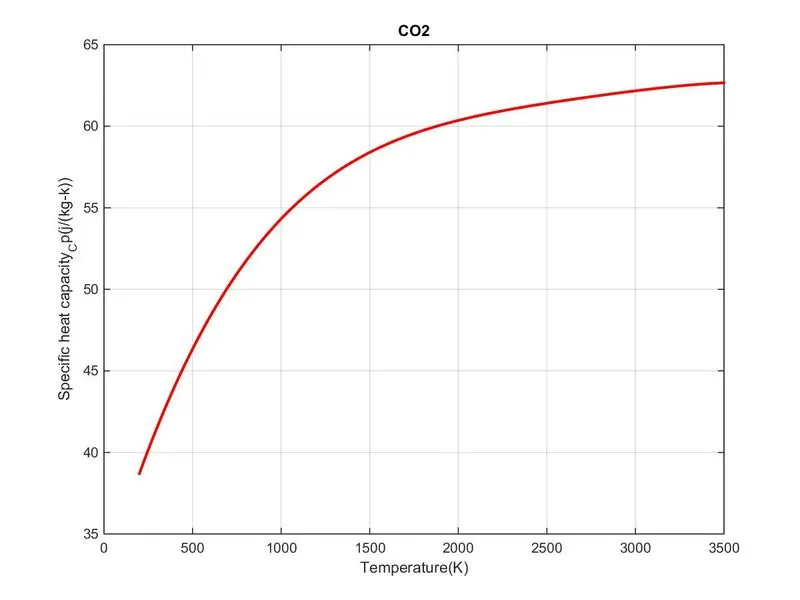
2. Plots of O2, N2, Co2 are shown below.
3. Directory where the files saved