Project 1 - Parsing NASA thermodynamic data
Intro:
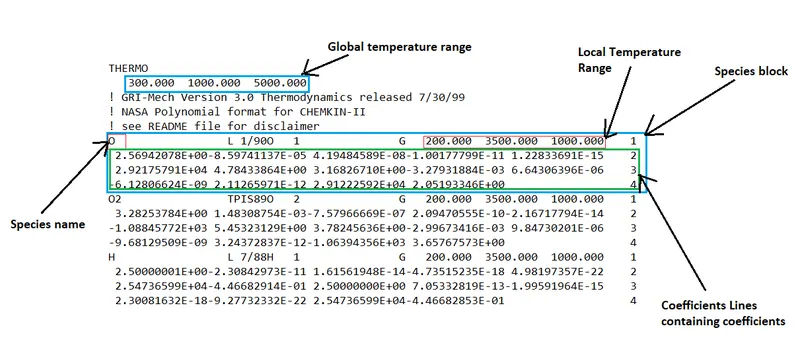
We are going to perform file parsing of NASA's Thermo Data file to extract the species and its coefficient and plot the Cp vs T, H vs T, S vs T. We will also calculate molecular weight of all 53 species. The given thermo data file contains 53 species whose Cp vs T, H vs T, S vs T plots need to be saved in seperate folders of respective species by the program code itself. Following Image shows the some part of the give data file. The Cp, H, S can be calculated by using following NASA's formulae.
`Cp = (a1 + a2*T + a3*T^2 + a4*T^3 + a5*T^4)R`
`H = (a1 + (a2*T)/2 + (a3*T^2)/3 + (a4*T^3)/4 + (a5*T^4)/5 + (a6)/T)RT`
`S = (a1*ln(T) + a2*T + (a3*T^2)/2 + (a4*T^3)/3 + (a5*T^4)/4 + a7)R`
where,
T = temperature
R = Universal Gas constant
Cp = Specific Heat
H = Enthalpy
S = Entropy
Some part of Data file :
Inputs:
R = 8.314,
H = 1.0079,
C = 12.0107,
O = 15.999,
A = 39.948,
N = 14.0067
Main Program Code:
clear all
close all
clc

% Opening and reading the NASA's Thermo data file
f1 = fopen("THERMO.dat","r");
fgetl(f1);

% Reading Header
H = fgetl(f1);
H = strsplit(H,' ');
Global_low_temp = str2double(H{2});
Global_mid_temp = str2double(H{3});
Global_High_temp = str2double(H{4});

% Skipping the comment lines
for i = 1:3
    fgetl(f1);
end

% Reading all 53 species
for i = 1:53
    % Extracting species name, local temperature ranges and coefficients
    species_data_line = fgetl(f1);
    x = strsplit(species_data_line,' ');
    species_name = (x{1});
    species_block_first_line = length(x);

    % Defining local temperature ranges
    local_low_temp = str2double(x{species_block_first_line-3});
    local_high_temp = str2double(x{species_block_first_line-2});
    local_mid_temp = str2double(x{species_block_first_line-1});

    % Defining temperature for Cp, H, S
    t1 = local_low_temp;
    t2 = local_mid_temp;
    t3 = local_high_temp;

    % Defining species coefficient
    % Defining coefficients with variable 'a'
    % Defining coefficient line 1
    coefficient_line_1 = fgetl(f1);

    % Locating position of 'E' in line 1
    line_1 = strfind(coefficient_line_1,'E');
    a1 = str2double(coefficient_line_1(1:line_1(1)+3));
    a2 = str2double(coefficient_line_1(line_1(1)+4:line_1(2)+3));
    a3 = str2double(coefficient_line_1(line_1(2)+4:line_1(3)+3));
    a4 = str2double(coefficient_line_1(line_1(3)+4:line_1(4)+3));
    a5 = str2double(coefficient_line_1(line_1(4)+4:line_1(5)+3));

    % Defining coefficient line 2
    coefficient_line_2 = fgetl(f1);

    % Locating position of 'E' in line 2
    line_2 = strfind(coefficient_line_2,'E');
    a6 = str2double(coefficient_line_2(1:line_2(1)+3));
    a7 = str2double(coefficient_line_2(line_2(1)+4:line_2(2)+3));
    a8 = str2double(coefficient_line_2(line_2(2)+4:line_2(3)+3));
    a9 = str2double(coefficient_line_2(line_2(3)+4:line_2(4)+3));
    a10 = str2double(coefficient_line_2(line_2(4)+4:line_2(5)+3));

     % Defining coefficients line 3
    coefficient_line_3 = fgetl(f1);

    % Locating position of 'E' in line 3
    line_3 = strfind(coefficient_line_3,'E');
    a11 = str2double(coefficient_line_3(1:line_3(1)+3));
    a12 = str2double(coefficient_line_3(line_3(1)+4:line_3(2)+3));
    a13 = str2double(coefficient_line_3(line_3(2)+4:line_3(3)+3));
    a14 = str2double(coefficient_line_3(line_3(3)+4:line_3(4)+3));

    % Creating directory for species
    mkdir(['C:\Users\HP\Documents\MATLAB\data_parsing\photos\',species_name]);

    % Defining R & temperature for Cp, H, S
    R = 8.314;
    T = linspace(t1,t3,500);
    for j = 1:length(T)

        % Assigning coefficients as HTC(a1-a7) and LTC(a8-a14) for Cp, H, S
        % HTC refers to High temperature coefficient
        % LTC refers to Low temperature coefficient
        if T(j)>t2

            % for HTC(a1-a7)
            Cp = (a1 + a2.*T + a3.*T.^2 + a4.*T.^3 + a5.*T.^4)*R;

            H = (a1 + (a2.*T)/2 + (a3.*T.^2)/3 + (a4.*T.^3)/4 + (a5.*T.^4)/5 + (a6./T))*R.*T;

            S = (a1.*log(T) + a2.*T + (a3.*T.^2)/2 + (a4.*T.^3)/3 + (a5.*T.^4)/4 + a7)*R;

        else

            % for LTC(a8-a14)
            Cp = (a8 + a9.*T + a10.*T.^2 + a11.*T.^3 + a12.*T.^4)*R;

            H = (a8 + (a9.*T)/2 + (a10.*T.^2)/3 + (a11.*T.^3)/4 + (a12.*T.^4)/5 + (a13./T))*R.*T;

            S = (a8.*log(T) + a9.*T + (a10.*T.^2)/2 + (a11.*T.^3)/3 + (a12.*T.^4)/4 + a14)*R;
        end
    end

% Ploting [Cp vs T] [H vs T] [S vs T]
figure(1)
plot(T,Cp,'LineWidth',2);
grid on;
xlabel('Temperature');
ylabel('Specific Heat [Cp]');
title(species_name);

figure(2)
plot(T,H,'LineWidth',2, "Color",'r');
grid on;
xlabel('Temperature');
ylabel('Enthalpy [H]');
title(species_name);

figure(3)
plot(T,S,'LineWidth',2,"Color",'g');
grid on;
xlabel('Temperature');
ylabel('Entropy [S]');
title(species_name);

% Changing directory and saving the plot images of all species
cd(['C:\Users\HP\Documents\MATLAB\data_parsing\photos\',species_name]);
saveas(1,'specific heat','jpg');
saveas(2,'Enthalpy','jpg');
saveas(3,'Entropy','jpg');

% Molecular mass
% Defining common elements
elements = ['H','C','O','A','N'];

% Defining Atomic weight for elements respectively
atomic_weight = [1.0079 12.0107 15.999 39.948 14.0067];

% Defining molecular weight for all species
% Defining 1st molecular mass
molecular_mass = 0;

for k = 1:length(species_name)
    for l = 1:length(atomic_weight)
        if strcmp(species_name(k), elements(l))
            molecular_mass = molecular_mass + atomic_weight(l);
            species_position = l;
        end
    end
    n = str2double(species_name(k));
    if n>1
        molecular_mass = molecular_mass + atomic_weight(species_position)*(n-1);
    end
end

% Printing molecular weight for all species
sprintf('Molecular Weight of %s = %f u',species_name,molecular_mass)
end

fclose(f1);
Code Explanation:
- Clear all, Close all, clc are used to clear anything present on page.
- After which we used fopen command to open and read the given nasa thermo data file. We assigned the data file as f1.
- Then we use fgetl command to read the first line but not take it.
- After which we deifined the header portion with same fgetl command and processed it, further we used strsplit command to split the header information.
- Then in same line, we defined the global temperature range using str2double command.
- Again fgetl command was used to skip the next 3 lines from the data as it contained only comments and nothing to take into account.
- Now, we used for loop to process the same upcoming steps for all 53 species, Next we extracted the name, local temperature range line of species with fgetl command, futher which we splitted the line w.r.t 'space' using strsplit command.
- Then from the same line, species name was extracted and also its local temperature range was defined using str2double command which convert the string into scalar values.
- Then we assigned t1,t2,t3 for local low temp, local mid temp, local high temp respectively.
- We then extracted the first line containing first 5 coefficient of respective species from species block using fgetl command, after which we located all 'E' from same line using strfind and then using those positions we defined the first 5 coefficients and assigned them as a1, a2, a3, a4, a5. We also used str2double command to convert the string into scalar values for all the 5 coefficient.
- Same way, we extracted next 2 coefficient lines of same species containing 5 and 4 coefficients respectively and assigned them as a6, a7, a8, a9, a10 from 1st line and a11, a12, a13, a14 from 2nd line.
- We then used mkdir command which creates seperate folders for all species at specific directory asssigned to it.
- We then defined input R value and T which refers to temperature which will be used to define Cp, H, S. We used linspace command for temperature with previously defined t1 as x1, t3 as x2 and 500 no. of time values between x1 and x2 in the linspace command.
- Then for 1:length(T), we calculated specific heat, Enthalpy, Entropy using given formulae:
`Cp = (a1 + a2*T + a3*T^2 + a4*T^3 + a5*T^4)R`
`H = (a1 + (a2*T)/2 + (a3*T^2)/3 + (a4*T^3)/4 + (a5*T^4)/5 + (a6)/T)RT`
`S = (a1*ln(T) + a2*T + (a3*T^2)/2 + (a4*T^3)/3 + (a5*T^4)/4 + a7)R`
- Where a1-a7 coefficients which were defined previously, were used as High temperature coefficients [HTC] in these formulaes and, these a1-a7 coefficients were replaced by a8-a14 respectively and used as Low temperature coefficients [LTC].
- Then we used if to apply condition i.e. if the temperature is greater than local mid temperature then use high temperature coefficients a1-a7 for calculating Cp, H, S, else use low temperature coefficient a8-a14.
- Then we ploted the Cp vs T, H vs T, S vs T plots using plot command.
- Then we used cd command to change the directory w.r.t the specific directory which was previously created for storing the all species folder, as the current directory was not same.
- We then used saveas command to save the plots in jpg format in the species directory.
- Now we solve for molecular weight, In which we first defined the common elements H, C, O, A, N and their atomic weights 1.0079, 12.0107, 15.999, 39.948, 14.0067 respectively.
- Then we defined 1st molecular mass to be zero, after which we used for loop with which for all species and all defined atomic weights following steps were followed.
- We used if command following with strcmp command so that if the species name match to common elements defined, then the molecular mass will be molecular mass + atomic weight of that species.
- We then used fprintf command to print molecular weight for all species
- Now as explained earlier this same steps were repeated for all 53 species with the for loop command.
- Finally we used fclose command to close the data file.
Molecular weight output:
ans = 'Molecular Weight of O = 15.999000 u'
ans = 'Molecular Weight of O2 = 31.998000 u'
ans = 'Molecular Weight of H = 1.007900 u'
ans = 'Molecular Weight of H2 = 2.015800 u'
ans = 'Molecular Weight of OH = 17.006900 u'
ans = 'Molecular Weight of H2O = 18.014800 u'
ans = 'Molecular Weight of HO2 = 33.005900 u'
ans = 'Molecular Weight of H2O2 = 34.013800 u'
ans = 'Molecular Weight of C = 12.010700 u'
ans = 'Molecular Weight of CH = 13.018600 u'
ans = 'Molecular Weight of CH2 = 14.026500 u'
ans = 'Molecular Weight of CH2(S) = 14.026500 u'
ans = 'Molecular Weight of CH3 = 15.034400 u'
ans = 'Molecular Weight of CH4 = 16.042300 u'
ans = 'Molecular Weight of CO = 28.009700 u'
ans = 'Molecular Weight of CO2 = 44.008700 u'
ans = 'Molecular Weight of HCO = 29.017600 u'
ans = 'Molecular Weight of CH2O = 30.025500 u'
ans = 'Molecular Weight of CH2OH = 31.033400 u'
ans = 'Molecular Weight of CH3O = 31.033400 u'
ans = 'Molecular Weight of CH3OH = 32.041300 u'
ans = 'Molecular Weight of C2H = 25.029300 u'
ans = 'Molecular Weight of C2H2 = 26.037200 u'
ans = 'Molecular Weight of C2H3 = 27.045100 u'
ans = 'Molecular Weight of C2H4 = 28.053000 u'
ans = 'Molecular Weight of C2H5 = 29.060900 u'
ans = 'Molecular Weight of C2H6 = 30.068800 u'
ans = 'Molecular Weight of CH2CO = 42.036200 u'
ans = 'Molecular Weight of HCCO = 41.028300 u'
ans = 'Molecular Weight of HCCOH = 42.036200 u'
ans = 'Molecular Weight of H2CN = 28.033200 u'
ans = 'Molecular Weight of HCN = 27.025300 u'
ans = 'Molecular Weight of HNO = 31.013600 u'
ans = 'Molecular Weight of N = 14.006700 u'
ans = 'Molecular Weight of NNH = 29.021300 u'
ans = 'Molecular Weight of N2O = 44.012400 u'
ans = 'Molecular Weight of NH = 15.014600 u'
ans = 'Molecular Weight of NH2 = 16.022500 u'
ans = 'Molecular Weight of NH3 = 17.030400 u'
ans = 'Molecular Weight of NO = 30.005700 u'
ans = 'Molecular Weight of NO2 = 46.004700 u'
ans = 'Molecular Weight of HCNO = 43.024300 u'
ans = 'Molecular Weight of HOCN = 43.024300 u'
ans = 'Molecular Weight of HNCO = 43.024300 u'
ans = 'Molecular Weight of NCO = 42.016400 u'
ans = 'Molecular Weight of CN = 26.017400 u'
ans = 'Molecular Weight of HCNN = 41.032000 u'
ans = 'Molecular Weight of N2 = 28.013400 u'
ans = 'Molecular Weight of AR = 39.948000 u'
ans = 'Molecular Weight of C3H8 = 44.095300 u'
ans = 'Molecular Weight of C3H7 = 43.087400 u'
ans = 'Molecular Weight of CH3CHO = 44.052000 u'
ans = 'Molecular Weight of CH2CHO = 43.044100 u'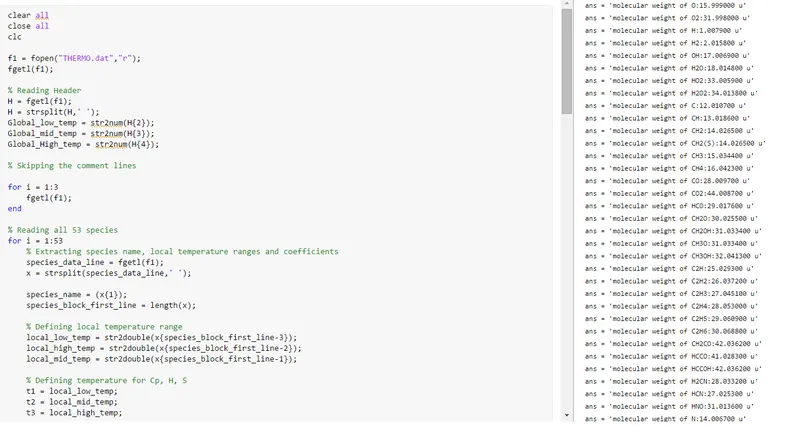
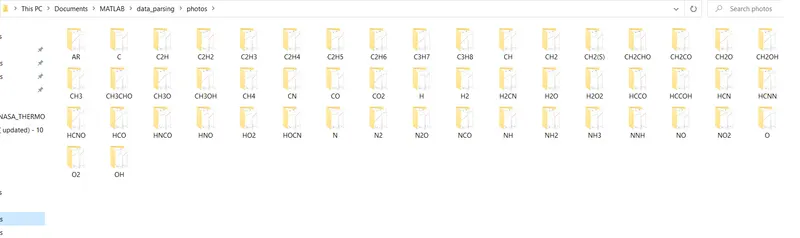
Window containing all species folder:
Plots of O2, N2, CO2:
- O2
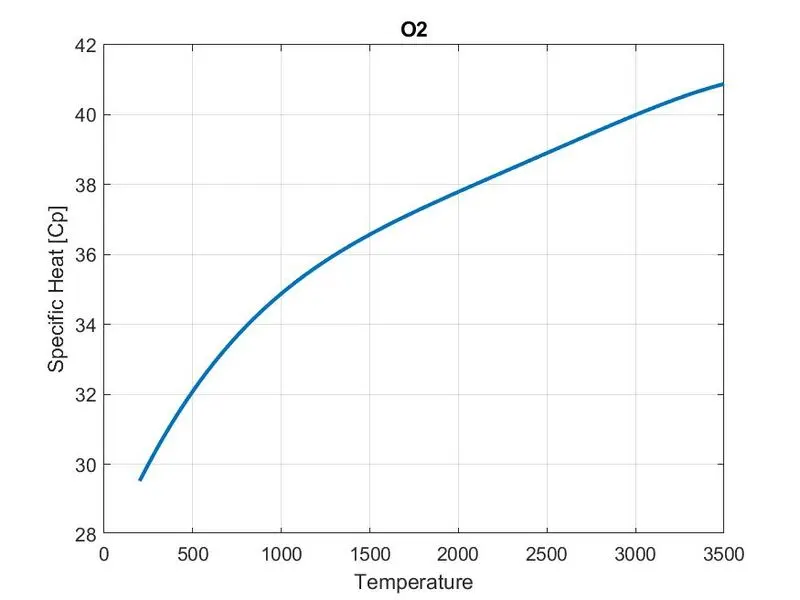
Temperature vs Specific Heat
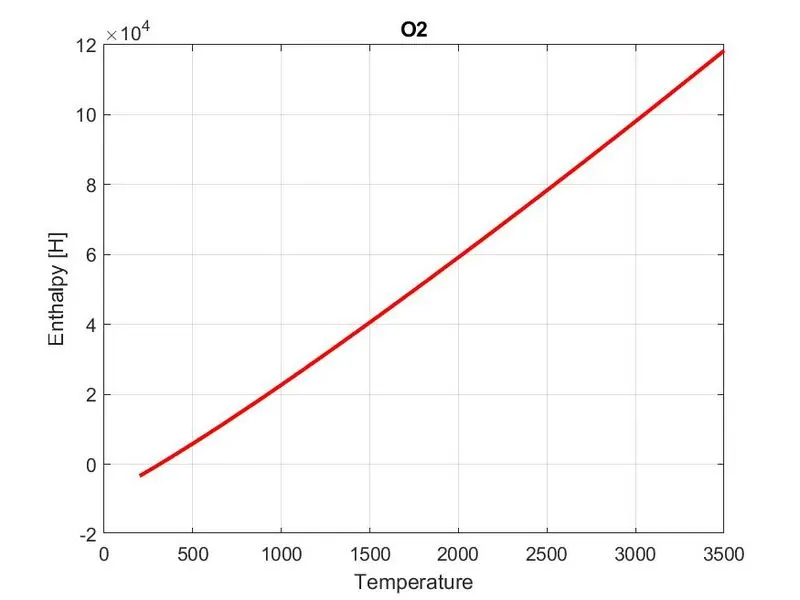
Temperature vs Enthalpy
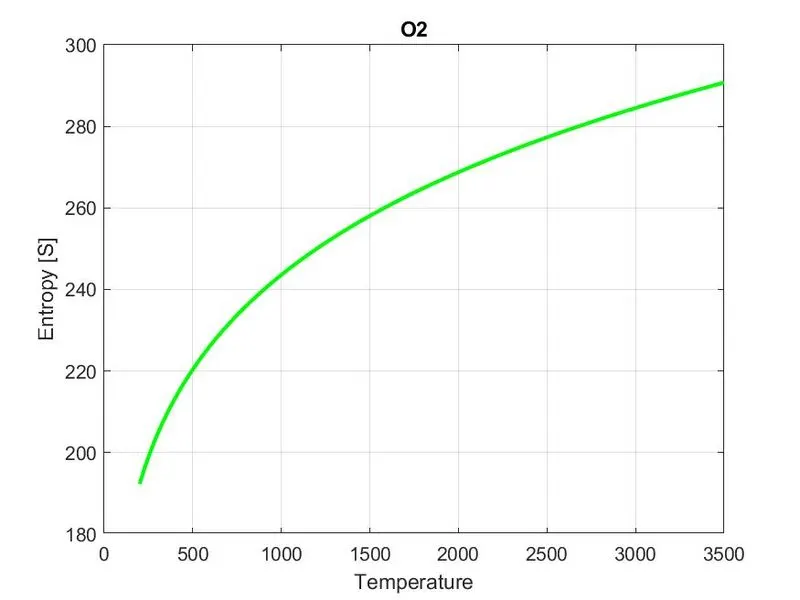
Temperature vs Entropy
- N2
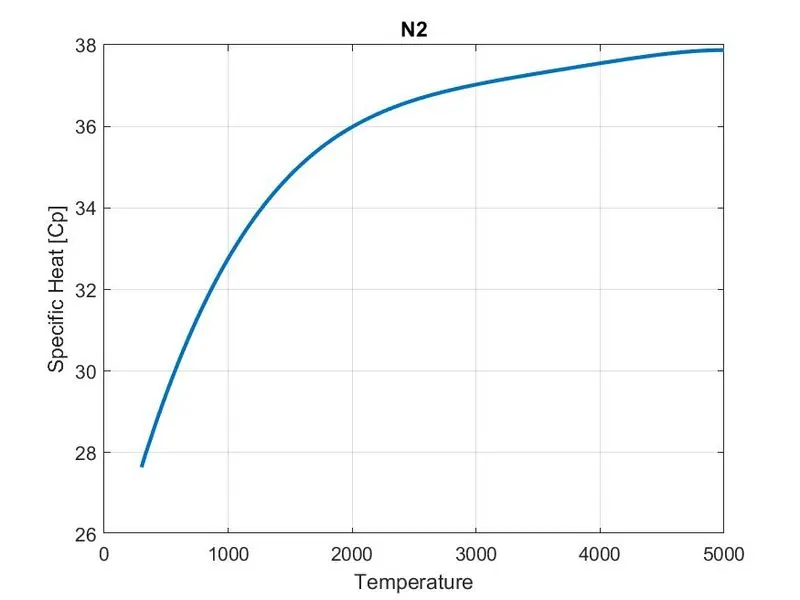
Temperature vs Specific Heat
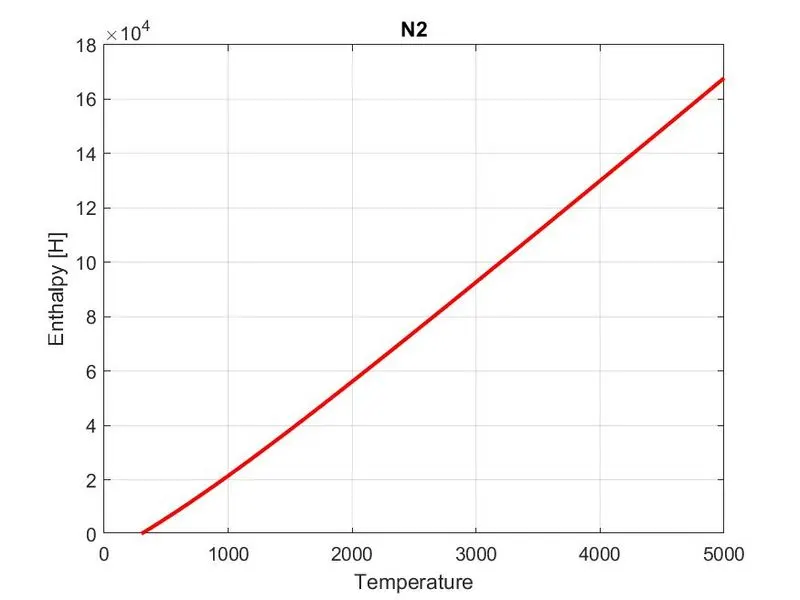
Temperature vs Enthalpy
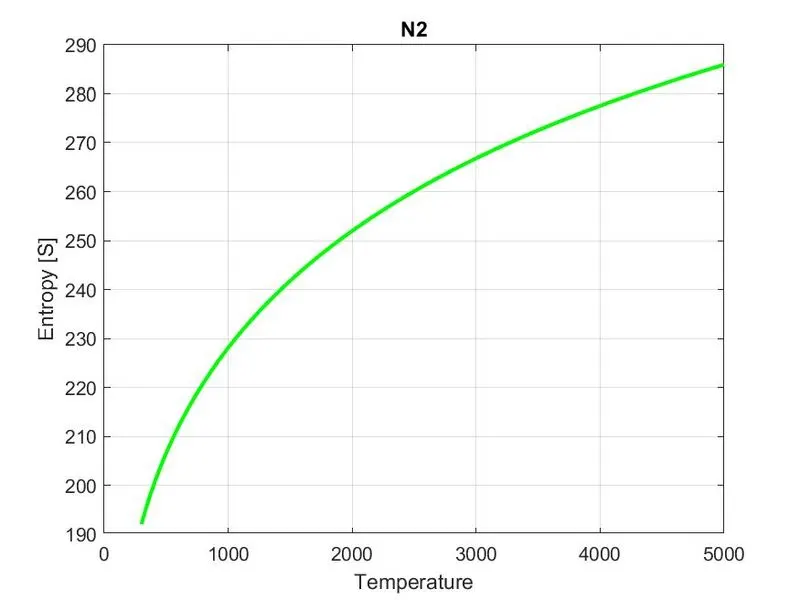
Temperature vs Entropy
- CO2
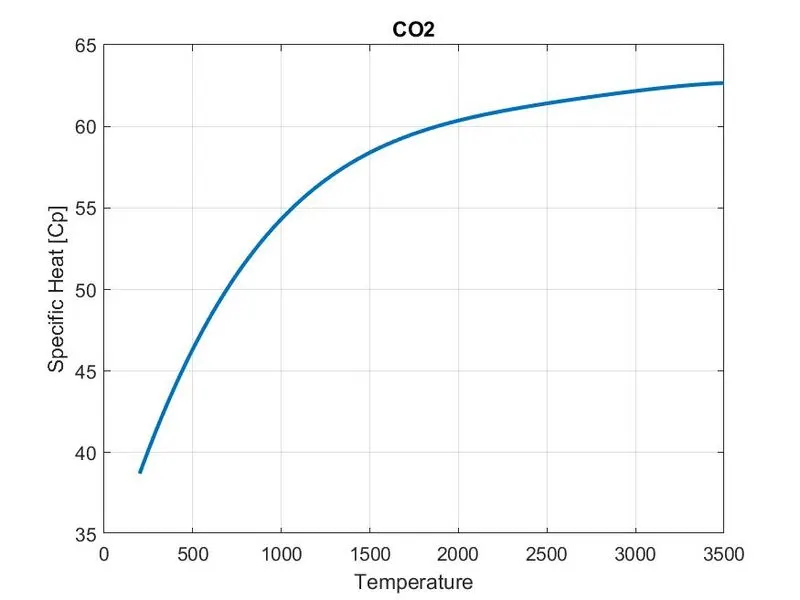
Temperature vs Specific Heat
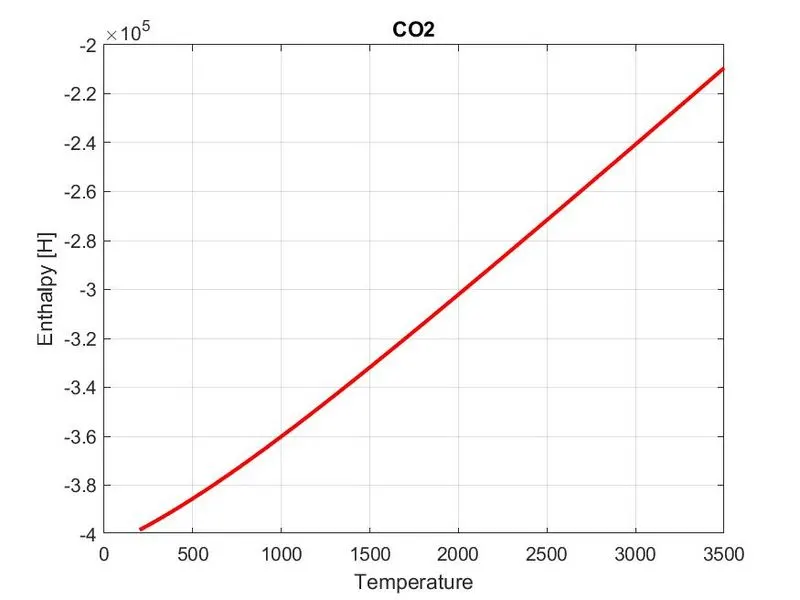
Temperature vs Enthalpy
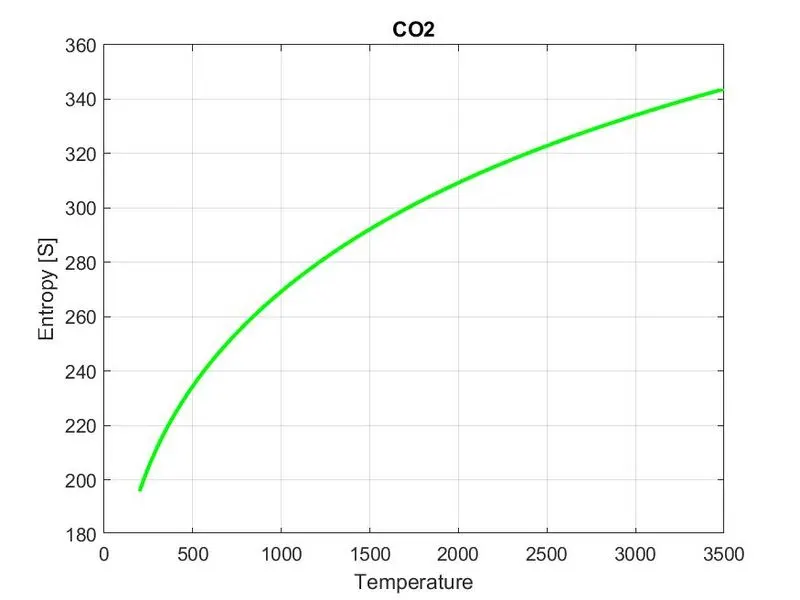
Temperature vs Entropy
Errors:
1st Error: Empty Delimator
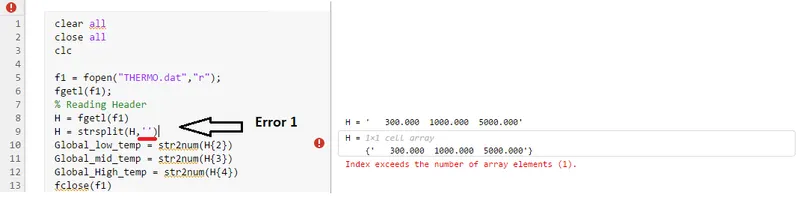
The above error was encountered due to empty delimator, in other words, the delimator wasn't defined. Therefore the cell array was 1x1 and not 1x3 to define the global temperature ranges.
Solution:
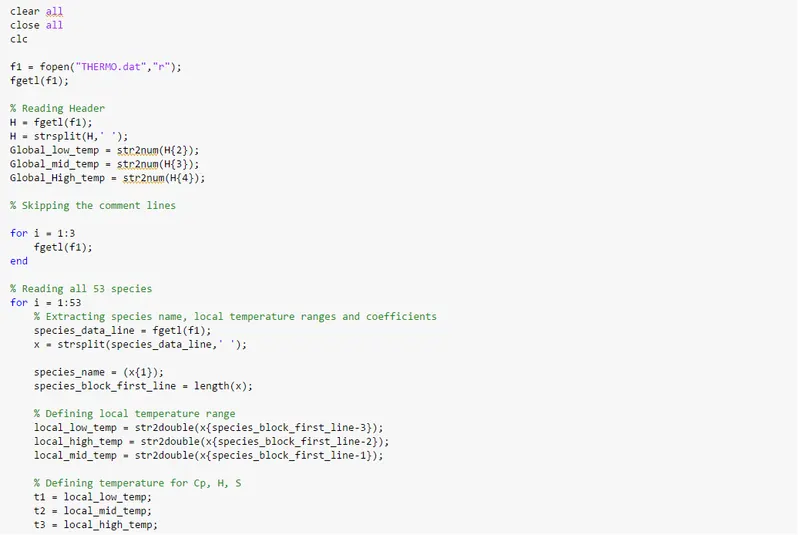
We added 'space' as delimator which solved the error defining H as 1x3 cell array and then the global temperature ranges were properly assigned by matlab.
2nd Error: Linewidth value error
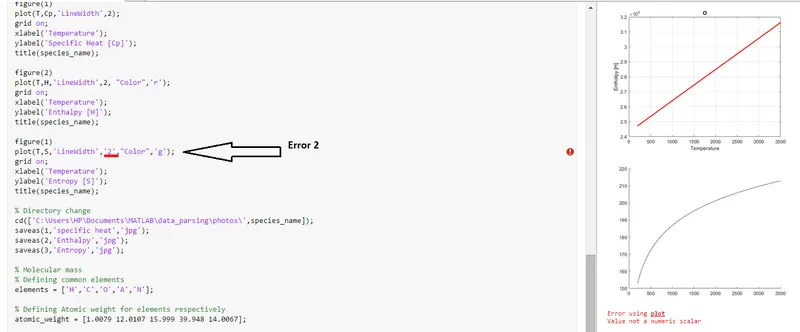
The line width was not assigned as numeric scalar value therfore we encountered this error.
Solution:
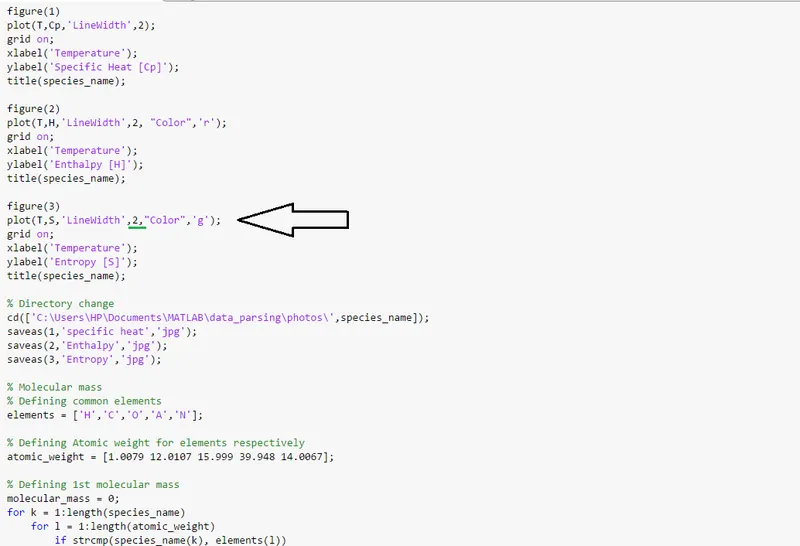
We solved it as shown in above image, by removing the ' '.
3rd Error: Figure no. error
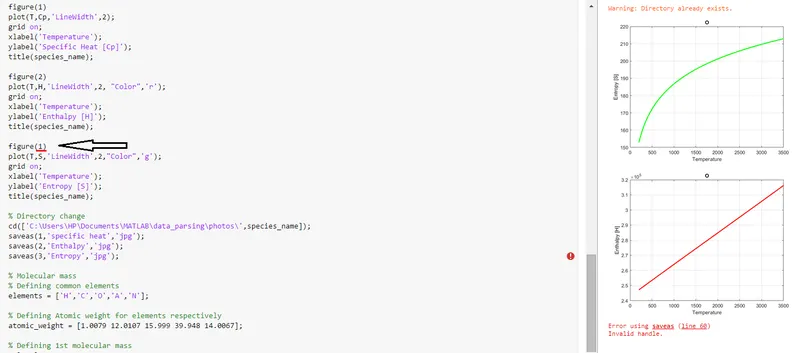
We encountered above error as the figure no was repeated
Solution:
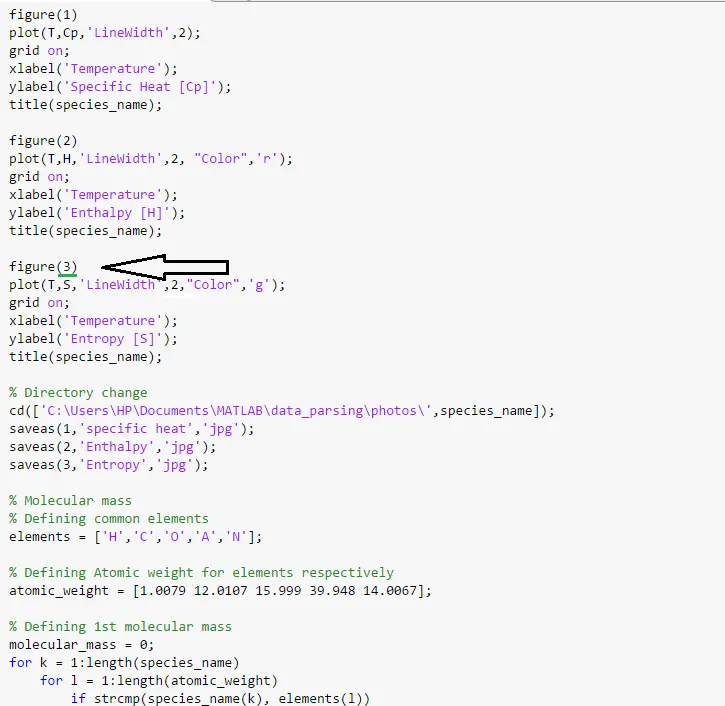
We solved it by replacing the no.